. 2022 Nov 7;219(11):e20220081.
doi: 10.1084/jem.20220081. Epub 2022 Sep 21.

Sleep exerts lasting effects on hematopoietic stem cell function and diversity

Affiliations

Sleep exerts lasting effects on hematopoietic stem cell function and diversity

Cameron S McAlpine et al. J Exp Med. .

Abstract

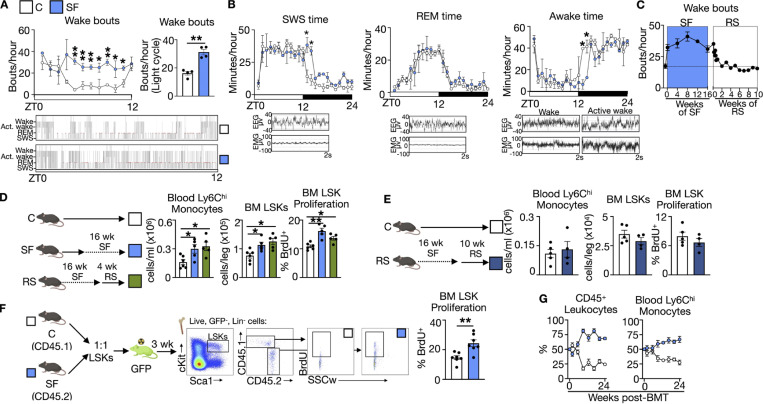
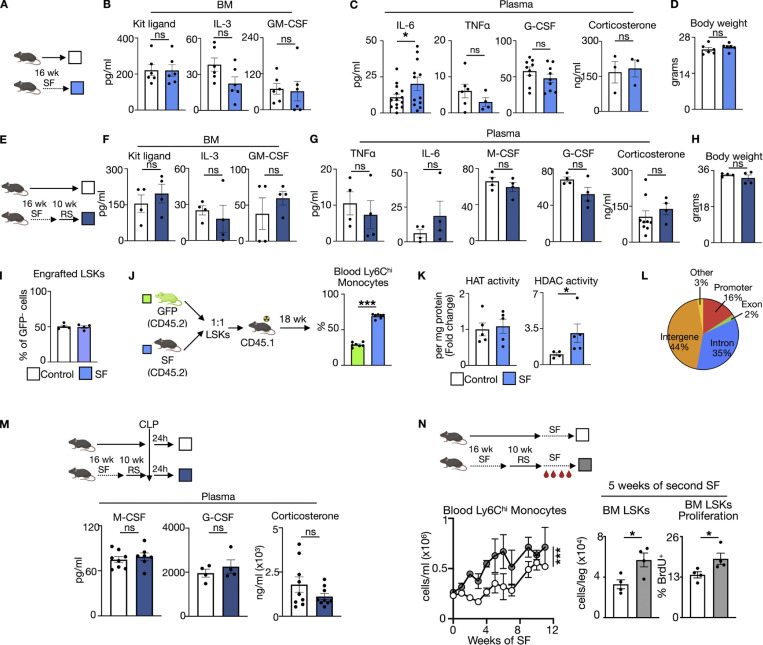
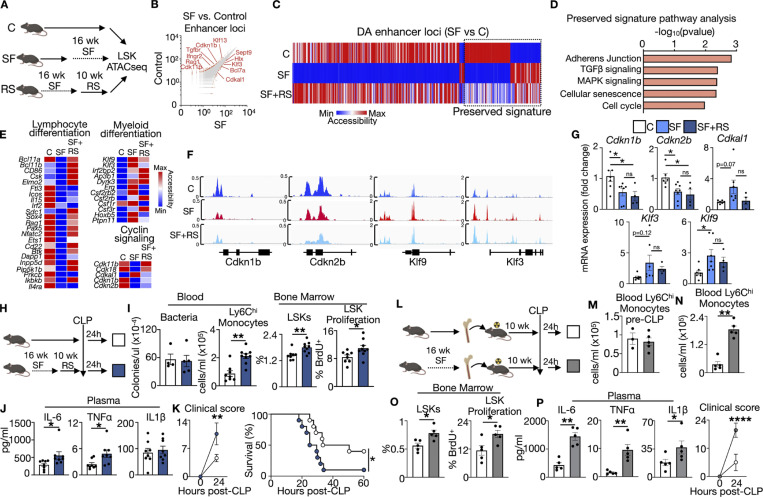
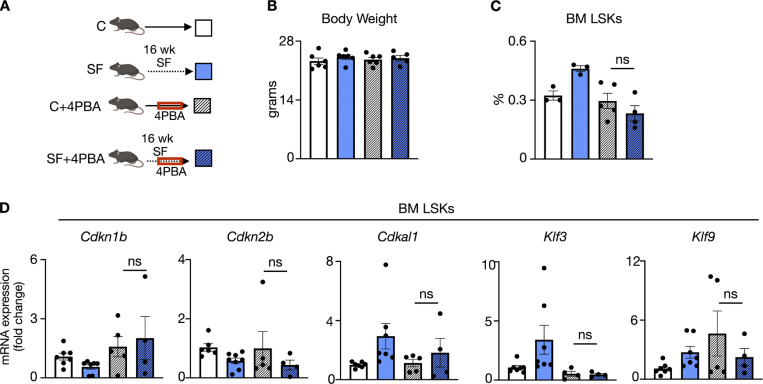
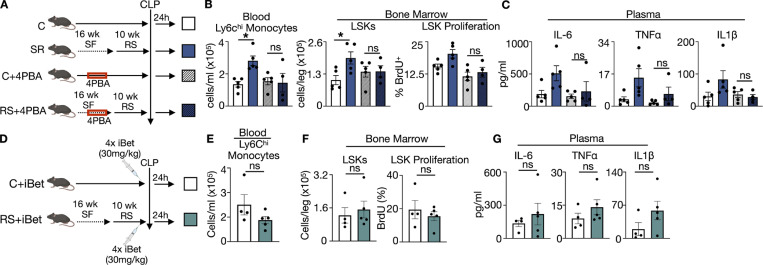
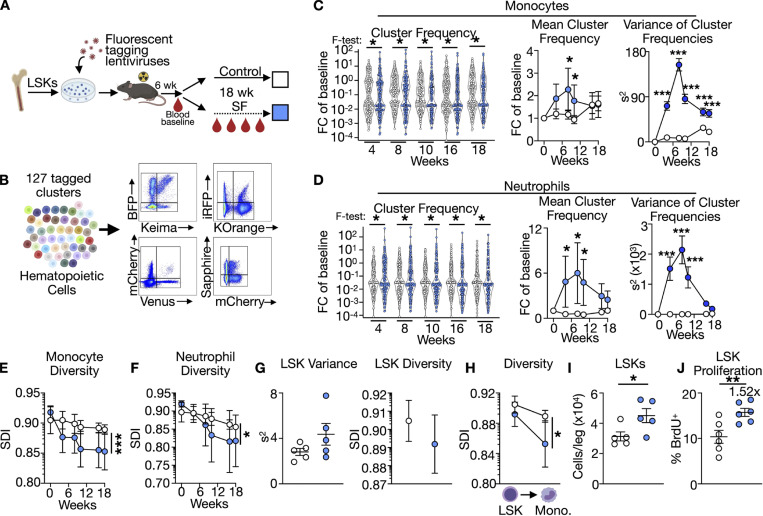
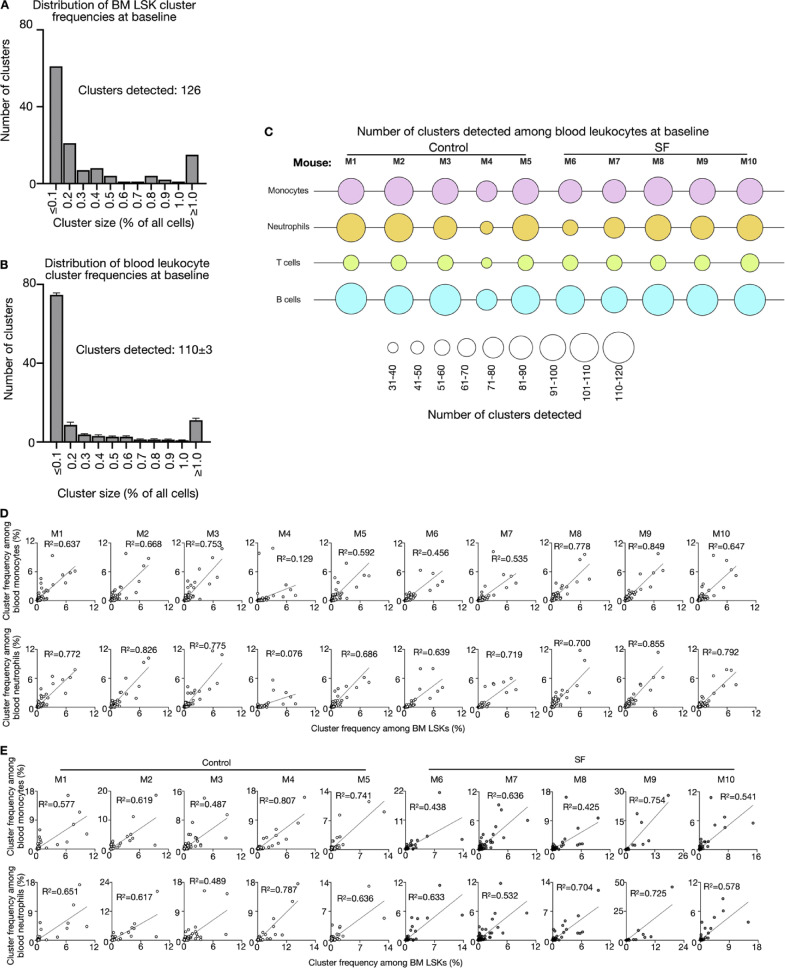
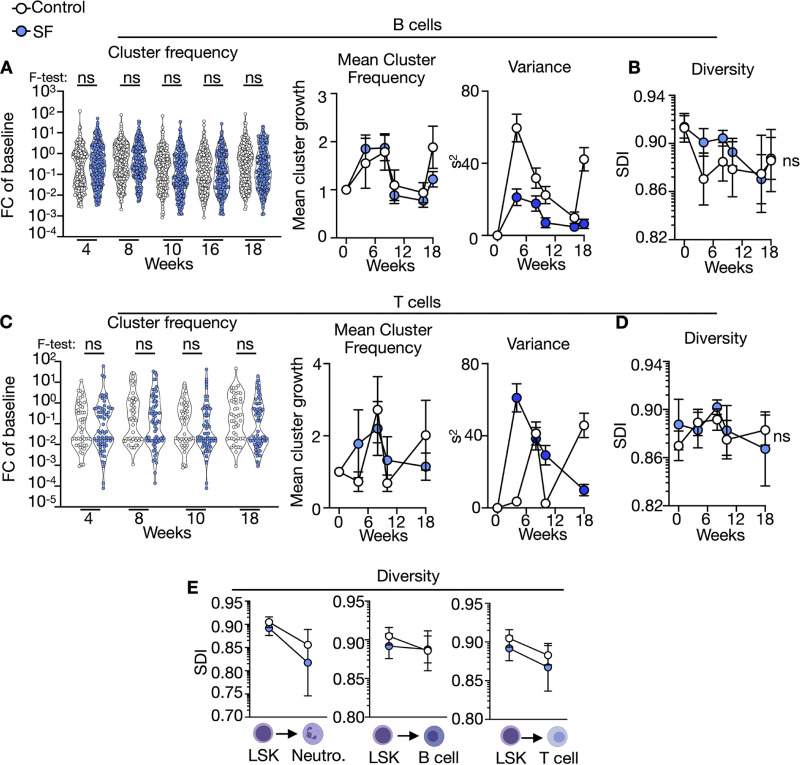
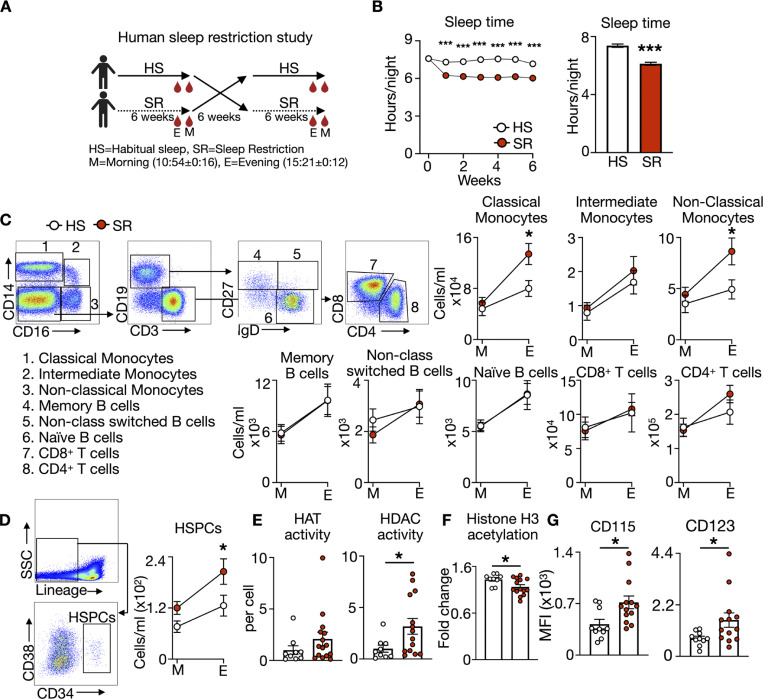
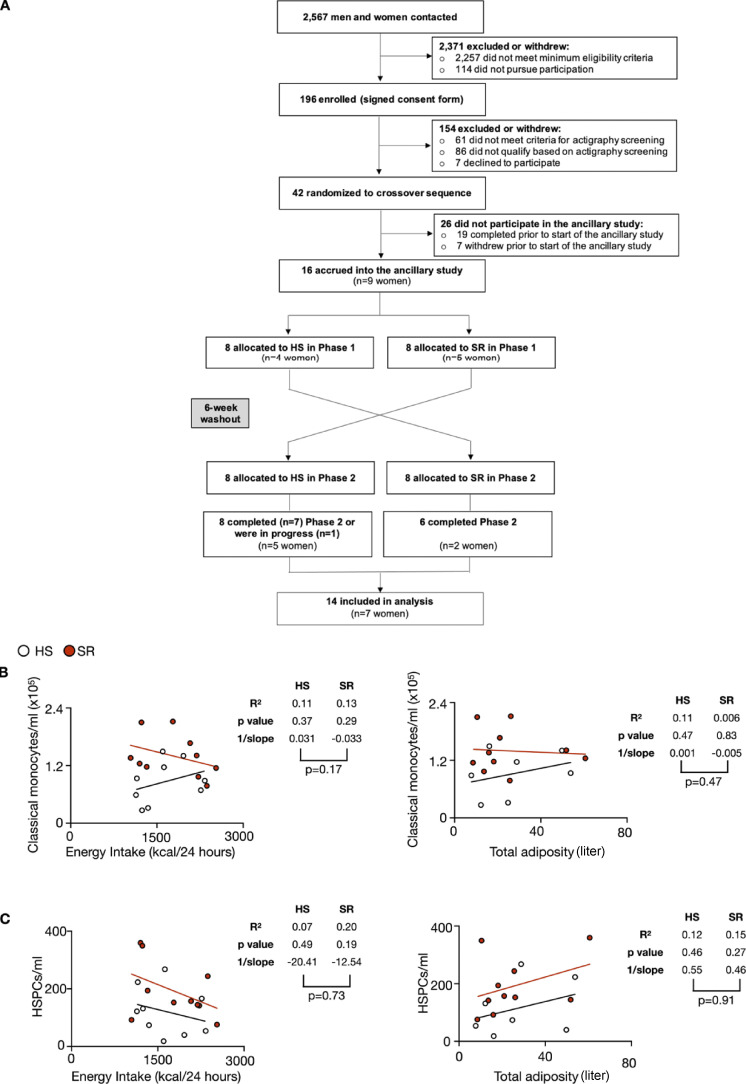
A sleepless night may feel awful in its aftermath, but sleep's revitalizing powers are substantial, perpetuating the idea that convalescent sleep is a consequence-free physiological reset. Although recent studies have shown that catch-up sleep insufficiently neutralizes the negative effects of sleep debt, the mechanisms that control prolonged effects of sleep disruption are not understood. Here, we show that sleep interruption restructures the epigenome of hematopoietic stem and progenitor cells (HSPCs) and increases their proliferation, thus reducing hematopoietic clonal diversity through accelerated genetic drift. Sleep fragmentation exerts a lasting influence on the HSPC epigenome, skewing commitment toward a myeloid fate and priming cells for exaggerated inflammatory bursts. Combining hematopoietic clonal tracking with mathematical modeling, we infer that sleep preserves clonal diversity by limiting neutral drift. In humans, sleep restriction alters the HSPC epigenome and activates hematopoiesis. These findings show that sleep slows decay of the hematopoietic system by calibrating the hematopoietic epigenome, constraining inflammatory output, and maintaining clonal diversity.


Conflict of interest statement

Disclosures: M. Nahrendorf reported receiving funds or material research support from Lilly, Alnylam, Biotronik, CSL Behring, GlycoMimetics, GSK, Medtronic, Novartis, and Pfizer, as well as consulting fees from Biogen, Gimv, IFM Therapeutics, Molecular Imaging, Sigilon, NovoNordisk, Verseau Therapeutics, and Bitterroot. No other disclosures were reported.

Figures

Figure 1.
Figure 1.
Sleep exerts a prolonged influence on hematopoiesis. (A) Quantification of wake bouts (transitions from sleep to wake states), during the resting (light) period along with a representative hypnogram in control (C) and SF mice. n = 4 mice per group. (B) Quantification of minutes per hour in SWS, REM sleep, and awake time, along with representative EEG and EMG traces, in control and SF animals over 24 h. n = 4 mice per group. (C) Quantification of resting period wake bouts over 16 wk of SF followed by 10 wk of RS. n = 4 mice per group. (D) Enumeration of blood Ly6Chi monocytes and BM LSKs, along with LSK BrdU incorporation in control mice, SF mice, and mice exposed to 16 wk of SF followed by 4 wk of RS. n = 5–6 mice per group. (E) Enumeration of blood Ly6Chi monocytes and BM LSKs, along with LSK proliferation in a distinct cohort of control mice and mice exposed to 16 wk of SF followed by 10 wk of RS. n = 4 mice per group. (F) BrdU incorporation into LSKs from control (CD45.1) or SF (CD45.2) mice 3 wk after competitive 1:1 LSK transplantation into a UbiGFP mouse sleeping habitually. n = 6–7 mice per group. (G) Competitive 1:1 transplantation of LSKs from control (CD45.1) or SF (CD45.2) mice into UbiGFP recipient mice and quantification of CD45.1/2 chimerism among blood leukocytes and Ly6Chi monocytes up to 24 wk after transplantation. n = 8 mice per group. Mean ± SEM. *, P < 0.05, **, P < 0.01.
Figure S1.
Figure S1.
Influence of SF and RS on inflammation, LSK fitness, epigenetic rewiring, and adaptability. (A) Experimental design. (B) Growth factor levels in the BM fluid. (C) Cytokine, growth factor, and corticosterone levels in plasma of control and SF mice (n = 3–14 mice per group). (D) Body weight measurement of control and SF mice. (E) Experimental schematic of control mice and mice exposed to 16 wk of SF followed by 10 wk of RS. (F) Growth factor levels in the BM fluid. (G) Levels of plasma cytokines, growth factors, and corticosterone (n = 4 mice per group). (H) Body weight of control and SF+RS mice (n = 4 mice per group). (I) Engraftment of control GFPCD45.1 and SF GFPCD45.2 LSKs in the BM 24 h after transplantation. (J) Competitive 1:1 transplantation of LSKs from control (GFP+CD45.2) or SF (GFPCD45.2) mice into a CD45.1 recipient mice and quantification of GFP+ vs. GFP chimerism among blood Ly6Chi monocytes 18 wk after transplantation. n = 7 mice per group. (K) HAT and HDAC activity in BM lineagecKit+ cells. n = 4–5 mice per group. (L) Genomic distribution of accessibility peaks in LSK ATAC-seq data. (M) Analysis of hematopoietic growth factors and corticosterone levels in plasma of control and SF+RS mice after CLP (n = 4–8 mice per group). (N) Schematic of repeated SF episodes. Blood monocytosis during first or second SF exposure (n = 5 mice per group) and BM LSKs and proliferation 5 wk after initiating first or second SF exposure (n = 4 mice per group). Mean ± SEM. *, P < 0.05; ***, P < 0.001.
Figure 2.
Figure 2.
Sleep programs the LSK epigenome and confers adaptability. (A) Experimental schematic. C, control. (B) Distribution of DA (Log2FC > 2, P < 0.05, red circles) enhancer loci in control and SF LSKs. (C) Accessibility heatmap of DA enhancer loci between control and SF LSKs and corresponding accessibility in RS group, indicating preserved signature of loci not significantly different (Log2FC < 2, P < 0.05) between SF and RS. (D) Kyoto Encyclopedia of Genes and Genomes pathway analysis of the retained signature. (E) Heatmap of enhancer loci associated with genes important to lymphocyte differentiation, myeloid differentiation, and cyclin signaling. For ATAC-seq analysis, n = 2 mice per group, repeated twice, for a total of n = 4 per group. (F and G) Representative peak map (F) and quantitative PCR analysis (G) of Cdkn1b, Cdkn2b, Cdkal1, Klf9, and Klf3 expression in LSKs of control, SF, and SF+RS mice (n = 4–7 mice per group). (H) Experimental set up, CLP. (I) Blood bacteremia and Ly6Chi monocytes along with BM LSKs and proliferation 24 h after CLP. n = 4–8 mice per group. (J) Plasma cytokine levels. n = 8 mice per group. (K) Clinical score (n = 8 mice per group) and survival (n = 10 mice per group) after CLP. (L) Schematic of experimental design. (M and N) Blood monocyte numbers immediately prior to (M) and 24 h after (N) the CLP. n = 3–5 mice per group. (O) BM LSKs and proliferation 24 h after CLP. n = 5 mice per group. (P) Plasma cytokine levels and clinical score after CLP. n = 5 mice per group. Mean ± SEM. *, P < 0.05; **, P < 0.01; ***, P < 0.001; ****, P < 0.0001.
Figure S2.
Figure S2.
Analysis of mice treated with 4PBA. (A) Experimental design of 4PBA treatment during weeks 8 through 16 of control (C) sleep or SF. (B) Body weight, data of C and SF mice are as in Fig. S1 (n = 5–6 mice per group). (C) Proportion of BM LSKs (n = 3–5 mice per group). (D) Expression of Cdkn1b, Cdkn2b, Cdkal1, Klf3, and Klf9 genes in sorted LSKs; data from control and SF mice are as in Fig. 2 G (n = 4–7 mice per group).
Figure 3.
Figure 3.
Sleep-controlled immune adaptability is blunted by epigenetic modifiers. (A) Experimental schematic of 4PBA delivery. C, control. (B) Blood monocyte numbers and BM LSKs and proliferation 24 h after CLP. n = 4–5 mice per group. (C) Plasma cytokine levels 24 h after CLP. n = 4–5 mice per group. (D) Experimental schematic of iBet delivery. (E) Blood monocytosis 24 h after CLP. n = 4–5 mice per group. (F) BM LSKs and proliferation 24 h after CLP. n = 4–5 mice per group. (G) Plasma cytokine levels 24 h after CLP. n = 4–5 mice per group. Mean ± SEM. *, P < 0.05.
Figure 4.
Figure 4.
Sleep maintains hematopoietic diversity and limits neutral drift. (A) Experimental setup to generate tagged LSKs and transplantation into recipient mice. (B) Representative flow cytometry plots of leukocyte clusters in the blood. (C) Change in cluster frequency relative to baseline, mean cluster frequency, and variance of cluster frequencies of monocytes with four or more tags. (D) Change in cluster frequency relative to baseline, mean cluster frequency, and variance of cluster frequencies of neutrophils with four or more tags. (E) SDI among all 127 tagged monocyte clusters. (F) SDI among all 127 tagged neutrophil clusters. (G) Variance of LSK frequencies (P = 0.16) and SDI (P = 0.27) among 127 tagged LSK clusters after 18 wk of SF. (H) SDI of BM LSKs and blood monocytes at sacrifice. (I) Enumeration of BM LSKs in recipient mice. (J) LSK proliferation after 18 wk of SF. In all panels, n = 5 mice per group, except J where n = 6 mice per group. Mean ± SEM. *, P < 0.05; **, P < 0.01; ***, P < 0.001.
Figure S3.
Figure S3.
Cluster size and distribution and correlation of cluster frequencies in the BM and blood. (A and B) Distribution of tagged cluster frequency among LSKs (A) and blood leukocytes (B) at baseline. (C) Number of clusters detected at baseline among blood monocytes, neutrophils, T cells, and B cells. (D and E) Correlation of cluster frequency between BM LSKs and blood monocytes, and BM LSKs and blood neutrophils in each mouse at baseline (D; correlating transplanted LSKs with blood cells 6 wk after transplantation, prior to starting SF) and after 18 wk of SF or HS (E). n = 5 mice per group. M, mouse.
Figure S4.
Figure S4.
Influence of sleep on lymphocyte diversity. (A) Change in cluster frequency, mean cluster frequency, and variance of detectable B cell clusters with four or more tags. (B) SDI of B cells. (C) Change in cluster frequency, mean cluster frequency, and variance of detectable T cell clusters with four or more tags. (D) SDI of T cells. n = 5 mice per group. (E) Change in SDI from BM LSKs to blood neutrophils, B cells, and T cells. n = 5 mice per group. Mean ± SEM.
Figure 5.
Figure 5.
Human SR promotes monocytosis and shapes the HSPC epigenome. (A) Schematic of crossover SR study (n = 14). (B) TST of subjects during the HS phase and the SR phase measured weekly and averaged over the phase. (C) Enumeration of leukocyte populations in the blood during the morning (M) and evening (E) at the completion of each phase. (D) Enumeration of lineageCD34+ HSPCs. (E) HAT and HDAC activity in lineageCD34+ HPCs at the evening time point. (F) Histone H3 acetylation in lineageCD34+ HSPCs at the evening time point. (G) Mean fluorescence intensity (MFI) of CD115 and CD123 on HSPCs at the evening time point. Mean ± SEM. *, P < 0.05; ***, P < 0.001.
Figure S5.
Figure S5.
Human study. (A–C) Flow chart of the human study. Correlation of evening blood monocytes (B) and HSPCs (C) with energy intake and total adiposity at the completion of the HS and SR phases in human subject in which these parameters were available.

References

    1. Besedovsky, L., Lange T., and Haack M.. 2019. The sleep-immune crosstalk in health and disease. Physiol. Rev. 99:1325–1380. 10.1152/physrev.00010.2018 - DOI - PMC - PubMed
    1. Buisman, S.C., and de Haan G.. 2019. Epigenetic changes as a target in aging haematopoietic stem cells and age-related malignancies. Cells. 8:868. 10.3390/cells8080868 - DOI - PMC - PubMed
    1. Buysse, D.J., Reynolds C.F. 3rd, Monk T.H., Berman S.R., and Kupfer D.J.. 1989. The Pittsburgh sleep quality index: A new instrument for psychiatric practice and research. Psychiatr. Res. 28:193–213. 10.1016/0165-1781(89)90047-4 - DOI - PubMed
    1. Carroll, J.E., Irwin M.R., Levine M., Seeman T.E., Absher D., Assimes T., and Horvath S.. 2017. Epigenetic aging and immune senescence in women with insomnia symptoms: Findings from the women’s health initiative study. Biol. Psychiatr. 81:136–144. 10.1016/j.biopsych.2016.07.008 - DOI - PMC - PubMed
    1. Cedernaes, J., Schonke M., Westholm J.O., Mi J., Chibalin A., Voisin S., Osler M., Vogel H., Hornaeus K., Dickson S.L., et al. . 2018. Acute sleep loss results in tissue-specific alterations in genome-wide DNA methylation state and metabolic fuel utilization in humans. Sci. Adv. 4:eaar8590. 10.1126/sciadv.aar8590 - DOI - PMC - PubMed

Publication types