. 2022 Nov 1;33(13):ar128.
doi: 10.1091/mbc.E22-01-0018. Epub 2022 Sep 21.

Tau differentially regulates the transport of early endosomes and lysosomes

Affiliations

Tau differentially regulates the transport of early endosomes and lysosomes

Linda Balabanian et al. Mol Biol Cell. .

Abstract

Microtubule-associated proteins (MAPs) modulate the motility of kinesin and dynein along microtubules to control the transport of vesicles and organelles. The neuronal MAP tau inhibits kinesin-dependent transport. Phosphorylation of tau at Tyr-18 by fyn kinase results in weakened inhibition of kinesin-1. We examined the motility of early endosomes and lysosomes in cells expressing wild-type (WT) tau and phosphomimetic Y18E tau. We quantified the effects on motility as a function of the tau expression level. Lysosome motility is strongly inhibited by tau. Y18E tau preferentially inhibits lysosomes in the cell periphery, while centrally located lysosomes are less affected. Early endosomes are more sensitive to tau than lysosomes and are inhibited by both WT and Y18E tau. Our results show that different cargoes have disparate responses to tau, likely governed by the types of kinesin motors driving their transport. In support of this model, kinesin-1 and -3 are strongly inhibited by tau while kinesin-2 and dynein are less affected. In contrast to kinesin-1, we find that kinesin-3 is strongly inhibited by phosphorylated tau.


Figures
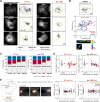
FIGURE 1:
FIGURE 1:
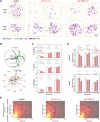
Tau biases lysosome motility toward the cell center. (A) Transient transfection results in variable tau-mApple expression levels. In cells expressing low levels (normalized tau intensity < 5), tau is enriched on microtubules and lysosomes are distributed throughout the cell, as seen on the maximum projections of lysosome movies. In cells expressing medium (5 ≤ normalized tau intensity < 10) and high (normalized tau intensity ≥ 10) levels of tau, tau is localized both along microtubules and in the cytosol. Lysosomes are more constrained to the perinuclear region in these cells. (B) The maximum projection image shows that lysosomes exhibit robust motility along microtubules in a control cell (with no tau expression). The net directionality of lysosome trajectories, tracked with TrackMate (Tinevez et al., 2017), was categorized as inward (toward cell center) or outward (toward the cell periphery) for motile lysosomes (with radius of gyration Rg ≥ 0.5 μm) or as stationary (Rg < 0.5 μm). (C) The fraction of stationary lysosomes increases with the level of tau expression (mean ± SEM). (D) The fractions of inward and outward trajectories are approximately equal for motile lysosomes in control cells. The ratio of the number of outward to inward indicates that WT and Y18E tau reduce the fraction of outward movement. Small symbols indicate single cells, large symbols indicate the means± 95% CIs (error bars) calculated using bootstrapping. (E) STICS was used to calculate velocity fields of the lysosome movement. θ is defined as the angle between the velocity (v) vector and the vector (r) pointing from the lysosome to the cell center (0, 0). An angle of 0-–60° indicates inward movement (toward cell center), 60–120° indicates perpendicular movement with respect to the cell center (depicted on the schematic), and 120–180° represents outward motion. Middle panels show the velocity vector field calculated using STICS. At right, the fractions of lysosome trajectories moving inward, outward, or perpendicular with respect to the cell center (for each cell) show that lysosomes move inward more often in cells expressing low levels of WT tau or Y18E tau, relative to control cells (small symbols: single cell; large symbols: mean± 95% CIs calculated using bootstrapping). Both the tracking-based directionality analysis (in C, D) and the STICS analysis (in E) demonstrate that lysosome motility is biased inward in response to tau. The plots for the data sets showing the cells over the whole range of tau expression levels (low, medium, high) are found in Supplemental Figure S1, D and E. (Control: n = 35 cells in C and D and 33 in E; WT tau: 71; Y18E tau: 83 cells.)
FIGURE 2:
FIGURE 2:
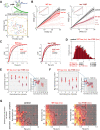
Phosphorylation of tau at Y18 relieves the inhibition of lysosome motility. (A) Lysosomes were imaged for 90 s and tracked using TrackMate in ImageJ (Tinevez et al., 2017). Lysosome trajectories from a control cell are shown here. (B) The MSDs of lysosomes in cells expressing low levels of tau Y18E are similar to that of control, whereas low levels of WT tau inhibit lysosome motility (mean ± SEM). For comparison, treatment with 10 µM nocadozole abolishes microtubule-dependent vesicle transport (gray line, n = 825 trajectories, nine cells). Log-log plots are shown as insets. (C) The cumulative distribution function (CDF) of the Rg of trajectories demonstrates a reduction of motility with higher tau levels, while at low levels, Y18E tau inhibition of lysosome motility is small (95% bootstrap CIs: control [0.73, 0.77], WT tau (low) [0.65, 0.70], Y18E tau (low) [0.73, 0.78] μm). (D) The slope of the MSD (α) indicates the proportion of stationary (α = 0), diffusive (α = 1), and processive (α = 2) motility. α values for cells expressing low levels of WT tau are reduced compared with control and tau Y18E (one-way ANOVA, Tukey’s test, p < 0.0001). Low levels of tau Y18E do not decrease lysosome processivity compared with control (p = 0.32). Ninety-five percent bootstrap CIs were also calculated (1000 iterations): control [1.05, 1.07], WT tau (low) [1.00, 1.02], Y18E tau (low) [1.06, 1.08]. (E) Sliding means of the α values were calculated as a function of tau intensity for trajectories in cells expressing low levels of WT tau or tau Y18E (left plot). Processivity (α) decreases progressively with tau intensity (right plot, mean± 95% CIs). (Control: n = 4882 trajectories; fyn: 2149; WT tau: 7910; Y18E tau: 9970; WT tau + fyn: 4644 trajectories.) (F) The Rg is an indicator of the mean distance traveled in a trajectory (see Materials and Methods), where a circle with radius Rg contains half of the spots of the trajectory. Lysosome displacement is inhibited less by phosphomimetic Y18E tau than WT tau (left plot). The displacement of lysosomes decreases with increasing tau intensity over the wider range of tau intensities (right plot, mean± 95% CIs). Control: n = 5408 trajectories, from n = 35 cells, over 20 experiments; WT tau: 9024 traj., 73 cells, over 14 experiments; Y18E tau: 11105 trajectories, 83 cells, over five experiments. This analysis uses the same data set as in Figure 1. The α and Rg of lysosome trajectories in cells treated with 10 μM nocodazole (mean and 95% CI at x = 0 and with a line) are shown on the right plot of E and F (n = 825 trajectories for α and 985 for Rg, nine cells).
FIGURE 3:
FIGURE 3:
Phosphomimetic tau Y18E inhibits the motility of lysosomes in the cell periphery. (A) Stationary (gray), short (magenta), and long (purple) trajectories (over 90 s movies) are distributed throughout the control cells. WT tau expression results in fewer long trajectories in all regions of the cell. In contrast, Y18E tau expression preferentially inhibits long trajectories in the cell periphery and often precludes lysosomes in this region (orange arrows). For comparison, representative images for cells with low and high average lysosome displacement (Rg) are shown. (B) Rho is defined as the mean distance of each trajectory from the cell center normalized to the average radius of the cell. Lysosomes were categorized as perinuclear (rho < 0.5), juxtanuclear (0.5 ≤ rho < 0.85), and peripheral (rho ≥ 0.85). (C) The percentage of inward-directed, outward-directed, and stationary lysosomes in different regions of the cell (mean ± SEM) indicates that the proportion of moving lysosomes in both the inward and outward directions is significantly reduced in the periphery of cells expressing Y18E tau. (D) The mean Rg (±SEM) of motile lysosomes (Rg > 0.5 μm) moving in the outward direction (top panels) or inward direction (bottom panels) is shown for each region of the cell (peripheral, juxtanuclear, or perinuclear localization). Juxtanuclear lysosomes maintain outward displacement similar to that of control in the presence of Y18E tau (green arrow), while peripheral lysosomes are inhibited by tau Y18E (orange arrow). p values from one-way ANOVA and Tukey’s test are shown on bar charts for low levels of WT tau or Y18E tau expression compared with control. (E) The distribution of lysosomes with respect to their Rg and localization. The distribution of moving lysosomes (Rg ≥ 0.5 μm) in Y18E tau–expressing cells is concentrated in the juxtanuclear region, while moving lysosomes are more evenly distributed across regions in control and WT tau–expressing cells. Lines show contours of the 2D distribution. (Control: n = 35 cells, WT tau [low]: 29 cells; Y18E tau [low]: 31 cells.) This analysis uses the same data set as in Figure 1.
FIGURE 4:
FIGURE 4:
WT and phosphomimetic tau strongly inhibit early endosome motility. (A) EGF-coated Qdots were used to image early endosomes (<1 h postinternalization) and tracked using TrackMate (Tinevez et al., 2017). Early endosomes exhibit short processive runs (control cell shown here). (B) MSD analysis shows that low levels of both WT tau and Y18E tau inhibit early endosome motility. In contrast to that of lysosomes, early endosome motility is more strongly inhibited by Y18E tau than WT tau. Log-log MSD plots are shown as insets. (C) The CDF of the Rg of early endosomes is shown for cells expressing low, medium, and high levels of WT tau and Y18E tau compared with control (95% bootstrap CI: control [0.46, 0.51], WT tau [low] [0.38, 0.41], Y18E tau [low] [0.40, 0.44] μm). (D) The distribution of MSD α values indicates that WT and Y18E tau reduce early endosome processivity (one-way ANOVA, Tukey’s test). Ninety-five percent bootstrap CI: control [0.84, 0.87], WT tau [low] [0.79, 0.83], Y18E tau [low] [0.73, 0.78]. (E) The MSD α (mean± 95% CIs) of early endosomes, normalized to the mean α of control trajectories, shows inhibition of early endosome processivity with low levels of WT tau and Y18E tau. Control: n = 1394 trajectories; fyn: 148; WT tau: 1653; Y18E tau: 1185; WT tau + fyn: 338 trajectories. (F) The Rg of early endosome trajectories similarly shows early endosome inhibition by both WT tau and Y18E tau. Thus, Y18 phosphorylation of tau does not relieve tau-mediated inhibition of early endosomes. (Control: n = 1946 trajectories, from 28 cells, over 19 experiments; WT tau: 2783 traj., 84 cells, over 15 experiments; Y18E tau: 2193 trajectories, 53 cells, over six experiments.) (G) The distribution of early endosomes is shown with respect to their localization from cell center and the Rg of trajectories. (Control: n = 522 trajectories, from 10 cells; WT tau [low]: 813 traj., 17 cells; Y18E tau: 596 trajectories, 15 cells.)
FIGURE 5:
FIGURE 5:
Kinesin-3 (KIF1A) is inhibited by WT and phosphomimetic Y18E tau in vitro. (A) Single-molecule motility assays (Supplemental Movie S3) on reconstituted microtubules indicate that KIF1A(1-393)-LZ-3xmCitrine processivity is strongly reduced in the presence of WT and Y18E tau, compared with control (no tau), as seen on kymographs. (B) WT tau and tau Y18E decrease KIF1A run lengths (one-way ANOVA, Tukey’s test, p < 0.0001), with Y18E tau causing a greater inhibition than WT tau (p < 0.0001). (C) KIF1A exhibits fewer interrun pauses (A) in the presence of WT tau, resulting in higher velocities (p = 0.0002). Y18E tau’s effect on KIF1A’s speed is not significant (p = 0.35). (Control: 144 trajectories, WT tau: 212, Y18E tau: 153 trajectories.) (D) Tau phosphorylation has differential effects on kinesin-1 (Stern et al., 2017) and kinesin-3 (as seen in A-C) on reconstituted microtubules (MTs) in vitro. Experimental conditions were similar (kinesin-1 and kinesin-2: 10 mM PIPES, 50 mM potassium acetate, 4 mM magnesium acetate; kinesin-3: 12 mm PIPES, 1 mm MgCl2; All: supplemented with 1 mM EGTA, 10 mM DTT, and an oxygen scavenger system (5.8 mg/ml glucose, 0.045 mg/ml catalase, and 0.067 mg/ml glucose oxidase). The inset show the run length mean values normalized to that of control. While tau-mediated inhibition of kinesin-1 is reduced by phosphomimetic Y18E tau, the inhibition on kinesin-3 by tau increases with Y18E tau, as depicted on the schematic.
FIGURE 6:
FIGURE 6:
KIF1A localizes to peripheral microtubules and excludes tau binding. (A) In cells transfected with KIF1A (KIF1A(1-393)-LZ-3xmCitrine), KIF1A dynamically localizes at microtubule tips (arrow 1), accumulates on microtubules in protrusions (arrow 2), and binds along the length of peripheral dynamic microtubules (arrow 3) (Supplemental Movie S4). (B) The dynamic localization of KIF1A is also observed in cells expressing low levels of tau (normalized WT tau intensity here is 1.2 for top panels, and normalized Y18E tau intensity is 1.7 for bottom panels), and microtubules exhibit polymerization dynamics. In the example here, KIF1A binds a growing microtubule tip, which probes close to the membrane (green arrow), and the KIF1A intensity increases at the microtubule tip. More KIF1A-bound microtubule ends grow and converge into that area with time. KIF1A intensity decreases gradually below (red arrow). KIF1A intensities also change in cytosolic areas around KIF1A-enriched dynamic microtubules (insets), while the membrane protrudes outward. (C) KIF1A localization in the periphery excludes WT and phosphomimetic tau microtubule binding. The merged images show little overlap between tau and KIF1A. Intensity values of KIF1A and tau normalized to their respective maximum-intensity value over the ROIs (white dotted line on merged images) show that tau intensity decreases as the KIF1A signal rises. Additionally, we observe that KIF1A is enriched on curved microtubules in cells coexpressing tau (insets). (KIF1A without tau: 6, WT tau + KIF1A: 40, Y18E tau + KIF1A: 45 observed cells.)
FIGURE 7:
FIGURE 7:
Model for the regulation of vesicle transport by tau Y18 phosphorylation. Kinesin-1–driven lysosome (lyso.) transport is inhibited by WT tau but is less sensitive to phosphomimetic tau. Kinesin-3–driven transport of early endosomes (EE) and peripheral lysosomes is inhibited by both WT and phosphomimetic tau. The Rg (normalized to control) of early endosomes shows a steeper decrease with increasing tau levels in cells, indicating that early endosome motility is more sensitive to tau inhibition compared with lysosomes.

References

    1. Balabanian L, Berger CL, Hendricks AG (2017). Acetylated microtubules are preferentially bundled leading to enhanced kinesin-1 motility. Biophys J 113, 1551–1560. - PMC - PubMed
    1. Balabanian L, Chaudhary AR, Hendricks AG (2018). Traffic control inside the cell: microtubule-based regulation of cargo transport. Biochem 40, 14–17.
    1. Ballatore C, Lee VM, Trojanowski JQ (2007). Tau-mediated neurodegeneration in Alzheimer’s disease and related disorders. Nat Rev Neurosci 8, 663–672. - PubMed
    1. Beaudet D, Berger CL, Hendricks AG (2022). Tau inhibits the long-range, dynein-mediated motility of early phagosomes. bioRxiv, 495679.
    1. Bentley M, Decker H, Luisi J, Banker G (2015). A novel assay reveals preferential binding between Rabs, kinesins, and specific endosomal subpopulations. J Cell Biol 208, 273–281. - PMC - PubMed

Publication types

LinkOut - more resources