. 2022 Sep 27;119(39):e2204233119.
doi: 10.1073/pnas.2204233119. Epub 2022 Sep 21.

Higher-order epistasis and phenotypic prediction

Affiliations

Higher-order epistasis and phenotypic prediction

Juannan Zhou et al. Proc Natl Acad Sci U S A. .

Abstract

Contemporary high-throughput mutagenesis experiments are providing an increasingly detailed view of the complex patterns of genetic interaction that occur between multiple mutations within a single protein or regulatory element. By simultaneously measuring the effects of thousands of combinations of mutations, these experiments have revealed that the genotype-phenotype relationship typically reflects not only genetic interactions between pairs of sites but also higher-order interactions among larger numbers of sites. However, modeling and understanding these higher-order interactions remains challenging. Here we present a method for reconstructing sequence-to-function mappings from partially observed data that can accommodate all orders of genetic interaction. The main idea is to make predictions for unobserved genotypes that match the type and extent of epistasis found in the observed data. This information on the type and extent of epistasis can be extracted by considering how phenotypic correlations change as a function of mutational distance, which is equivalent to estimating the fraction of phenotypic variance due to each order of genetic interaction (additive, pairwise, three-way, etc.). Using these estimated variance components, we then define an empirical Bayes prior that in expectation matches the observed pattern of epistasis and reconstruct the genotype-phenotype mapping by conducting Gaussian process regression under this prior. To demonstrate the power of this approach, we present an application to the antibody-binding domain GB1 and also provide a detailed exploration of a dataset consisting of high-throughput measurements for the splicing efficiency of human pre-mRNA [Formula: see text] splice sites, for which we also validate our model predictions via additional low-throughput experiments.

Keywords: Gaussian processes; genetic interaction; genotype–phenotype map; protein G; splicing.


Conflict of interest statement

The authors declare no competing interest.

Figures

Fig. 1.
Fig. 1.
(AD) Summary statistics of a simulated genotype–phenotype map on sequences of length l=8 with four alleles per site. (A) Decomposition of the genotype–phenotype map into the proportion of variance due to each order of genetic interaction. (B) Distance correlation function for mutational effects (γ1), (C) distance correlation function for local double-mutant epistatic coefficients (γ2), and (D) distance correlation function for local triple-mutant interactions (γ3). Formulas for calculating these statistics can be found in SI Appendix. (E) Distance correlation functions for interaction orders contributing to positive local correlations. (F) Distance correlation functions for interaction orders contributing to negative local correlations. (G) The distance correlation function of the simulated genotype–phenotype map is a weighted average of curves shown in E and F, with the weights given by the variance components (vk, k=1,,l, shown in parentheses in the legend and graphically in A), and each curve in G is shaded proportionally to its weight.
Fig. 2.
Fig. 2.
Simulated biallelic genotype–phenotype map with l=16. (A) Distance correlation of phenotypic values. (B) Variance components. (C) Distance correlation of the effects of single mutations. In AC, gray represents statistics of the prior distribution inferred using 80% of the data, and black represents the posterior statistics estimated based on 2,000 Hamiltonian Monte Carlo samples from the resulting posterior (these curves are closely overlapping). Error bars indicate 95% credible intervals. (DF) Comparison of model performance on the above simulated data, with error bars indicating 1 SD (n = 3 replicate simulations) and color legend given in F. Pairwise and three-way regression models were fit using elastic net regularization with regularization parameters chosen by 10-fold cross-validation (SI Appendix). The global epistasis model assumes the phenotype is a nonlinear transformation of an unobserved additive trait and was fit following ref . (D) Out-of-sample R2 for a range of training sample sizes. Dashed lines give results for noised training data where the R2 between the noised and true values is 0.8. (E) In-sample MSE as compared to the true values when trained on noised data (where we have scaled the phenotype so that the noise variance is 1). (F) Out-of-sample MSE as a function of Hamming distance from the wild-type (WT), for models trained on data generated using simulated mutagenesis (where we have scaled the phenotype so that the realized phenotypic variance is 1). The dashed line gives the expected mean square error for the trivial model that assigns the same phenotypic value to all genotypes.
Fig. 3.
Fig. 3.
Analyses of the GB1 combinatorial mutagenesis dataset (37). (A) Distance correlation of phenotypic values. (B) Variance components. (C) Distance correlation of the effects of single mutations. In AC, gray represents statistics of the prior distribution inferred from the full dataset consisting of 149,361 genotypes (93.6% of all possible sequences), and black represents the posterior statistics estimated based on 2,000 Hamiltonian Monte Carlo samples. Error bars indicate 95% credible intervals. (D) Comparison of model performance in terms of out-of-sample R2 for a range of training sample sizes calculated for five replicates. Additive models were fit using ordinary least squares. Pairwise and three-way regression models were fit using elastic net regularization with regularization parameters chosen by 10-fold cross-validation (SI Appendix). The global epistasis model assumes the binding score is a nonlinear transformation of an unobserved additive phenotype and was fit following ref. . Error bars represent 1 SD.
Fig. 4.
Fig. 4.
Analyses of the SMN1 5ss combinatorial mutagenesis dataset (31). (A) Distance correlation function of the splicing phenotype (PSI). (B) Variance components. (C) Distance correlation of single-mutant effects. Gray represents statistics of the prior distribution inferred from the full dataset consisting of 30,732 genotypes (93.8% of all possible splice sites), and black represents the posterior statistics estimated using 2,000 Hamiltonian Monte Carlo samples. Error bars indicate 95% credible intervals. (D) Out-of-sample R2 of the five models plotted against a range of training sample sizes. Error bars represent 1 SD calculated for five replicates for each sample size.
Fig. 5.
Fig. 5.
Manual validation of predicted PSI for 40 unmeasured SMN1 5ss. (A) Gel images of manually validated sequences. For each lane, the top band corresponds to mRNA product containing exon 7 (exon inclusion), while the bottom band correspond to mRNA product without exon 7 (exon skipping). PSI is indicated below each lane. Gel images are representative of triplicates. (B) Scatterplot showing measured PSI values versus PSI values predicted by the variance component regression. Horizontal error bars correspond to 1 SD of the posterior distribution. Vertical error bars correspond to 1 SD around the mean PSI estimated using three replicates in the manual validation. Since unlike the high-throughput measurements, the low-throughput PSIs are inherently restricted to the range 0 to 100, in this analysis we likewise cap the predicted PSIs to lie in this same range (see SI Appendix, Fig. S9 for the unrestricted predictions).
Fig. 6.
Fig. 6.
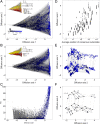
Visualization of the SMN1 splicing landscape reconstructed using empirical variance component regression. Genotypes are plotted using the dimensionality reduction technique from ref. (SI Appendix). (A) Visualization of all 32,768 splice sites using diffusion axes 1 and 2. Two splice sites are connected by an edge if they differ by a point mutation. (B) Visualization of all 32,768 splice sites using diffusion axes 1 and 3. (C) PSI versus diffusion axis 1. We see that diffusion axis 1 separates high PSI versus low PSI sequences. Genotypes are colored in AC according to the number of times they are observed as annotated splice sites in the human reference genome (hg38); see Inset in A for the color scale and a histogram of the numbers of counts. Gray dots represent sequences not present as annotated splice sites (65.9% of all sequences of the form NNN/GYNNNN). (D) Diffusion axis 2 versus the average physical position of the consensus nucleotides of the 818 splice sites with predicted PSI > 80%. (E) Visualization of the 818 splice sites with predicted PSI > 80% using diffusion axes 2 and 3. Genotypes colored as in AC. (F) Abstracted version of E. Splice sites are grouped by mutational states (consensus vs. mutated) at positions –1, –2, +3, +4, +5, and + 6. Each dot corresponds to a group of sequences with a prescribed pattern of consensus or mutated states on the six sites. Two groups are connected by an edge if they differ in mutational state at exactly one site. Gray lines represent differences at positions –1, +3, and +5. Black lines represent differences at positions –2, +4, and +6. Only groups containing splice sites with >80% PSI are shown, resulting in six (in)complete cubes with black edges, each representing a combination of mutational states on the three major sites –1, +3, and +5. The incompleteness of a cube indicates the absence of a combination of mutational states at positions –2, +4, and +6. Note that no cubes contain both –1 and +5 mutant states, indicating a major incompatibility between mutations at these two sites.

References

    1. Phillips P. C., Epistasis—The essential role of gene interactions in the structure and evolution of genetic systems. Nat. Rev. Genet. 9, 855–867 (2008). - PMC - PubMed
    1. Kondrashov D. A., Kondrashov F. A., Topological features of rugged fitness landscapes in sequence space. Trends Genet. 31, 24–33 (2015). - PubMed
    1. Domingo J., Baeza-Centurion P., Lehner B., The causes and consequences of genetic interactions (epistasis). Annu. Rev. Genomics Hum. Genet. 20, 433–460 (2019). - PubMed
    1. Fowler D. M., et al. , High-resolution mapping of protein sequence-function relationships. Nat. Methods 7, 741–746 (2010). - PMC - PubMed
    1. Starita L. M., et al. , Activity-enhancing mutations in an E3 ubiquitin ligase identified by high-throughput mutagenesis. Proc. Natl. Acad. Sci. U.S.A. 110, E1263–E1272 (2013). - PMC - PubMed

Publication types

LinkOut - more resources