. 2022 Sep 21;16(9):e0010791.
doi: 10.1371/journal.pntd.0010791. eCollection 2022 Sep.

Vivaxin genes encode highly immunogenic, non-variant antigens on the Trypanosoma vivax cell-surface

Affiliations

Vivaxin genes encode highly immunogenic, non-variant antigens on the Trypanosoma vivax cell-surface

Alessandra Romero-Ramirez et al. PLoS Negl Trop Dis. .

Abstract

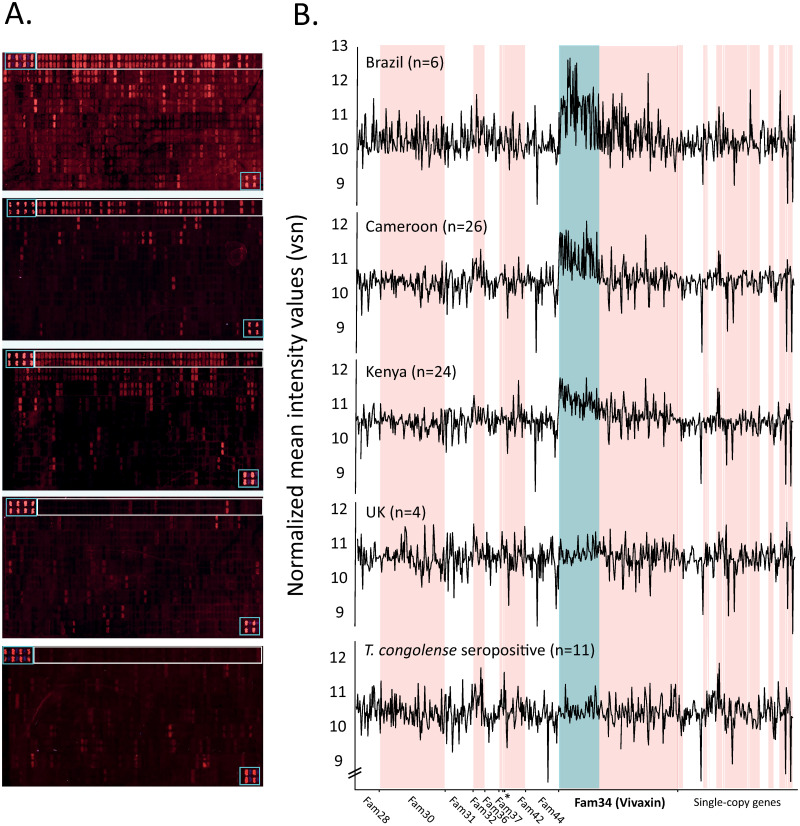
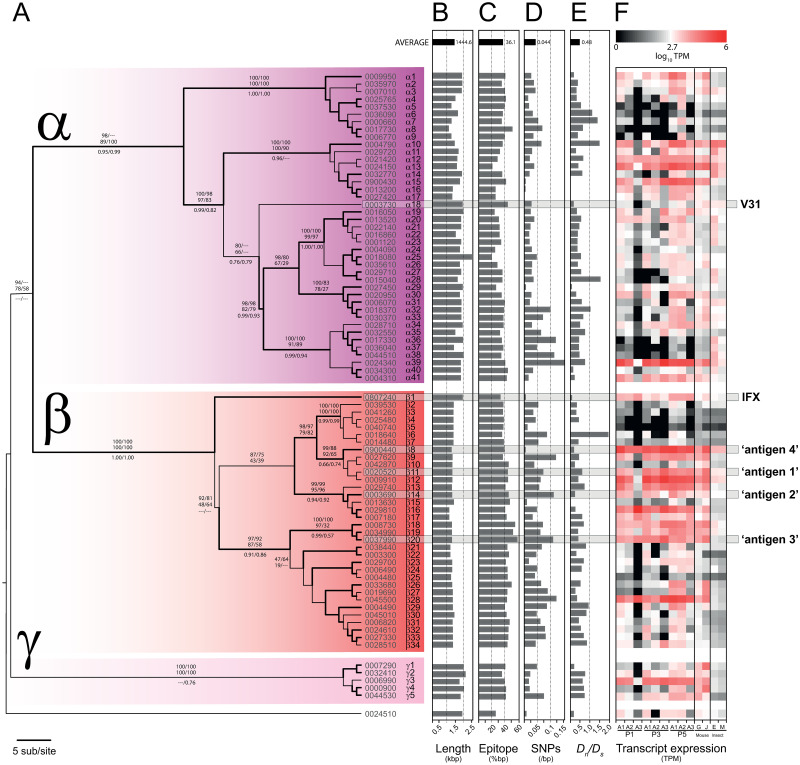
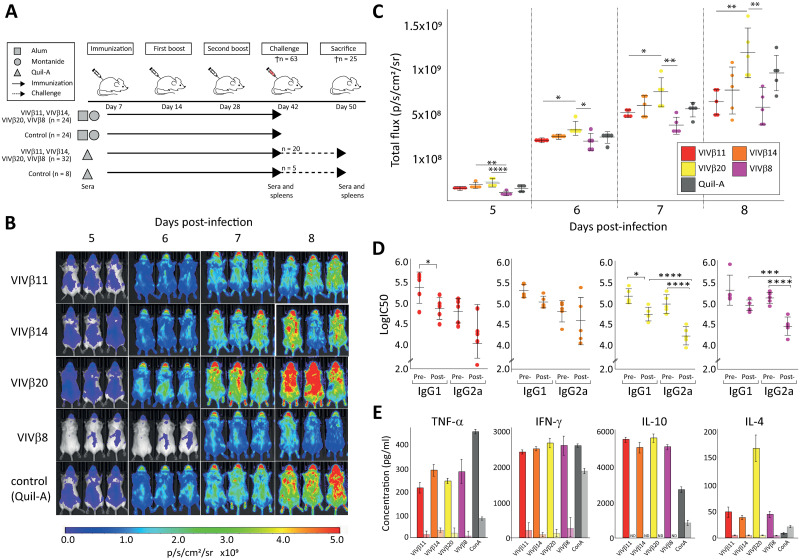
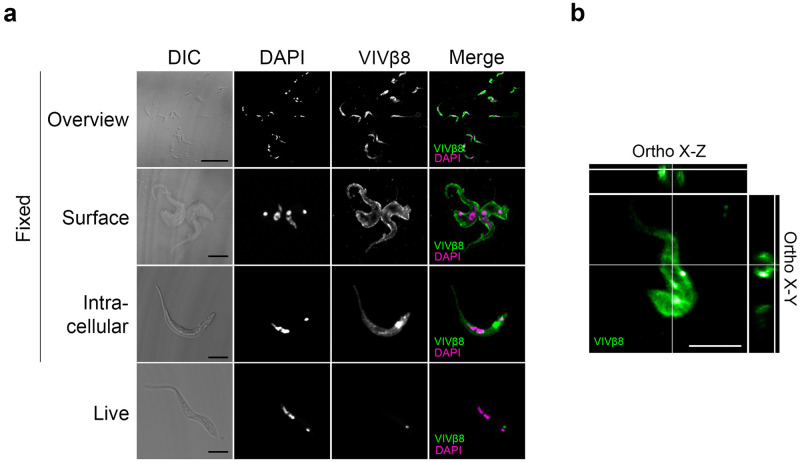
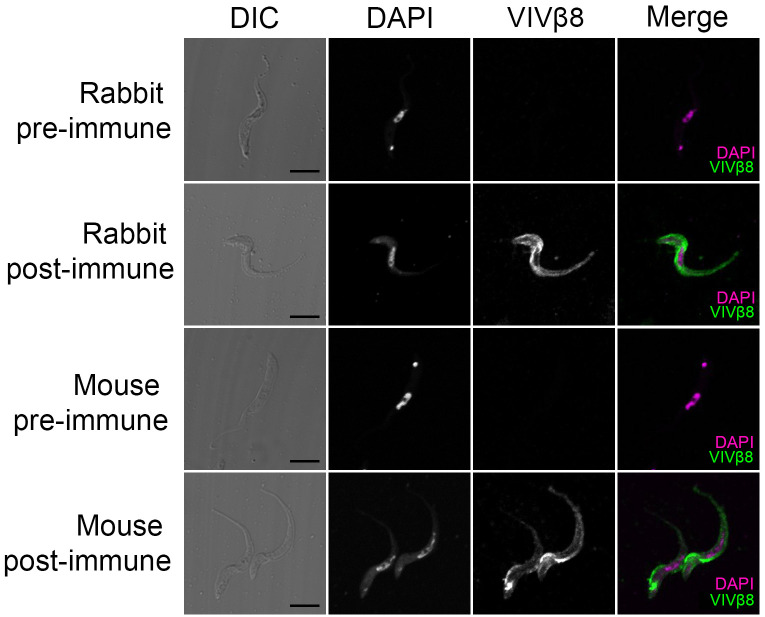
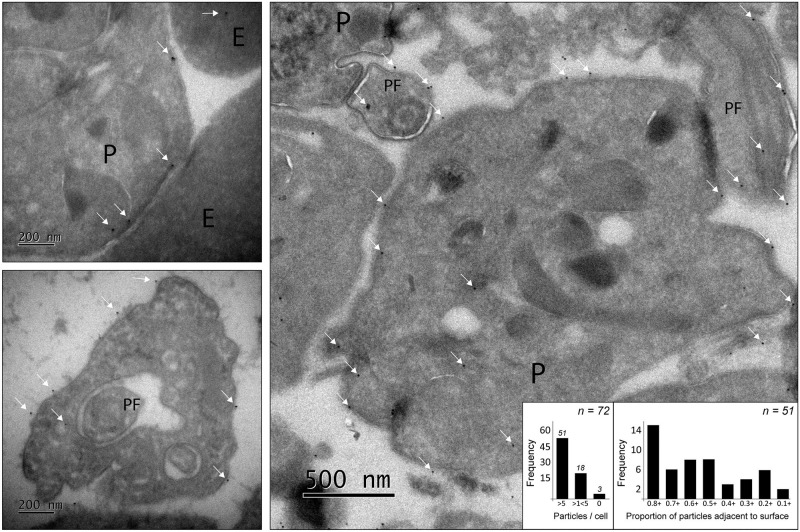
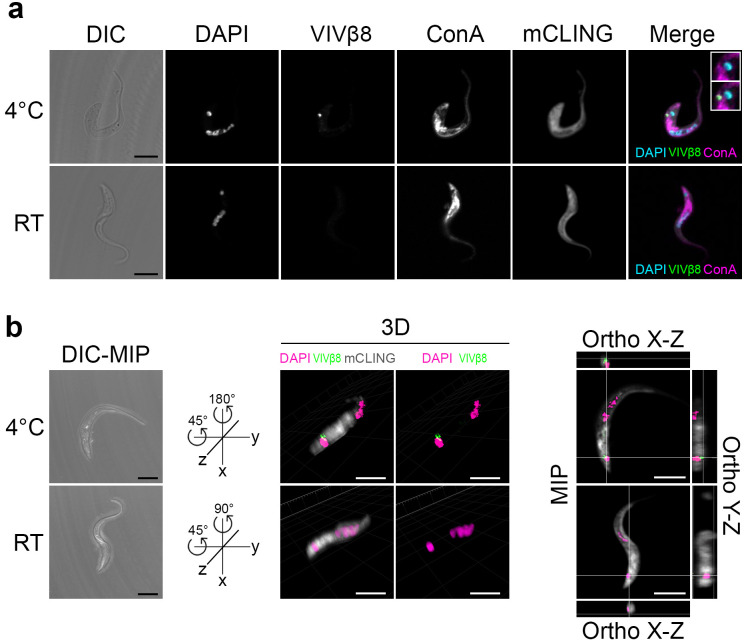
Trypanosoma vivax is a unicellular hemoparasite, and a principal cause of animal African trypanosomiasis (AAT), a vector-borne and potentially fatal livestock disease across sub-Saharan Africa. Previously, we identified diverse T. vivax-specific genes that were predicted to encode cell surface proteins. Here, we examine the immune responses of naturally and experimentally infected hosts to these unique parasite antigens, to identify immunogens that could become vaccine candidates. Immunoprofiling of host serum shows that one particular family (Fam34) elicits a consistent IgG antibody response. This gene family, which we now call Vivaxin, encodes at least 124 transmembrane glycoproteins that display quite distinct expression profiles and patterns of genetic variation. We focused on one gene (viv-β8) that encodes one particularly immunogenic vivaxin protein and which is highly expressed during infections but displays minimal polymorphism across the parasite population. Vaccination of mice with VIVβ8 adjuvanted with Quil-A elicits a strong, balanced immune response and delays parasite proliferation in some animals but, ultimately, it does not prevent disease. Although VIVβ8 is localized across the cell body and flagellar membrane, live immunostaining indicates that VIVβ8 is largely inaccessible to antibody in vivo. However, our phylogenetic analysis shows that vivaxin includes other antigens shown recently to induce immunity against T. vivax. Thus, the introduction of vivaxin represents an important advance in our understanding of the T. vivax cell surface. Besides being a source of proven and promising vaccine antigens, the gene family is clearly an important component of the parasite glycocalyx, with potential to influence host-parasite interactions.


Conflict of interest statement

I have read the journal’s policy and the authors of this manuscript have the following competing interests: DA and GJW are named inventors on patents relating to the use of IFX and V31 as animal trypanosomiasis vaccines.

Figures

Fig 1
Fig 1. Immuno-profiling of host serum with a Trypanosoma vivax-specific antigen array.
(A) Fluorescence observed after application of host sera to a customised array of 600 peptides representing 63 T. vivax-specific antigens. From top to bottom, the panels show responses to serum from three locations (Brazil, Cameroon and Kenya respectively), in addition to two negative controls (serum from UK cattle and from Cameroonian cattle that tested T. vivax-negative but T. congolense-positive). Control peptides are shown in boxes at top left and bottom right of each array. The top row of the array (boxed) contains peptides exclusively derived from vivaxin proteins. (B) Normalized intensity values of immuno-fluorescent responses in (A) are plotted for all array peptides, arranged by gene family. Individual gene families are indicated by alternating white and pink shading. Strongly-responding peptides belonging to vivaxin (Fam34) are indicated by blue shading.
Fig 2
Fig 2. Vivaxin gene family phylogeny and molecular evolution.
(A) Maximum likelihood phylogeny of vivaxin genes (n = 81) in the T. vivax Y486 reference genome estimated with a GTR + Γ substitution model (α = 3.677), and divided into three principal sub-families, labelled α, β and γ. The tree is rooted with a divergent sequence (TvY486_0024510) that approximates to the mid-point. Topological robustness is measured by the approximate log-likelihood ratio (aLRT), and indicated by branch thickness. Thick branches subtend nodes with aLRT values > 0.9. Robustness measures are given for major internal nodes: maximum likelihood bootstrap values (> 75) for nucleotide/protein alignments (upper, above branches), neighbour-joining bootstrap values (> 75) for nucleotide/protein alignments (lower, above branches), and Bayesian posterior probabilities (> 0.5) for nucleotide/protein alignments (below branch). At the left of each terminal node are the existing TritrypDB gene identifier (i.e. TvY486_XXXXXXX) and new gene names; the positions of IFX and V31 antigens [23] and four expressed antigens in this study (1–4) are highlighted within horizontal grey boxes. (B) Gene length mapped to tree topology. (C) Total length of predicted human B-cell epitopes as a proportion of gene length, as inferred by Bepipred linear prediction 2.0 [50]. (D) Single nucleotide polymorphisms (SNP) across a panel of 25 T. vivax strain genomes (as described previously in [48]), as a proportion of gene length. (E) Ratio of non-synonymous to synonymous substitutions (Dn/Ds) inferred from published SNP data [48]. (F) Heat maps showing vivaxin gene expression profiles from published T. vivax transcriptomes [25,48]. The first nine columns show relative transcript abundance during an experimental infection in goats. Three peaks in parasitaemia are shown (first, third and fifth respectively; see [48]), with three replicates for each (A1-A3). Columns 10 and 11 show relative transcript abundance in bloodstream-stage infections in mice using different T. vivax strains, LIEM-176 [49] and IL1392 [25], respectively. Columns 12 and 13 show transcript abundance in batch transcriptomes of in vitro cultured T. vivax insect-stages, i.e. epimastigotes (E) and metacyclic-forms (M) respectively [25].
Fig 3
Fig 3. Vaccination and T. vivax challenge in a murine model.
(A) Schedule of vaccine immunization and challenge. BALB/c mice received prime immunization followed by two boosts of a protein-in-adjuvant formulation. Each recombinant protein was combined with one of Alum, Montanide ISA 201 VG or Quil-A adjuvants, while the control groups received adjuvants only. Animals were euthanized at day 42 (n = 63) to assess the response to immunization, except for five mice from each vaccinated and control Quil-A-based groups (n = 25) which were challenged with bloodstream-form T. vivax for a further eight days. (B) Vaccine protection against challenge with bioluminescent T. vivax in BALB/c mice. In vivo imaging of immunized mice with each of four vivaxin antigens co-administrated with Quil-A (n = 5/group). Daily bioluminescent images were collected from 5-8dpi. (C) Parasite burden, measured as luminescent values (total flux in photons per second) of luciferase-expressing T. vivax in challenged mice at 8 dpi. (D) Humoral response before and after challenge with T. vivax in mice vaccinated with four antigens co-administered with Quil-A (n = 8). Comparison of isotype IgG in fully immunized mice at day 42 with challenged mice at 8 dpi. Serum concentration determined by ELISA. (E) Cytokine production by splenocytes stimulated in vitro after removal from fully immunized mice at day 42 (left-hand bar, full colour), compared with challenged mice at 8 dpi (right-hand bar, faded). Note that reductions in cytokine concentration post-immunization and post-challenge were significant (P < 0.001) for all antigens but labels are omitted for clarity. Data normality was confirmed with a Shapiro-Wilk test and statistical significance was assessed using a two-tailed ANOVA in R studio. Significance is indicated by asterisks: * (P < 0.05), ** (P < 0.01), *** (P < 0.001), **** (P < 0.0001).
Fig 4
Fig 4. Cellular localization of VIVβ8 protein.
(A) Representative images of immunofluorescence assays on T. vivax bloodstream forms fixed in 4% formaldehyde or on live cells. Differential increased contrast (DIC); DAPI DNA counterstain; VIVβ8 (secondary antibody AF555-conjugated) and merged channels. Formaldehyde-fixed cells exhibit three main staining patterns; cell surface (Surface), increasing gradient from anterior to posterior end (Gradient), and intracellular mainly (Intracellular). Scale bars; 5 μm. (B) 3D z-stack reconstructions of T. vivax cells and corresponding orthogonal (X-Z and X-Y) views from the stacks. Orthogonal views note surface localization (circular edges) of VIVβ8 in T. vivax.
Fig 5
Fig 5. VIVβ8 immunostaining controls.
Representative images of T. vivax bloodstream-form, formaldehyde-fixed cells either probed with pre-immune (pre) or post-immunization (post) antisera from either rabbit or mouse hosts vaccinated with VIVβ8. Only post-immunisation antisera display antibody binding. Scale bars; 5 μm.
Fig 6
Fig 6. Localisation of VIVβ8 by immunolabelled transmission electron microscopy.
Parasites (P) and erythrocytes (E) derived from murine infections were labelled with anti-VIVβ8 polyclonal antibodies. VIVβ8 was localised to the whole parasite cell surface (top and bottom left), and to the parasite flagellum (PF). Anti-VIVβ8-coated gold particles are indicated by white arrows. The right-hand image shows the predominant localisation of VIVβ8 to the surface, although intracellular positions are observed. The graph (inset) shows the proportion of labelled cells and a frequency distribution of the proportion of anti-VIVβ8-coated gold particles found adjacent to the parasite cell membrane of labelled cells.
Fig 7
Fig 7. Live immunostaining of VIVβ8 antigen in native cells.
(A) Live T. vivax bloodstream forms were immunostained either at 4°C to halt the secretory pathway or at room temperature (RT) to preserve it active. DIC; DAPI; VIVβ8 (secondary AF555-conjugated antibody); concanavalin A (ConA) FITC-conjugated lectin ER counterstain; mCLING unspecific staining and merged channels. Close-ups in merge channel show the flagellar pocket (end of ER, next to kDNA) without (top) or with (bottom) VIVβ8 green signal. Scale bars; 5 μm. (B) 3D localization of VIVβ8 in live cells. Representative cells immunostained at 4°C or RT were 3D reconstructed in DIC-maximum intensity projection (DIC-MIP, left) and rotated to equivalent positions in the space to display VIVβ8 next to the kDNA only in 4°C cells (middle). MIP fluorescence projections (right) and orthogonal views. Scale bars; 5 μm.

Similar articles

Cited by

References

    1. Gardiner PR. Recent studies of the biology of Trypanosoma vivax. Adv Parasitol. 1989; 28:229–317. - PubMed
    1. Osório ALAR, Madruga CR, Desquesnes M, Soares CO, Ribeiro LRR, da Costa SCG. Trypanosoma (Duttonella) vivax: Its biology, epidemiology, pathogenesis, and introduction in the New World—A review. Mem. Inst. Oswaldo Cruz. 2008; 103:1–13. - PubMed
    1. Batista JS, Rodrigues CM, García HA, Bezerra FS, Olinda RG, Teixeira MM, Soto-Blanco B. Association of Trypanosoma vivax in extracellular sites with central nervous system lesions and changes in cerebrospinal fluid in experimentally infected goats. Vet Res. 2011; 42(1):63. - PMC - PubMed
    1. Batista JS, Rodrigues CM, Olinda RG, Silva TM, Vale RG, Câmara AC, et al.. Highly debilitating natural Trypanosoma vivax infections in Brazilian calves: epidemiology, pathology, and probable transplacental transmission. Parasitol Res. 2012; 110(1):73–80. - PubMed
    1. D’Archivio S, Cosson A, Medina M, Lang T, Minoprio P, Goyard S. Non-invasive in vivo study of the Trypanosoma vivax infectious process consolidates the brain commitment in late infections. PLoS Negl Trop Dis. 2013; 7(1):e1976. - PMC - PubMed

Publication types