. 2022 Sep 23;8(38):eabn4704.
doi: 10.1126/sciadv.abn4704. Epub 2022 Sep 21.

Semirational bioengineering of AAV vectors with increased potency and specificity for systemic gene therapy of muscle disorders

Affiliations

Semirational bioengineering of AAV vectors with increased potency and specificity for systemic gene therapy of muscle disorders

Jihad El Andari et al. Sci Adv. .

Abstract

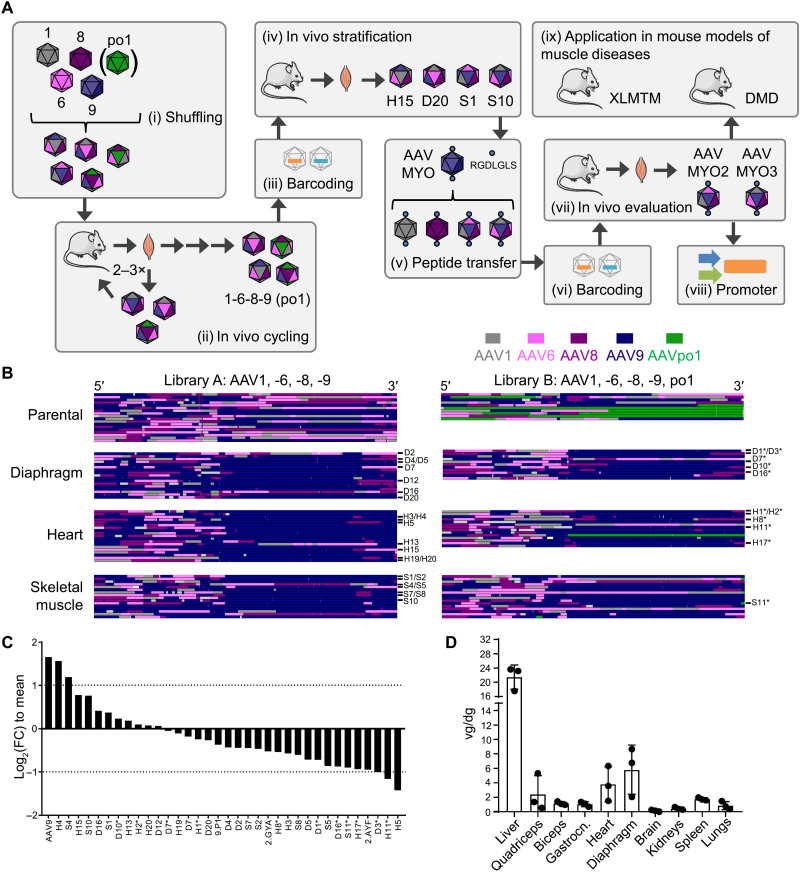
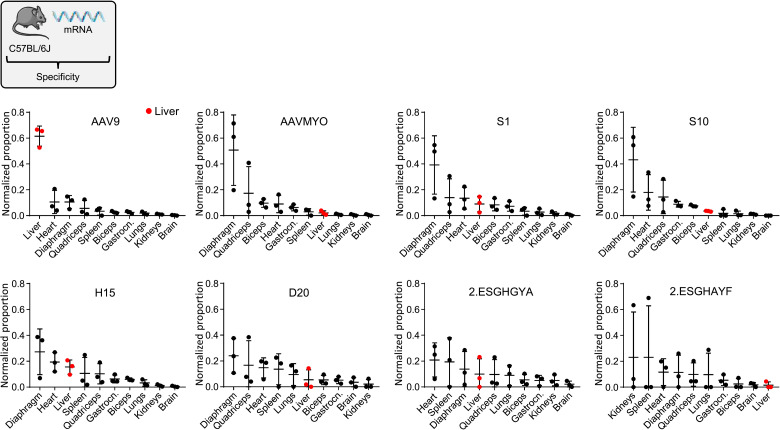
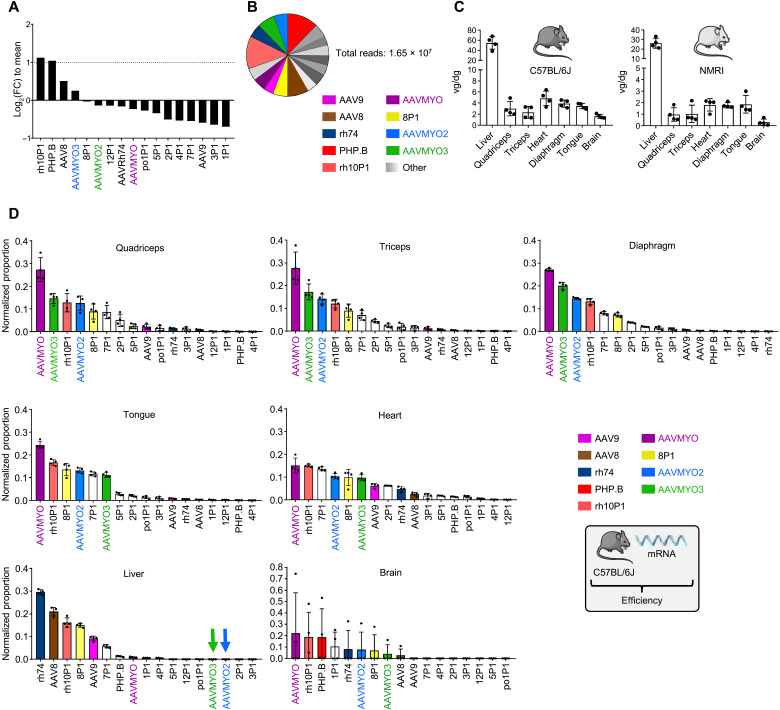
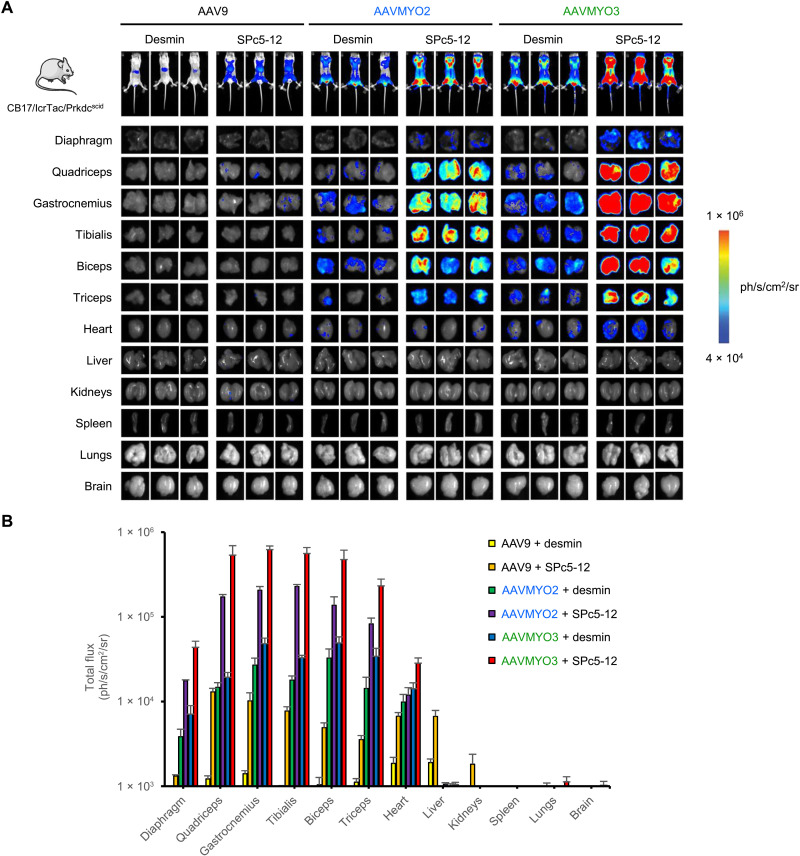
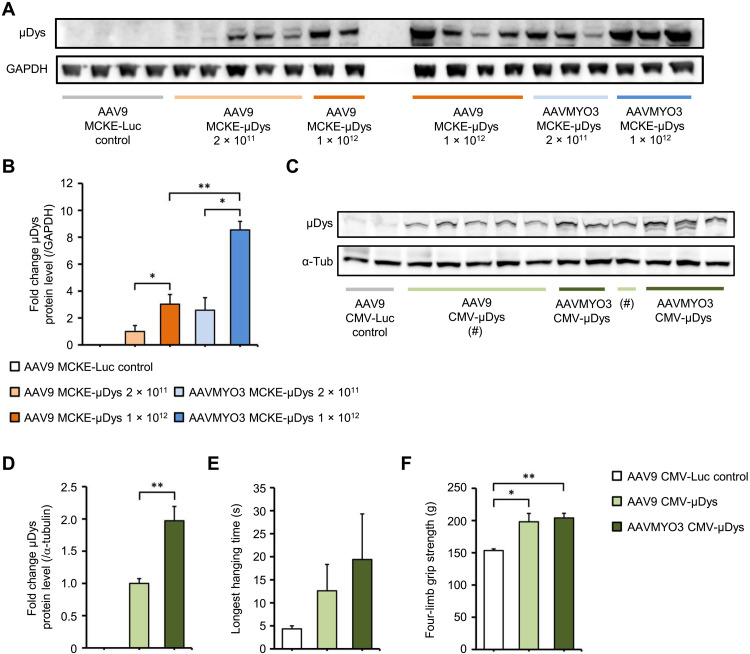
Bioengineering of viral vectors for therapeutic gene delivery is a pivotal strategy to reduce doses, facilitate manufacturing, and improve efficacy and patient safety. Here, we engineered myotropic adeno-associated viral (AAV) vectors via a semirational, combinatorial approach that merges AAV capsid and peptide library screens. We first identified shuffled AAVs with increased specificity in the murine skeletal muscle, diaphragm, and heart, concurrent with liver detargeting. Next, we boosted muscle specificity by displaying a myotropic peptide on the capsid surface. In a mouse model of X-linked myotubular myopathy, the best vectors-AAVMYO2 and AAVMYO3-prolonged survival, corrected growth, restored strength, and ameliorated muscle fiber size and centronucleation. In a mouse model of Duchenne muscular dystrophy, our lead capsid induced robust microdystrophin expression and improved muscle function. Our pipeline is compatible with complementary AAV genome bioengineering strategies, as demonstrated here with two promoters, and could benefit many clinical applications beyond muscle gene therapy.


Figures

Fig. 1.
Fig. 1.. Overview of AAV library generation, in vivo evolution, and validation.
(A) Workflow comprising nine consecutive steps: (i) creation and production of two AAV capsid libraries by DNA family shuffling of multiple cap genes; (ii) in vivo selection/cycling via systemic injection into mice, followed by vector genome amplification from on-target tissues (diaphragm, heart, and skeletal muscle), subcloning and production of secondary libraries for repeated injection; (iii and iv) barcoding and stratification in mice; (v) rational P1 peptide transfer into selected shuffled capsids; (vi) barcoding of the ensuing bioengineered capsids plus benchmarks; (vii) validation of the muscle specificity in WT mice; (viii) combination of the two best capsids (AAVMYO2 and AAVMYO3) with two myotropic promoters; and (ix) application in two mouse models of human muscle diseases. (B) Sequence analysis of shuffled AAV libraries. Top: Parental libraries composed of AAV1, -6, -8, and -9 (library A) or AAV1, -6, -8, -9, and po.1 (library B). Shown are representative examples. Each row depicts one clone. (C) Composition of the secondary barcoded library. Shown are log2(FC) values relative to the mean per barcoded AAV variant in the library. The two dotted lines mark a twofold change. Negative values indicate underrepresentation of a variant, and positive values imply overrepresentation. FC, fold change. (D) Viral DNA distribution of the library in multiple organs. Shown are vector genomes (individual mice and averages) per diploid genome (vg/dg; means + SD) from three C57BL/6J mice (each mouse is one dot, injected with 1 × 10¹² vg, euthanized 1 week later). Vector genomes (EYFP probe) were normalized to RPP30 as a housekeeper. Gastrocn., gastrocnemius; Quadriceps, quadriceps femoris.
Fig. 2.
Fig. 2.. Transcriptional specificity of selected AAVs in multiple tissues.
Shown is the transcriptional specificity (Tαβ) of 12 capsids as normalized proportion per cell (dg) in 10 tissues. Depicted are mean cDNA values with SD from three C57BL/6J mice. Liver samples are highlighted in red.
Fig. 3.
Fig. 3.. Biodistribution of P1-displaying AAV variants.
(A) Composition of the barcoded library. Shown are log2(FC) values relative to the mean for each barcoded AAV variant in the library, with the dotted line marking a twofold change. Negative values indicate underrepresentation of the respective variant, and positive values imply overrepresentation. (B) Percentages of each barcoded AAV in the parental library based on unique recovered reads compared to the total reads (indicated next to the chart). (C) Viral DNA distribution of the library in seven organs. Shown are vg/dg (individual mice and averages) (means + SD) from four C57BL/6J or NMRI mice, respectively (each mouse is one dot). Detected vector genomes (eyfp probe) were normalized to RPP30 as a housekeeper. Mice were injected with 2.5 × 10¹² vg and euthanized for tissue harvest 3 weeks later. (D) All 17 capsids were ranked by normalized transcriptional efficiency (Vαβ) in the shown seven tissues. Bars are mean values with SD from four C57BL/6J mice (each mouse is one dot). AAV variants of particular interest in this work are highlighted by colors.
Fig. 4.
Fig. 4.. Biodistribution of AAVMYO2 and AAVMYO3.
CB17/IcrTac/Prkdcscid mice were intravenously injected with 1 × 10¹¹ vg per mouse and analyzed 2 to 3 weeks later. (A) In vivo whole-body bioluminescence imaging of mice injected intravenously with the shown vectors, depicted on a color scale from 4 × 10⁴ (blue) photons/s/cm2/sr to 1 × 10⁶ (red) photons/s/cm2/sr at week 2 after injection. Photon emission was measured dynamically during 7 min in a supine position. Ex vivo bioluminescence imaging of individual organs harvested at week 3 after injection is represented on a color scale with luciferase intensities ranging from 2.5 × 10⁴ (blue) photons/s/cm2/sr to 3.5 × 10⁵ (red) photons/s/cm2/sr. Bioluminescence signals were quantified for 5 min. (B) A hand-drawn region of interest was used for every individual tissue. Luciferase expression from the individual muscles was measured as total flux, expressed in photons/s/cm2/sr (means ± SEM; n = 3).
Fig. 5.
Fig. 5.. AAVS10 and AAVMYO3 variant models.
Ribbon diagram of (A) AAVS10 and (B) AAVMYO3 VP3 monomer. The eight-stranded β barrel motif βBIDG-βCHEF, N and C termini, αA helix, variable region VIII (VRVIII), and the capsid interior and exterior are as labeled. The position of the icosahedral two-, three-, and fivefold axes are shown as a black filled oval, triangle, and pentagon, respectively. Specific amino acids with the sequence and location equivalent to AAV9 are colored violet, and those similar to AAV1, AAV6, and AAV8 are colored gray, teal, and purple spheres, respectively. In addition, the peptide insertion P1 at VR VIII from G585-L594 is colored red in (B). (C and D) Surface representation of the (C) AAVS10 and (D) AAVMYO3 T = 1 icosahedral capsid, using the color scheme of (A) and (B). The surface features show the characteristic twofold depression at the twofold axes, threefold protrusions surrounding the threefold axes, the two-/fivefold wall, and the fivefold pore forming the fivefold axes. The twofold, threefold, and fivefold axes are labeled as white filled oval, triangle, and pentagon, respectively. The figures were generated using the program PyMOL.
Fig. 6.
Fig. 6.. Systemic gene therapy with AAVMYO2 or AAVMYO3 expressing myotubularin improves life span, body growth, and strength in Mtm1-KO mice at lower doses than AAV8.
(A) Survival rate and (B) body weight of WT (n = 19) and KO mice (n = 16) injected 3 weeks after birth with PBS or AAV8 and AAVMYO2 or AAVMYO3 vectors at 1.0 × 10¹⁴ vg/kg (HD, n = 10, 8, or 8, respectively), 2.0 × 10¹³ vg/kg (MD, n = 17, 9, or 11, respectively), or 4.0 × 10¹² vg/kg (LD, n = 9). (C) Escape test measurements in WT (n = 5 at 6 weeks, n = 8 at 15 weeks) and KO mice (n = 6 at 6 weeks) injected with PBS or AAV8, AAVMYO2, or AAVMYO3 at HD (n = 7, 8, or 8, respectively), MD (n = 8), or LD (n = 8) at 15 weeks of age. (D) Specific tetanic force of TA muscles from WT or treated KO mice at 15 weeks of age (n = 8, except for KO + AAV8_HD and KO + AAVMYO3_HD n = 7). Data are means ± SEM. Statistical analyses were performed by using unpaired t test at 6 weeks ($$$P < 0.001) or one-way analysis of variance (ANOVA) followed by Dunnett’s multiple comparison posttest, at 15 weeks; *P < 0.05; **P < 0.01; ***P < 0.001 versus WT + PBS.
Fig. 7.
Fig. 7.. AAVMYO2 or AAVMYO3 corrects skeletal muscle fiber hypotrophy and internal architecture of mutant mice at a lower dose than AAV8.
(A) Cross sections from TA stained with H&E from WT (at 6 and 15 weeks) and KO mice injected with PBS (at 6 weeks) or AAV8, AAVMYO2, or AAVMYO3 at 1.0 × 10¹⁴ (HD), 2.0 × 10¹³ (MD), or 4.0 × 10¹² vg/kg (LD) at 15 weeks of age. Scale bars, 50 μm. (B) TA myofiber diameter frequency distribution (n = 5 per group). (C) Muscle fiber mean diameter from TA (n = 5 per group). (D) Percentage of myofibers with internal nuclei in TA (n = 5 per group at 6 weeks and n = 8 per group at 15 weeks, except for KO + AAV8_HD n = 7). Data are means ± SEM. Statistical analyses were performed by using unpaired t test at 6 weeks ($$$P < 0.001) or one-way ANOVA followed by Dunnett’s multiple comparison posttest: *P < 0.05; **P < 0.01; ***P < 0.001 versus WT + PBS.
Fig. 8.
Fig. 8.. Biodistribution and transgene expression of AAVMYO2- or AAVMYO3-MTM1 vectors compared to AAV8 in XLMTM mice.
(A) Vector copy number (vg/diploid genome) of AAV8, AAVMYO2, or AAVMYO3 at 1.0 × 10¹⁴ (HD), 2.0 × 10¹³ (MD), or 4.0 × 10¹² vg/kg (LD) in various muscles and organs of Mtm1-KO mice 3 months after injection (n = 8 per group, except for KO + AAV8_HD n = 7). (B) MTM1 mRNA levels normalized by KO + AAV8_MD values in muscles and organs of Mtm1-KO mice at 15 weeks of age (n = 8 per group, except for KO + AAV8_HD n = 7). (C) Myotubularin protein quantification by immunoblot in TA, biceps, diaphragm, and heart (n = 4 per group). (D) Immunoblot illustrating myotubularin (green) and glyceraldehyde-3-phosphate dehydrogenase (GAPDH) as control in red in diaphragm of KO mice 3 months after vector injection (AAV8_HD, AAV8_MD, AAVMYO2_MD, and AAVMYO3_MD). Data are presented as means ± SEM. Statistical analyses were performed for each dose by using one-way ANOVA followed by Dunnett’s multiple comparison posttest: *P < 0.05; **P < 0.01; ***P < 0.001 versus KO + AAV8_HD or AAV8_MD depending on the group.
Fig. 9.
Fig. 9.. AAV9- and AAVMYO3-mediated overexpression of μDys in Mdx mice.
(A) Immunoblot with densitometry analysis (B) showing μDys expression in quadriceps femoris muscles of mdx mice 12 weeks after intravenous injection of 2 × 10¹¹ or 1 × 10¹² vg of a control vector (AAV9 Luc–expressing luciferase), or of AAV9 or AAVMYO3 encoding μDys under control of the muscle creatine kinase (MCKE) promoter (n = 3 to 5 per group; loading control GAPDH). (C) Immunoblot with densitometry analysis (D) showing μDys expression in quadriceps femoris muscles of mdx mice 23 weeks after intravenous injection of 2 × 10¹² vg of a control vector (AAV9 Luc–expressing luciferase), or of AAV9 or AAVMYO3 encoding μDys under control of the CMV promoter (n = 5 to 6 per group; loading control α-tubulin). These mice were subjected to a four-limb hanging test (E) and four-limb grip strength testing (F) to evaluate muscle performance. Data are presented as means ± SEM. Statistical significance was calculated by unpaired two-tailed Student’s t test or one-way ANOVA. *P < 0.05; **P < 0.01.

References

    1. Grimm D., Zolotukhin S., E pluribus unum: 50 years of research, millions of viruses, and one goal–tailored acceleration of AAV evolution. Mol. Ther. 23, 1819–1831 (2015). - PMC - PubMed
    1. Wang D., Tai P. W. L., Gao G., Adeno-associated virus vector as a platform for gene therapy delivery. Nat. Rev. Drug Discov. 18, 358–378 (2019). - PMC - PubMed
    1. Havlik L. P., Simon K. E., Smith J. K., Klinc K. A., Tse L. V., Oh D. K., Fanous M. M., Meganck R. M., Mietzsch M., Kleinschmidt J., Agbandje-McKenna M., Asokan A., Coevolution of adeno-associated virus capsid antigenicity and tropism through a structure-guided approach. J. Virol. 94, e00976-20 (2020). - PMC - PubMed
    1. Tse L. V., Klinc K. A., Madigan V. J., Castellanos Rivera R. M., Wells L. F., Havlik L. P., Smith J. K., Agbandje-McKenna M., Asokan A., Structure-guided evolution of antigenically distinct adeno-associated virus variants for immune evasion. Proc. Natl. Acad. Sci. U.S.A. 114, E4812–E4821 (2017). - PMC - PubMed
    1. Adachi K., Enoki T., Kawano Y., Veraz M., Nakai H., Drawing a high-resolution functional map of adeno-associated virus capsid by massively parallel sequencing. Nat. Commun. 5, 3075 (2014). - PMC - PubMed