. 2022 Sep 23;8(38):eabo0987.
doi: 10.1126/sciadv.abo0987. Epub 2022 Sep 21.

PKM2 promotes pulmonary fibrosis by stabilizing TGF-β1 receptor I and enhancing TGF-β1 signaling

Affiliations

PKM2 promotes pulmonary fibrosis by stabilizing TGF-β1 receptor I and enhancing TGF-β1 signaling

Shaoyan Gao et al. Sci Adv. .

Abstract

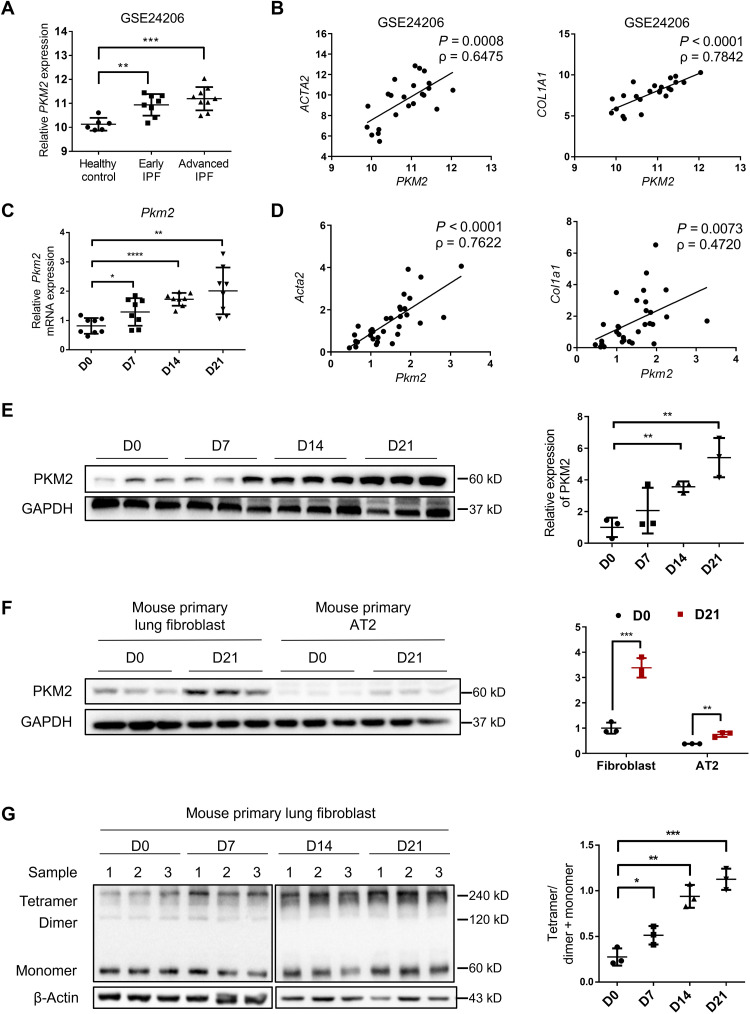
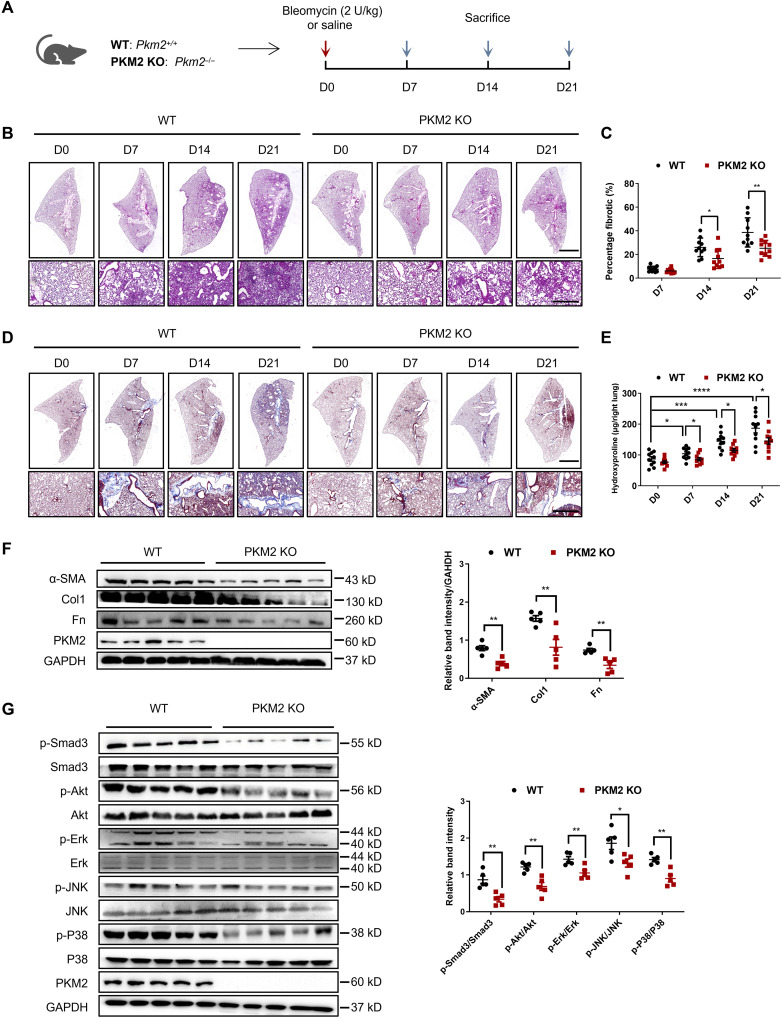
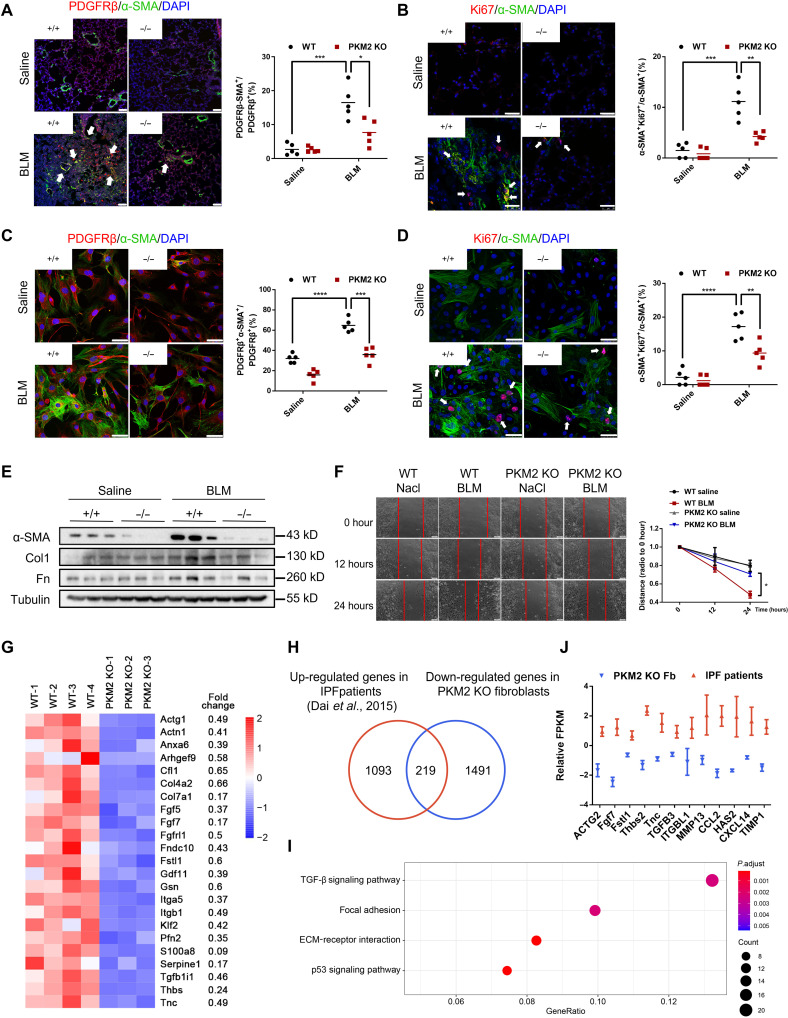
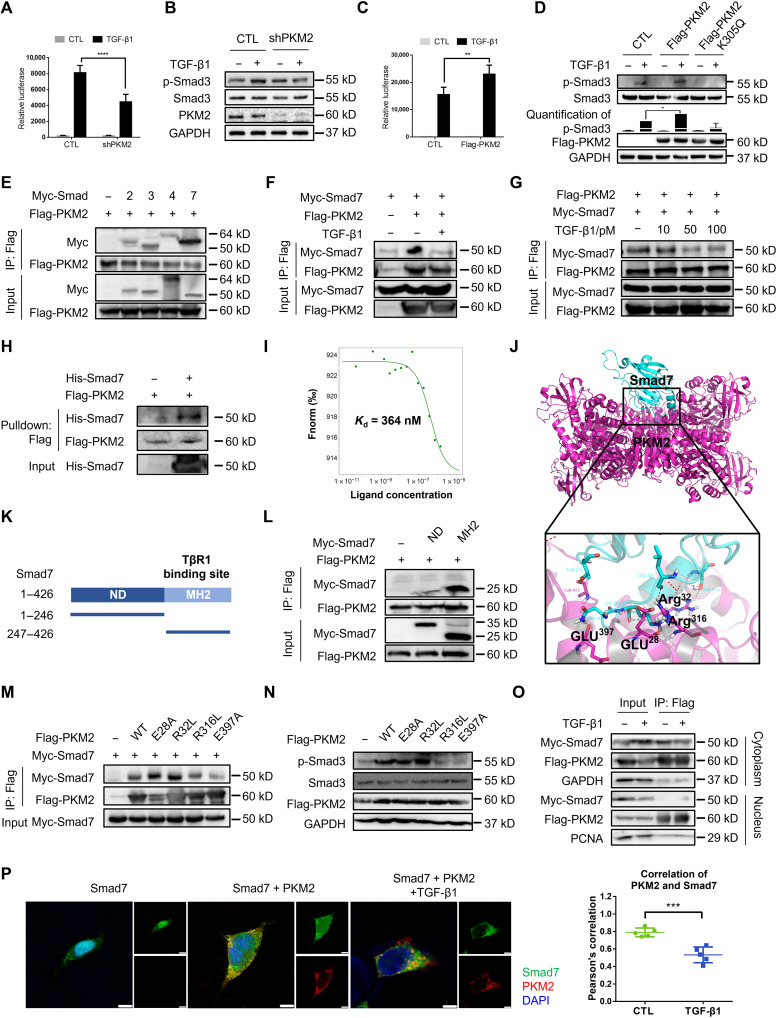
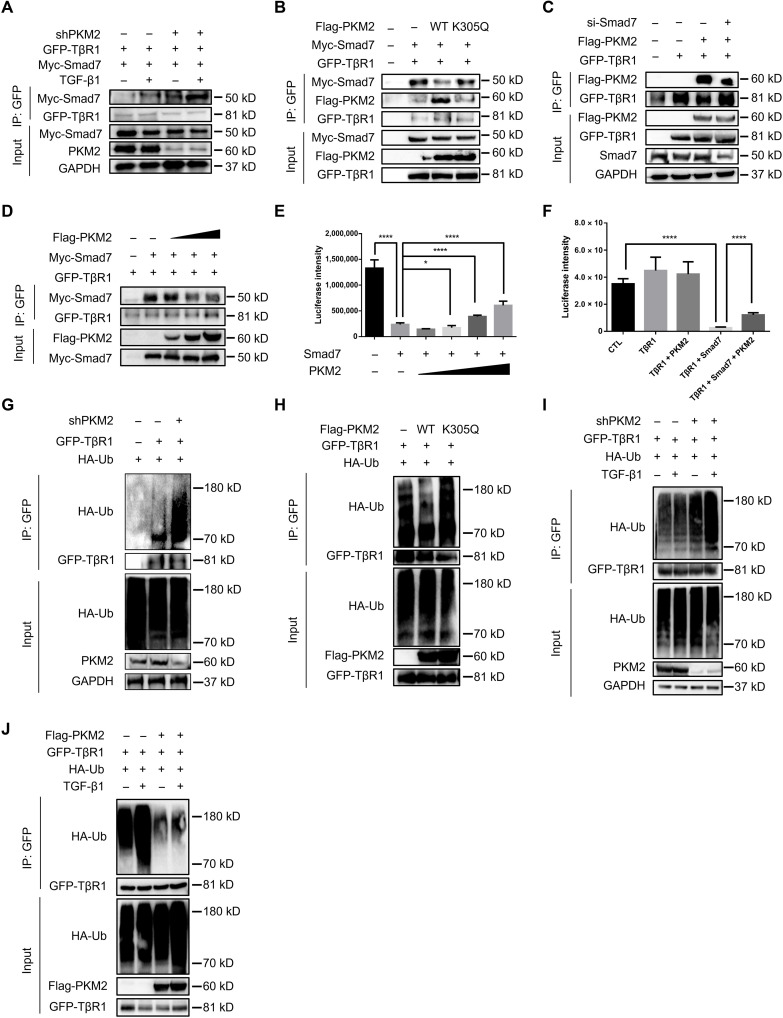
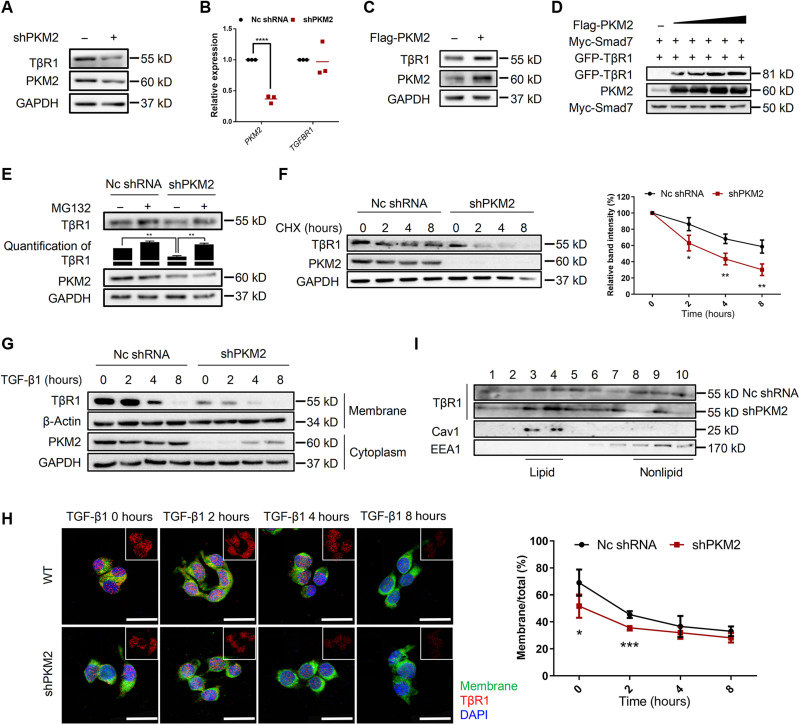
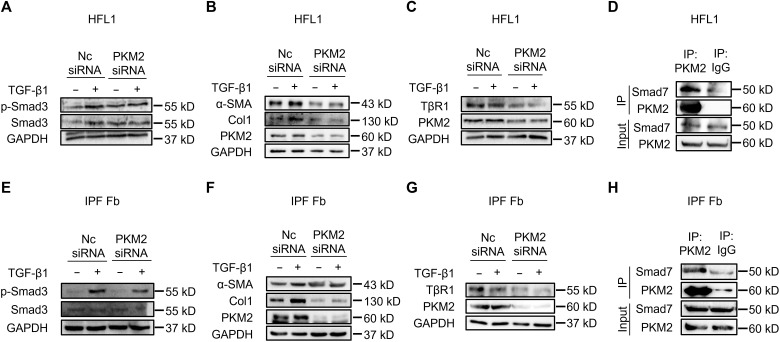
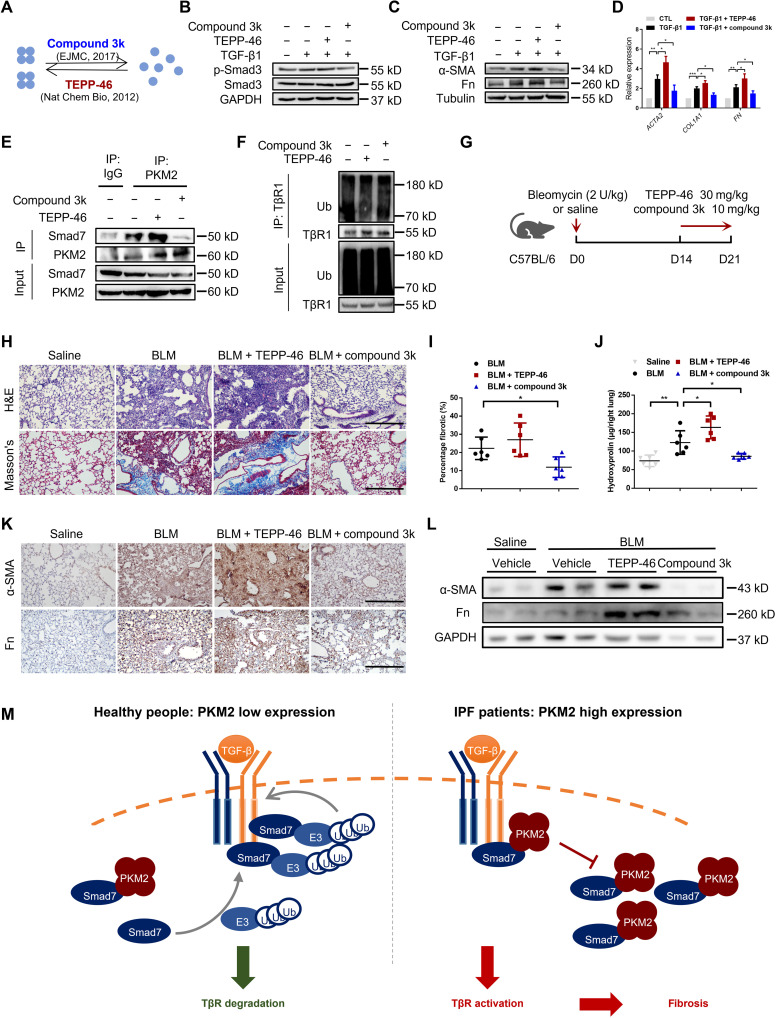
Idiopathic pulmonary fibrosis (IPF) is a progressive interstitial lung disease, and the molecular mechanisms remain poorly understood. Our findings demonstrated that pyruvate kinase M2 (PKM2) promoted fibrosis progression by directly interacting with Smad7 and reinforcing transforming growth factor-β1 (TGF-β1) signaling. Total PKM2 expression and the portion of the tetrameric form elevated in lungs and fibroblasts were derived from mice with bleomycin (BLM)-induced pulmonary fibrosis. Pkm2 deletion markedly alleviated BLM-induced fibrosis progression, myofibroblast differentiation, and TGF-β1 signaling activation. Further study showed that PKM2 tetramer enhanced TGF-β1 signaling by directly binding with Smad7 on its MH2 domain, and thus interfered with the interaction between Smad7 and TGF-β type I receptor (TβR1), decreased TβR1 ubiquitination, and stabilized TβR1. Pharmacologically enhanced PKM2 tetramer by TEPP-46 promoted BLM-induced pulmonary fibrosis, while tetramer disruption by compound 3k alleviated fibrosis progression. Our results demonstrate how PKM2 regulates TGF-β1 signaling and is a key factor in fibrosis progression.


Figures

Fig. 1.
Fig. 1.. Increase in PKM2 in patients with IPF and mouse model of BLM-induced pulmonary fibrosis.
(A) PKM2 expression in IPF lung tissues in a published GEO dataset of IPF lungs. Microarray analysis of PKM2 mRNA in lung samples of patients with early IPF (n = 8) and patients with advanced IPF (n = 9) compared with healthy controls (n = 6) (B) and the correlation between PKM2 mRNA expressions and those of ACTA2 and COL1A1 in lung tissues. The correlation coefficient (ρ) and the two-tailed significance are shown. (C) qRT-PCR analysis of Pkm2 mRNA expression in the lung tissues of mice following BLM induction (D) and the correlation between Pkm2 mRNA expressions and those of Acta2 and Col1a1 in the same lung tissues (n = 8 per group). Gapdh mRNA levels were used as an internal normalization control. (E) Representative results (n = 3 of Western blot with n = 10 mice per group) for Western blot analysis of PKM2 in the lung tissues of mice. (F) Representative results (n = 3 of Western blot with n = 8 mice per group) of PKM2 in primary lung fibroblasts and AT2 cells isolated from mice following BLM induction. (G) Representative results (n = 3 of Western blot with n = 8 mice per group) of PKM2 in the cross-linked primary lung fibroblasts. Data are represented as the means ± SEM. *P < 0.05; **P < 0.01; ***P < 0.001; ****P < 0.0001, Student’s t test.
Fig. 2.
Fig. 2.. PKM2 deletion attenuates BLM-induced pulmonary fibrosis.
(A) Schema illustrating generation of PKM2-KO mice. PKM2-KO and control mice were subjected to BLM treatment and euthanized at the indicated time points. (B) H&E staining of lung sections from control and PKM2-KO mice at various time points after BLM induction. Scale bars, 2 mm (top panel) and 100 μm (bottom panel). (C) Quantification of the severity of fibrosis. The fibrotic area is presented as percentage (n = 10 per group). (D) Masson’s staining of collagen on lung sections from control and PKM2-KO mice at various time points after BLM induction. Scale bars, 2 mm (top panel) and 100 μm (bottom panel). (E) Hydroxyproline content in lung tissues in control and PKM2-KO mice at various time points after BLM induction (n = 10 per group). (F to G) Representative results (n = 5 of Western blot with n = 10 mice per group) of α-SMA, Col1, and Fn (F); p-Smad3, Smad3, p-Akt, Akt, p-Erk, Erk, p-JNK, JNK, p-P38, and P38 (G) expression in lung tissues from control and PKM2-KO mice at various time points after BLM induction. Data are represented as the means ± SEM. *P < 0.05; **P < 0.01; ***P < 0.001; ****P < 0.0001, Student’s t test.
Fig. 3.
Fig. 3.. Loss of PKM2 suppresses myofibroblasts activation.
(A and B) On day 21 after BLM induction, lungs were stained with antibodies against α-SMA and PDGFRβ (A) or antibodies against α-SMA and Ki67 (B) (n = 5 per group). White arrowheads indicate double positive cells. Scale bars, 50 μm (A) and 25 μm (B). (C and D) On day 21 after BLM induction, primary lung fibroblasts were isolated and stained with antibodies against α-SMA and PDGFRβ (C) or Ki67 (D) (n = 5 per group). White arrowheads indicate double positive cells. Scale bars, 5 μm. (E) Western blot analysis of α-SMA, Col1, and Fn expressions in primary lung fibroblasts isolated from control and PKM2-KO mice 0 and 21 days after BLM treatment. (F) On day 21 after BLM induction, primary lung fibroblasts were isolated and seeded in a plate. When cells were fully confluent, a scratch was made in the center of the culture well. Images were obtained at 0, 12, and 24 hours. Three parallel lines were drawn, and images were analyzed using Image-Pro Plus software. (G) Heatmap of significantly down-regulated (<1.5-fold change) genes in PKM2-KO fibroblasts compared with WT fibroblasts. (H) Among 1710 down-regulated genes in PKM2-KO fibroblasts, 219 genes are up-regulated in patients with IPF. (I) Also shown is a Kyoto Encyclopedia of Genes and Genomes (KEGG) pathway enrichment analysis of these 219 commonly genes. (J) Representative down-regulated genes in PKM2-KO fibroblasts that were up-regulated in patients with IPF. Data are represented as the means ± SEM. *P < 0.05; **P < 0.01; ***P < 0.001; ****P < 0.0001, Student’s t test.
Fig. 4.
Fig. 4.. PKM2 enhances TGF-β1 signaling by directly interacting with Smad7.
(A) Luciferase assay in 293T cells transfected with the CAGA-luc reporter and shPKM2. (B) Immunoblot analysis in 293T cells transfected with the shPKM2 and treated with TGF-β1. (C) Luciferase assay in 293T cells transfected with the CAGA-luc reporter and Flag-PKM2. (D) Immunoblot analysis in 293T cells transfected with the Flag-PKM2 and Flag-PKM2-K305Q and treated with TGF-β1. (E) Immunoprecipitation with anti-Flag beads in 293T cells expressing Flag-PKM2 and Myc-tagged Smad2, Smad3, Smad4, and Smad7. (F and G) Immunoprecipitation with anti-Flag beads in 293T cells expressing Myc-Smad7 and Flag-PKM2. (H) Flag-tagged PKM2 and His-Smad7 were pulled down using anti-His beads. (I) The interaction of PKM2 with Smad7 was measured by MST. The Kd value was determined with MO.Affinity Analysis Software. (J) Molecular docking showed binding domain of human PKM2 and Smad7. (K) Domains of human Smad7. ND, N-terminal domain, amino acids 1 to 246; MH2, MH2 domain, amino acids 247 to 426. (L) Immunoprecipitation with anti-Flag beads in 293T cells transfected with Flag-PKM2 and different domains of Smad7. (M) Immunoprecipitation with anti-Flag beads in 293T cells transfected with Myc-Smad7 and Flag-PKM2 mutants. (N) Immunoblot analysis in 293T cells transfected with Flag-PKM2 mutants. (O) 293T cells were transfected with Flag-PKM2 and Myc-Smad7, and cytoplasmic and nuclear protein were separated and immunoprecipitated with anti-Flag beads. (P) 293T cells were transfected with Flag-PKM2 and Myc-Smad7 and stained with antibodies against Flag and Myc. Scale bars, 5 μm. Data are represented as the means ± SEM. **P < 0.01; ***P < 0.001; ****P < 0.0001, Student’s t test.
Fig. 5.
Fig. 5.. PKM2 counteracts Smad7 binding with TβR1.
(A) Immunoprecipitation with anti-GFP antibody in 293T cells transfected with GFP-TβR1, Myc-Smad7, and shPKM2. (B) Immunoprecipitation with anti-GFP antibody in 293T cells transfected with GFP-TβR1, Myc-Smad7, and Flag-PKM2 (WT or K305Q). (C) 293T cells were transfected with SMAD7 siRNA, then transfected with GFP-TβR1 and Flag-PKM2, and immunoprecipitated with anti-GFP antibody. (D) Immunoprecipitation with anti-GFP antibody in 293T cells transfected with GFP-TβR1, Myc-Smad7, and increasing concentrations of Flag-PKM2. (E) Luciferase assay in 293T cells transfected with the CAGA-luc reporter, Myc-Smad7, and increasing concentrations of Flag-PKM2. (F) Luciferase assay in 293T cells transfected with the CAGA-luc reporter, HA-TβR1, Myc-Smad7, and Flag-PKM2. (G) Immunoprecipitation with anti-GFP antibody in 293T cells transfected with GFP-TβR1, HA-ubiquitin, and shPKM2. Cells were treated with MG132 for 4 hours before harvest. (H) Immunoprecipitation with anti-GFP antibody in 293Tcells transfected with GFP-TβR1, HA-ubiquitin, and Flag-PKM2 (WT or K305Q). Cells were treated with MG132 for 4 hours before harvest. (I) Immunoprecipitation with anti-GFP antibody in 293T cells transfected with GFP-TβR1, HA-ubiquitin, and shPKM2. Cells were treated with MG132 for 4 hours before harvest. (J) Immunoprecipitation with anti-GFP antibody in 293T cells transfected with GFP-TβR1, HA-ubiquitin, and Flag-PKM2. Cells were treated with MG132 for 4 hours before harvest. Data are represented as the means ± SEM. *P < 0.05; ****P < 0.00001, Student’s t test.
Fig. 6.
Fig. 6.. PKM2 stabilizes TβR1 on the membrane.
(A) Western blot analysis of TβR1 expression in 293T cells transfected with shPKM2. (B) qRT-PCR analysis of TGFBR1 mRNA expression in 293T cells transfected with shPKM2. GAPDH mRNA levels were used as an internal normalization control (n = 3 per group). (C) Immunoblot analysis of TβR1 expression in 293T cells transfected with Flag-PKM2. (D) Immunoblot analysis of 293T cells transfected with Myc-Smad7, GFP-TβR1, and increasing amount of Flag-PKM2. (E) Representative immunoblot analysis of TβR1 in 293T cells transfected with shPKM2 in the presence or absence of MG132. (F) Immunoblot analysis of TβR1 in 293T cells transfected with shPKM2 in the presence or absence of cycloheximide. (G) 293T cells were transfected with shPKM2 and treated with TGF-β1, and membrane and cytoplasmic proteins were separated and subjected to immunoblot analysis. (H) 293T cells were transfected with shPKM2 and treated with TGF-β1. Membrane was stained with CellMask, and TβR1 was stained with anti-TβR1 antibody. Scale bars, 25 μm. The ratio of membrane TβR1 was shown as percentage. (I) TβR1 distribution in lipid and nonlipid fractions was analyzed in 293T cells transfected with shPKM2 and subjected to sucrose gradient subcellular fractionation to separate lipid rafts from other cellular components. An equal volume from each fraction was analyzed by immunoblot analysis. Data are represented as the means ± SEM. *P < 0.05; **P < 0.01; ***P < 0.001; ****P < 0.0001, Student’s t test.
Fig. 7.
Fig. 7.. PKM2 regulates TGF-β1 signaling in HFL1 and IPF fibroblasts.
(A to C) Western blot analysis of indicated proteins in HFL1 cells transfected with PKM2 siRNA for 48 hours and treated with TGF-β1 (5 ng/ml) for 1 hour (A) or 24 hours (B and C). (D) Immunoprecipitation of PKM2 with anti-PKM2 antibody in HFL1 cells. Western blot analysis of indicated proteins is shown. (E to G) Western blot analysis of indicated proteins in the IPF lung fibroblasts transfected with PKM2 siRNA for 48 hours and treated with TGF-β1 (5 ng/ml) for 1 hour (E) or 24 hours (F and G). (H) Immunoprecipitation of PKM2 with anti-PKM2 antibody in the IPF lung fibroblasts. Western blot analysis of indicated proteins is shown.
Fig. 8.
Fig. 8.. Pharmacologically regulating the conformation of PKM2 affects fibrosis progression.
(A) Two compounds that were used for regulating PKM2 conformation. (B) HFL1 cells were treated with TEPP-46 or compound 3k for 24 hours then treated with TGF-β1 for 1 hour. (C and D) HFL1 cells were treated with TGF-β1 for 24 hours then treated with TEPP-46 or compound 3k for another 24 hours before harvest. Western blot (C) and qRT-PCR analysis (D) are shown. (E) HFL1 cells were treated with TEPP-46 or compound 3k and immunoprecipitated with anti-PKM2 antibody. (F) HFL1 cells were treated with TEPP-46 or compound 3k and then treated with MG132 for 4 hours before immunoprecipitation with anti-TβR1 antibody. (G) Schema of intervention study design using BLM-induced C57BL/6 mice. (H) Histological analysis of the severity of lung fibrosis in mice after BLM induction. Representative images for H&E (top) and Masson’s staining (bottom). Scale bars, 50 μm. (I) Quantification of the severity of fibrosis. The fibrotic area is presented as percentage (n = 6 per group). (J) Hydroxyproline content in lung tissues (n = 6 per group). (K) Representative images of the immunohistochemical analysis of α-SMA and Fn in lung sections. Scale bars, 50 μm. (L) Representative results (n = 2 of Western blot with n = 6 mice per group) of α-SMA and Fn in lung tissues. (M) Working model showing that the overexpression of PKM2 causes sustained stabilization of TβR1 and progression of pulmonary fibrosis. Data are represented as the means ± SEM. *P < 0.05; **P < 0.01; ***P < 0.001, Student’s t test.

References

    1. Raghu G., Remy-Jardin M., Myers J. L., Richeldi L., Ryerson C. J., Lederer D. J., Behr J., Cottin V., Danoff S. K., Morell F., Flaherty K. R., Wells A., Martinez F. J., Azuma A., Bice T. J., Bouros D., Brown K. K., Collard H. R., Duggal A., Galvin L., Inoue Y., Jenkins R. G., Johkoh T., Kazerooni E. A., Kitaichi M., Knight S. L., Mansour G., Nicholson A. G., Pipavath S. N. J., Buendia-Roldan I., Selman M., Travis W. D., Walsh S., Wilson K. C.; E. R. S. J. R. S. American Thoracic Society; S. Latin American Thoracic , Diagnosis of idiopathic pulmonary fibrosis. An official ATS/ERS/JRS/ALAT clinical practice guideline. Am. J. Respir. Crit. Care Med. 198, e44–e68 (2018). - PubMed
    1. King T. E. Jr., Pardo A., Selman M., Idiopathic pulmonary fibrosis. Lancet 378, 1949–1961 (2011). - PubMed
    1. Spagnolo P., Cottin V., Genetics of idiopathic pulmonary fibrosis: From mechanistic pathways to personalised medicine. J. Med. Genet. 54, 93–99 (2017). - PubMed
    1. Barkauskas C. E., Noble P. W., Cellular mechanisms of tissue fibrosis. 7. New insights into the cellular mechanisms of pulmonary fibrosis. Am. J. Physiol. Cell Physiol. 306, C987–C996 (2014). - PMC - PubMed
    1. Bellaye P.-S., Kolb M., Why do patients get idiopathic pulmonary fibrosis? Current concepts in the pathogenesis of pulmonary fibrosis. BMC Med. 13, 176 (2015). - PMC - PubMed

LinkOut - more resources