

Glycemia Reduction in Type 2 Diabetes - Microvascular and Cardiovascular Outcomes
- PMID: 36129997
- PMCID: PMC9832916
- DOI: 10.1056/NEJMoa2200436
Glycemia Reduction in Type 2 Diabetes - Microvascular and Cardiovascular Outcomes
Abstract
Background: Data are lacking on the comparative effectiveness of commonly used glucose-lowering medications, when added to metformin, with respect to microvascular and cardiovascular disease outcomes in persons with type 2 diabetes.
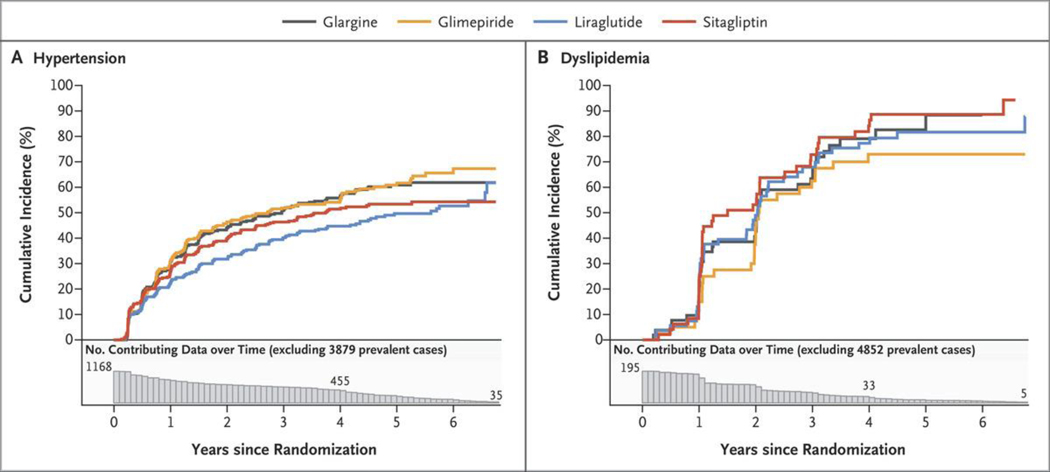
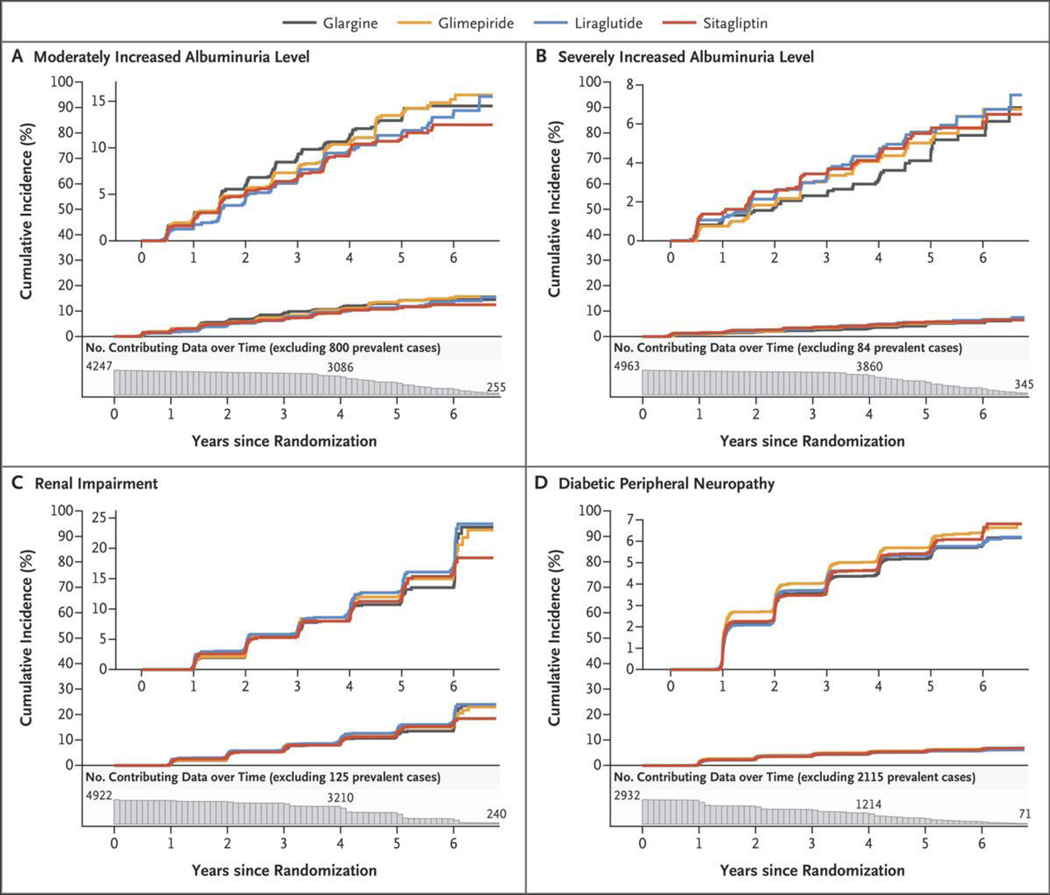
Methods: We assessed the comparative effectiveness of four commonly used glucose-lowering medications, added to metformin, in achieving and maintaining a glycated hemoglobin level of less than 7.0% in participants with type 2 diabetes. The randomly assigned therapies were insulin glargine U-100 (hereafter, glargine), glimepiride, liraglutide, and sitagliptin. Prespecified secondary outcomes with respect to microvascular and cardiovascular disease included hypertension and dyslipidemia, confirmed moderately or severely increased albuminuria or an estimated glomerular filtration rate of less than 60 ml per minute per 1.73 m2 of body-surface area, diabetic peripheral neuropathy assessed with the Michigan Neuropathy Screening Instrument, cardiovascular events (major adverse cardiovascular events [MACE], hospitalization for heart failure, or an aggregate outcome of any cardiovascular event), and death. Hazard ratios are presented with 95% confidence limits that are not adjusted for multiple comparisons.
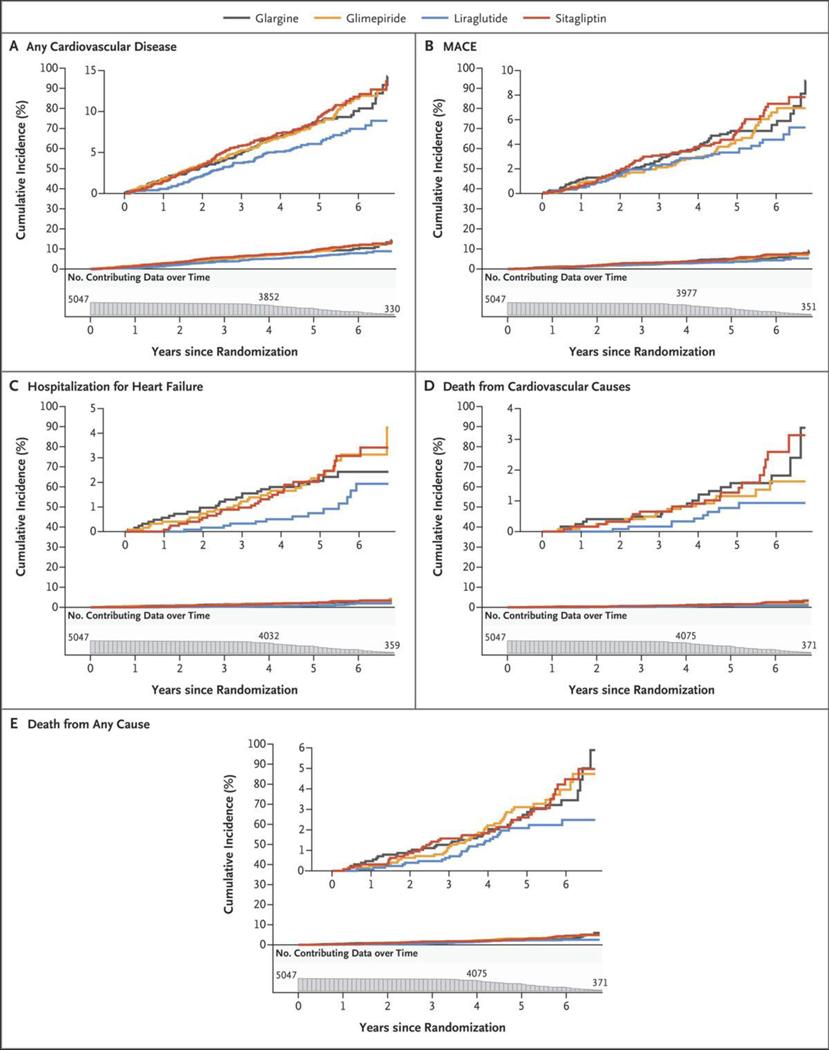
Results: During a mean 5.0 years of follow-up in 5047 participants, there were no material differences among the interventions with respect to the development of hypertension or dyslipidemia or with respect to microvascular outcomes; the mean overall rate (i.e., events per 100 participant-years) of moderately increased albuminuria levels was 2.6, of severely increased albuminuria levels 1.1, of renal impairment 2.9, and of diabetic peripheral neuropathy 16.7. The treatment groups did not differ with respect to MACE (overall rate, 1.0), hospitalization for heart failure (0.4), death from cardiovascular causes (0.3), or all deaths (0.6). There were small differences with respect to rates of any cardiovascular disease, with 1.9, 1.9, 1.4, and 2.0 in the glargine, glimepiride, liraglutide, and sitagliptin groups, respectively. When one treatment was compared with the combined results of the other three treatments, the hazard ratios for any cardiovascular disease were 1.1 (95% confidence interval [CI], 0.9 to 1.3) in the glargine group, 1.1 (95% CI, 0.9 to 1.4) in the glimepiride group, 0.7 (95% CI, 0.6 to 0.9) in the liraglutide group, and 1.2 (95% CI, 1.0 to 1.5) in the sitagliptin group.
Conclusions: In participants with type 2 diabetes, the incidences of microvascular complications and death were not materially different among the four treatment groups. The findings indicated possible differences among the groups in the incidence of any cardiovascular disease. (Funded by the National Institute of Diabetes and Digestive and Kidney Diseases and others; GRADE ClinicalTrials.gov number, NCT01794143.).
Copyright © 2022 Massachusetts Medical Society.
Figures
Comment in
-
After Metformin - Next Steps for Type 2 Diabetes with Low Cardiovascular Risk.N Engl J Med. 2022 Sep 22;387(12):1136-1138. doi: 10.1056/NEJMe2210531. N Engl J Med. 2022. PMID: 36130002 No abstract available.
-
In type 2 diabetes, liraglutide reduced CV events at 5 y vs. glargine, glimepiride, or sitagliptin.Ann Intern Med. 2023 Jan;176(1):JC9. doi: 10.7326/J22-0105. Epub 2023 Jan 3. Ann Intern Med. 2023. PMID: 36592466
-
Commentary on glucose reduction in type 2 diabetes (GRADE).J Diabetes Investig. 2023 Jun;14(6):741-743. doi: 10.1111/jdi.13994. Epub 2023 Feb 17. J Diabetes Investig. 2023. PMID: 36799078 Free PMC article. No abstract available.
References
-
- UK Prospective Diabetes Study (UKPDS) Group. Intensive blood-glucose control with sulphonylureas or insulin compared with conventional treatment and risk of complications in patients with type 2 diabetes (UKPDS 33). Lancet 1998;352:837–53. - PubMed
-
- Hemmingsen B, Lund SS, Gluud C, et al. Targeting intensive glycaemic control versus targeting conventional glycaemic control for type 2 diabetes mellitus. Cochrane Database Syst Rev 2013;11: CD008143. - PubMed
-
- Zinman B, Wanner C, Lachin JM, et al. Empagliflozin, cardiovascular outcomes, and mortality in type 2 diabetes. N Engl J Med 2015;373:2117–28. - PubMed
Publication types
MeSH terms
Substances
Associated data
Grants and funding
- U01 DK119083/DK/NIDDK NIH HHS/United States
- UL1 TR000445/TR/NCATS NIH HHS/United States
- U01DK098246/DK/NIDDK NIH HHS/United States
- UL1 TR002529/TR/NCATS NIH HHS/United States
- UL1 TR002541/TR/NCATS NIH HHS/United States
- UL1 TR000439/TR/NCATS NIH HHS/United States
- P30 DK020541/DK/NIDDK NIH HHS/United States
- UL1 TR002378/TR/NCATS NIH HHS/United States
- UL1 TR001425/TR/NCATS NIH HHS/United States
- P30 DK020572/DK/NIDDK NIH HHS/United States
- UL1 TR002243/TR/NCATS NIH HHS/United States
- UL1 TR002345/TR/NCATS NIH HHS/United States
- P30 DK017047/DK/NIDDK NIH HHS/United States
- UL1 TR002548/TR/NCATS NIH HHS/United States
- U34 DK088043/DK/NIDDK NIH HHS/United States
- UL1 TR002537/TR/NCATS NIH HHS/United States
- P30 DK092926/DK/NIDDK NIH HHS/United States
- UL1 TR002535/TR/NCATS NIH HHS/United States
- P30 DK072476/DK/NIDDK NIH HHS/United States
- P30 DK079626/DK/NIDDK NIH HHS/United States
- UL1 TR001409/TR/NCATS NIH HHS/United States
- U01 DK098246/DK/NIDDK NIH HHS/United States
- UL1 TR001449/TR/NCATS NIH HHS/United States
- UL1 TR002489/TR/NCATS NIH HHS/United States
- U54 GM104940/GM/NIGMS NIH HHS/United States
- UL1 TR001108/TR/NCATS NIH HHS/United States
- UL1 TR000170/TR/NCATS NIH HHS/United States
- UL1 TR001102/TR/NCATS NIH HHS/United States
- U34DK088043/DK/NIDDK NIH HHS/United States
- P30 DK124723/DK/NIDDK NIH HHS/United States
LinkOut - more resources
Full Text Sources
Other Literature Sources
Medical