. 2022 Sep 21;14(663):eadd2376.
doi: 10.1126/scitranslmed.add2376. Epub 2022 Sep 21.

Receptor-independent fluid-phase macropinocytosis promotes arterial foam cell formation and atherosclerosis

Affiliations

Receptor-independent fluid-phase macropinocytosis promotes arterial foam cell formation and atherosclerosis

Hui-Ping Lin et al. Sci Transl Med. .

Abstract

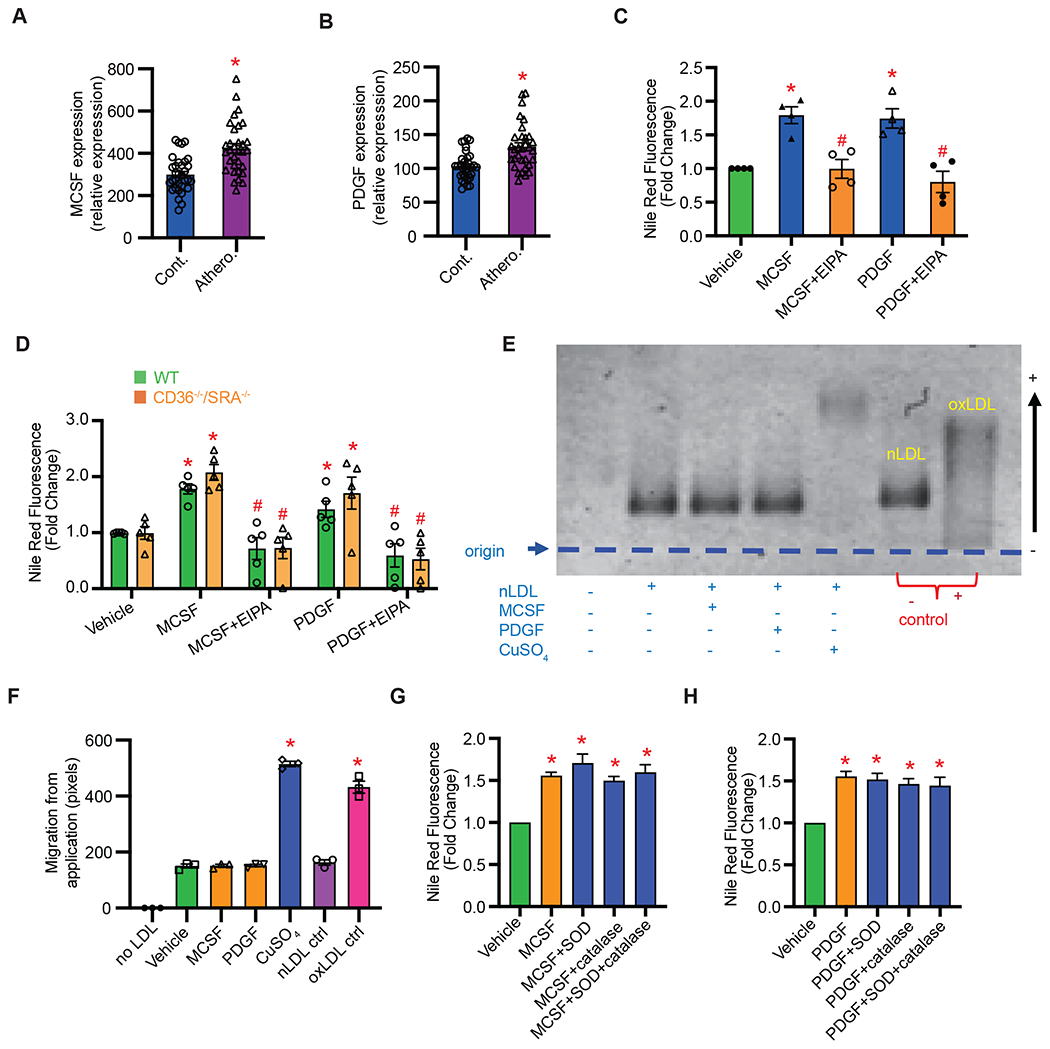
Accumulation of lipid-laden foam cells in the arterial wall plays a central role in atherosclerotic lesion development, plaque progression, and late-stage complications of atherosclerosis. However, there are still fundamental gaps in our knowledge of the underlying mechanisms leading to foam cell formation in atherosclerotic arteries. Here, we investigated the role of receptor-independent macropinocytosis in arterial lipid accumulation and pathogenesis of atherosclerosis. Genetic inhibition of fluid-phase macropinocytosis in myeloid cells (LysMCre+ Nhe1fl/fl) and repurposing of a Food and Drug Administration (FDA)-approved drug that inhibits macrophage macropinocytosis substantially decreased atherosclerotic lesion development in low-density lipoprotein (LDL) receptor-deficient and Apoe-/- mice. Stimulation of macropinocytosis using genetic (H-RASG12V) and physiologically relevant approaches promoted internalization of unmodified native (nLDL) and modified [e.g., acetylated (ac) and oxidized (ox) LDL] lipoproteins in both wild-type and scavenger receptor (SR) knockout (Cd36-/-/Sra-/-) macrophages. Pharmacological inhibition of macropinocytosis in hypercholesterolemic wild-type and Cd36-/-/Sra-/- mice identified an important role of macropinocytosis in LDL uptake by lesional macrophages and development of atherosclerosis. Furthermore, serial section high-resolution imaging, LDL immunolabeling, and three-dimensional (3D) reconstruction of subendothelial foam cells provide visual evidence of lipid macropinocytosis in both human and murine atherosclerotic arteries. Our findings complement the SR paradigm of atherosclerosis and identify a therapeutic strategy to counter the development of atherosclerosis and cardiovascular disease.


Conflict of interest statement

Competing interest declaration: The authors declare that the research was conducted in the absence of any commercial or financial relationships that could be taken as a potential conflict of interest.

Figures

Figure 1.
Figure 1.. The macropinocytosis inhibitor EIPA reduces atherosclerosis development in wild-type and SR knockout mice.
A-E, Male WT and CD36−−/SR-A−− mice treated ± EIPA following PCSK9-AAV + partial LCA ligation and fed a Western diet for 4 weeks. A, Representative images of isolated LCA (yellow arrows), scale bar: 1 mm. B, Oil Red O (ORO) staining for proximal, middle and distal LCA segments, scale bar: 100 μm. C, Quantification of ORO positive area (n = 8 - 13). D, Representative images of H&E, Masson’s trichrome and CD68 staining of LCA. E-G, Quantification of collagen deposition (E), lesion area (F) and CD68+ macrophages (G) in the LCA (n = 5). H, Total plasma cholesterol (n = 9 13). I, body weight prior to sacrifice (n = 9). J, Systolic blood pressure (n = 5). Data represent mean ± SEM. *p < 0.05 vs. vehicle.
Figure 2.
Figure 2.. Characterization of lipid macropinocytosis by WT and CD36−/−/SR-A−/− macrophages in vitro.
A, A schematic diagram illustrating morphological plasma membrane changes during macropinocytosis. B-E, Wild-type and CD36−/−/SR-A−/− BMDM overexpressing HrasG12V or GFP control, ± EIPA (25 μM, 1 hr) treatment. B, Representative SEM images. Green arrows - linear ruffles; red arrows - curved ruffles or macropinocytic cups, scale bar 1 μm. C, Quantification of membrane ruffles (n = 3). D, HrasG12V overexpressing and GFP control macrophages were incubated with 50 μg/ml nLDL for 24 hrs. Representative images of ORO staining (n = 3), scale bar 50 μm. E, Cells were treated as described in (D) and Nile Red fluorescence was quantified by flow cytometry (n = 4). F, THP-1 macrophages were pretreated with vehicle or EIPA and incubated with nLDL or oxLDL (50 μg/ml) for 24 hrs in the presence or absence of macropinocytosis stimulator PMA. Macrophage LDL accumulation was quantified using Nile Red staining (n = 6 -10). Data are mean ± SEM. *p < 0.05 vs. vehicle, #p < 0.05 vs. AD HrasG12V.
Figure 3.
Figure 3.. Physiologically relevant stimulation of macropinocytosis promotes lipid accumulation in wild-type and SR knockout macrophages.
A & B, Analysis of publicly available database demonstrating increased expression of MCSF (A) and PDGF (B) in human atherosclerotic arteries compared with control tissue (n = 32). C, MCSF (100 ng/ml) and PDGF (200 ng/ml) stimulate nLDL internalization in THP-1 macrophages via macropinocytosis (n = 4). D, MCSF and PDGF stimulate cholesterol accumulation in WT and CD36−/−/SR-A−/− BMDM incubated with nLDL (50 μg/ml) (n = 5). E, THP-1 macrophages were treated with vehicle, MCSF (100 ng/ml) or PDGF (200 ng/ml) in the presence of 50 μg/ml nLDL for 24 hrs. LDL oxidation was determined by agarose gel electrophoresis of collected conditioned media. Positive controls: nLDL + CuSO4 (50 μM, 72 hrs) and oxLDL. Negative control: nLDL. F, Quantification of electrophoretic mobility (n = 3). G & H, THP-1 macrophages were pretreated with ± SOD (100 U/ml) and/or catalase (250 U/ml) for 1 hr, incubated with 50 μg/ml nLDL for 24 hrs in the presence or absence of MCSF (G) or PDGF (H). Cells were incubated with 50 ng/ml Nile Red for 7 min and FACS quantification for Nile Red fluorescence was performed. Data are mean ± SEM. *p < 0.05 vs. vehicle, #p < 0.05 vs. MCSF or PDGF.
Figure 4.
Figure 4.. Visualization of macrophage macropinocytosis in human and murine atherosclerotic arteries.
A, Serial section TEM imaging demonstrating the presence of plasma membrane protrusions on the surface of lipid-laden macrophages in atherosclerotic ApoE−/− aorta. LD: lipid droplets, N: nucleus. Red arrows - membrane protrusion, asterisk – curving ruffle, orange arrows – parallel side of identified ruffle. Scale bar, 1 μm. B, 3D reconstruction of a foamy macrophage in ApoE−/− aorta. Scale cube, 1 μm3. C, Calculated total surface area, ruffle volume and tip-base distance of identified membrane ruffles. D, 3D reconstruction of curved ruffle. Inset: TEM image of curved ruffle in 2D. H = height, W = width and D = depth. E, Human heart and aortic tissue isolated from a cadaveric donor with a history of cardiovascular disease (patient # 1). IC = atheroprone Inner Curvature. F & G, TEM imaging demonstrating formation of single membrane protrusions (red arrows), parallel ruffles (red asterisk) and membrane-derived vesicles (orange arrows) in IC segments of human atherosclerotic aorta. H, Left: Cross section of human atherosclerotic LAD (patient # 2). Right: Immunogold-labeling of LDL (blue arrowheads). Open cups – red arrows, macropinosomes: orange arrows. I, A schematic diagram illustrating the design of in vivo LDL tracking experiments. J, Representative gating strategy identifying isolated F4/80+ macrophages from atherosclerotic ApoE−/− aorta. FACS analysis of DiI fluorescence in isolated F4/80+ cells. K, Quantification of mean fluorescence intensity, n = 3, *p < 0.05. Data are mean ± SEM.
Figure 5.
Figure 5.. Genetic deletion of NHE1 in myeloid cells reduces atherosclerosis development in hypercholesterolemic mice.
A-J, NHE1f/f and NHE1ΔM mice were injected with PCSK9-AAV, subjected to partial LCA ligation and fed a Western diet for 3 weeks to induce atherosclerosis. A, Representative images of isolated LCA (yellow arrows), scale bar: 1 mm. B, Oil Red O staining for proximal, middle and distal LCA segments, scale bar: 100 μm. C, Quantification of ORO positive area (n = 15 and 13 for NHE1f/f and NHE1ΔM, respectively). D, Total plasma cholesterol. E, Lipid profile of pooled samples (n = 5). F, blood glucose (n = 9 and 7 for NHE1f/f and NHE1ΔM mice, respectively). G, systolic blood pressure (n = 5 and 4 for NHE1f/f and NHE1ΔM mice, respectively). H, body weight measured prior to sacrifice (n = 9 and 7 for NHE1f/f and NHE1ΔM mice, respectively). I, fat mass and J, fluid content measured using NMR (n = 9 and 7 for NHE1f/f and NHE1ΔM mice, respectively). K & L, internalization of Dil-nLDL by NHE1f/f and NHE1ΔM macrophages in peritoneal cavity. Confocal images of harvested peritoneal macrophages (K), FACS analysis of Dil fluorescence (L) (n = 5). M, LDLR−/− mice were injected with CFDA-labeled BMDM from NHE1f/f and NHE1ΔM mice and Dil-LDL fluorescence in CD11b+ CFDA+ aortic macrophages isolated from LDLR−/− mice determined (n = 4). Data are mean ± SEM. *p < 0.05.
Figure 6.
Figure 6.. Genetic deletion of myeloid cell NHE1 inhibits atherosclerosis development in atheroprone PCSK9-overexpressing mice following 16 weeks Western diet feeding.
A, En face Oil Red O (ORO) staining of the thoracic aorta. Scale bar: 2 mm. B, Representative images of ORO, H&E and Masson’s trichrome staining of the aortic sinus. Scale bar 0.2 mm. C, Quantification of aortic ORO positive area in (A), D-F, Quantification of ORO positive area (D), lesion area (E) and collagen deposition (F) in the aortic sinus (n = 9 and 10 for NHE1f/f and NHE1ΔM, respectively). G, Total cholesterol (n = 9 and 10 for NHE1f/f and NHE1ΔM, respectively) H, systolic blood pressure (n = 6 and 7 for NHE1f/f and NHE1ΔM, respectively). I, body weight (n = 9 and 10 for NHE1f/f and NHE1ΔM, respectively). J, fat mass (n = 9 and 10 for NHE1f/f and NHE1ΔM, respectively) and K, fluid content (n = 9 and 10 for NHE1f/f and NHE1ΔM, respectively). L, blood glucose (n = 9 and 10 for NHE1f/f and NHE1ΔM, respectively). Data are mean ± SEM. *p < 0.05.
Figure 7.
Figure 7.. Treatment with a “repurposed” FDA-approved drug that inhibits macropinocytosis attenuates atherosclerosis development in hypercholesterolemic mice.
A, THP-1 macrophages were pretreated with 5 μM imipramine for 1 hr, then treated with vehicle, MCSF (100 ng/ml) or PDGF (200 ng/ml) in the presence of 50 μg/ml nLDL for 24 hrs. Cells were incubated with Nile Red for 7 min and FACS quantification for Nile Red fluorescence was performed (n = 4). B-O, Wild-type mice were injected with PCSK9-AAV, underwent partial LCA ligation and fed a Western diet for 4 weeks to induce atherosclerosis. Mice were treated with vehicle or imipramine (s.c.). B, Representative images of LCA (yellow arrows), scale bar: 1 mm. C, Representative Orcein and Martius Scarlet Blue (OMSB) staining for proximal, middle and distal segments and segmentation algorithm of LCA. L: lumen, P: plaque area, VWA: Vessel wall area. Scale bar: 100 μm (Red). The inset shows zoomed-in images for distal segments of LCA, scale bar: 50 μm (Black). D, Quantification of plaque area (n = 5), E, area under the curve (AUC). F-I, Quantification of plaque area (F), vessel wall area (G), relative internal vessel area (IVA %, H) and relative collagen area (Collagen %, I) (n = 5). J, Quantification of mean Dil fluorescence intensity in isolated CD11b+ lesional cells, (n = 4). K-P, blood glucose (K, n = 9). L, systolic blood pressure (n = 5). M, body weight (n = 9). N, fat mass (n = 9) and O, fluid content (n = 9). P, Total cholesterol (n = 9). Data are mean ± SEM. *p < 0.05 vs. vehicle, #p < 0.05 vs. MCSF or PDGF.

Comment in

References

    1. Chiu JJ, Chien S, Effects of disturbed flow on vascular endothelium: pathophysiological basis and clinical perspectives. Physiol Rev 91, 327–387 (2011). - PMC - PubMed
    1. Ghosh S, Zhao B, Bie J, Song J, Macrophage cholesteryl ester mobilization and atherosclerosis. Vascul Pharmacol 52, 1–10 (2010). - PMC - PubMed
    1. Silverman MG et al., Association Between Lowering LDL-C and Cardiovascular Risk Reduction Among Different Therapeutic Interventions: A Systematic Review and Meta-analysis. JAMA 316, 1289–1297 (2016). - PubMed
    1. Lloyd-Jones D et al., Heart disease and stroke statistics--2009 update: a report from the American Heart Association Statistics Committee and Stroke Statistics Subcommittee. Circulation 119, e21–181 (2009). - PubMed
    1. Goldstein JL, Ho YK, Basu SK, Brown MS, Binding site on macrophages that mediates uptake and degradation of acetylated low density lipoprotein, producing massive cholesterol deposition. Proc Natl Acad Sci U S A 76, 333–337 (1979). - PMC - PubMed

Publication types