Gastric dysfunction in patients with chronic nausea and vomiting syndromes defined by a noninvasive gastric mapping device
- PMID: 36130019
- PMCID: PMC10042458
- DOI: 10.1126/scitranslmed.abq3544
Gastric dysfunction in patients with chronic nausea and vomiting syndromes defined by a noninvasive gastric mapping device
Abstract
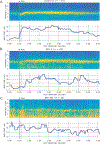
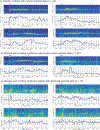
Chronic nausea and vomiting syndromes (NVSs) are prevalent and debilitating disorders. Putative mechanisms include gastric neuromuscular disease and dysregulation of brain-gut interaction, but clinical tests for objectively defining gastric motor function are lacking. A medical device enabling noninvasive body surface gastric mapping (BSGM) was developed and applied to evaluate NVS pathophysiology. BSGM was performed in 43 patients with NVS and 43 matched controls using Gastric Alimetry (Alimetry), a conformable high-resolution array (8 × 8 electrodes; 20-mm interelectrode spacing), wearable reader, and validated symptom-logging app. Continuous measurement encompassed a fasting baseline (30 minutes), 482-kilocalorie meal, and 4-hour postprandial recording, followed by spectral and spatial biomarker analyses. Meal responses were impaired in NVS, with reduced amplitudes compared to controls (median, 23.3 microvolts versus 38.0 microvolts, P < 0.001), impaired fed-fasting power ratios (1.1 versus 1.6, P = 0.02), and disorganized slow waves (spatial frequency stability, 13.6 versus 49.5; P < 0.001). Two distinct NVS subgroups were evident with indistinguishable symptoms (all P > 0.05). Most patients (62%) had normal BSGM studies with increased psychological comorbidities (43.5% versus 7.7%; P = 0.03) and anxiety scores (median, 16.5 versus 13.0; P = 0.035). A smaller subgroup (31%) had markedly abnormal BSGM, with biomarkers correlating with symptoms (nausea, pain, excessive fullness, early satiety, and bloating; all r > 0.35, P < 0.05). Patients with NVS share overlapping symptoms but comprise distinct underlying phenotypes as revealed by a BSGM device. These phenotypes correlate with symptoms, which should inform clinical management and therapeutic trial design.
Conflict of interest statement
Conflicts of Interest
GOG, PD and AG hold grants and intellectual property in the field of gastrointestinal electrophysiology. GOG and AG are founders and Directors of Alimetry Ltd. GOG is Director in The Insides Company. SC, SW, CD, GS, PD, JW and CNA are members of Alimetry Ltd. PD is a Director in FlexiMap Ltd. The remaining authors have no conflicts of interest to declare.
Figures


References
-
- Sperber AD, Bangdiwala SI, Drossman DA, Ghoshal UC, Simren M, Tack J, Whitehead WE, Dumitrascu DL, Fang X, Fukudo S, Kellow J, Okeke E, Quigley EMM, Schmulson M, Whorwell P, Archampong T, Adibi P, Andresen V, Benninga MA, Bonaz B, Bor S, Fernandez LB, Choi SC, Corazziari ES, Francisconi C, Hani A, Lazebnik L, Lee YY, Mulak A, Rahman MM, Santos J, Setshedi M, Syam AF, Vanner S, Wong RK, Lopez-Colombo A, Costa V, Dickman R, Kanazawa M, Keshteli AH, Khatun R, Maleki I, Poitras P, Pratap N, Stefanyuk O, Thomson S, Zeevenhooven J, Palsson OS, Worldwide Prevalence and Burden of Functional Gastrointestinal Disorders, Results of Rome Foundation Global Study. Gastroenterology 160, 99–114.e3 (2021). - PubMed
-
- Aziz I, Palsson OS, Whitehead WE, Sperber AD, Simrén M, Törnblom H, Epidemiology, Clinical Characteristics, and Associations for Rome IV Functional Nausea and Vomiting Disorders in Adults. Clin. Gastroenterol. Hepatol 17, 878–886 (2019). - PubMed
-
- Wang YR, Fisher RS, Parkman HP, Gastroparesis-related hospitalizations in the United States: trends, characteristics, and outcomes, 1995–2004. Am. J. Gastroenterol 103, 313–322 (2008). - PubMed
Publication types
MeSH terms
Grants and funding
LinkOut - more resources
Full Text Sources
Medical

