. 2022 Sep 20;40(12):111369.
doi: 10.1016/j.celrep.2022.111369.

Microglial control of neuronal development via somatic purinergic junctions

Affiliations

Microglial control of neuronal development via somatic purinergic junctions

Csaba Cserép et al. Cell Rep. .

Abstract

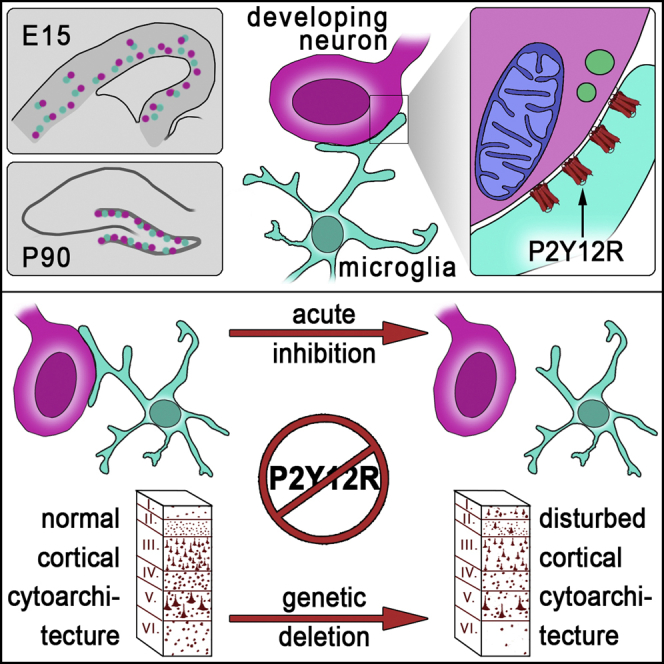
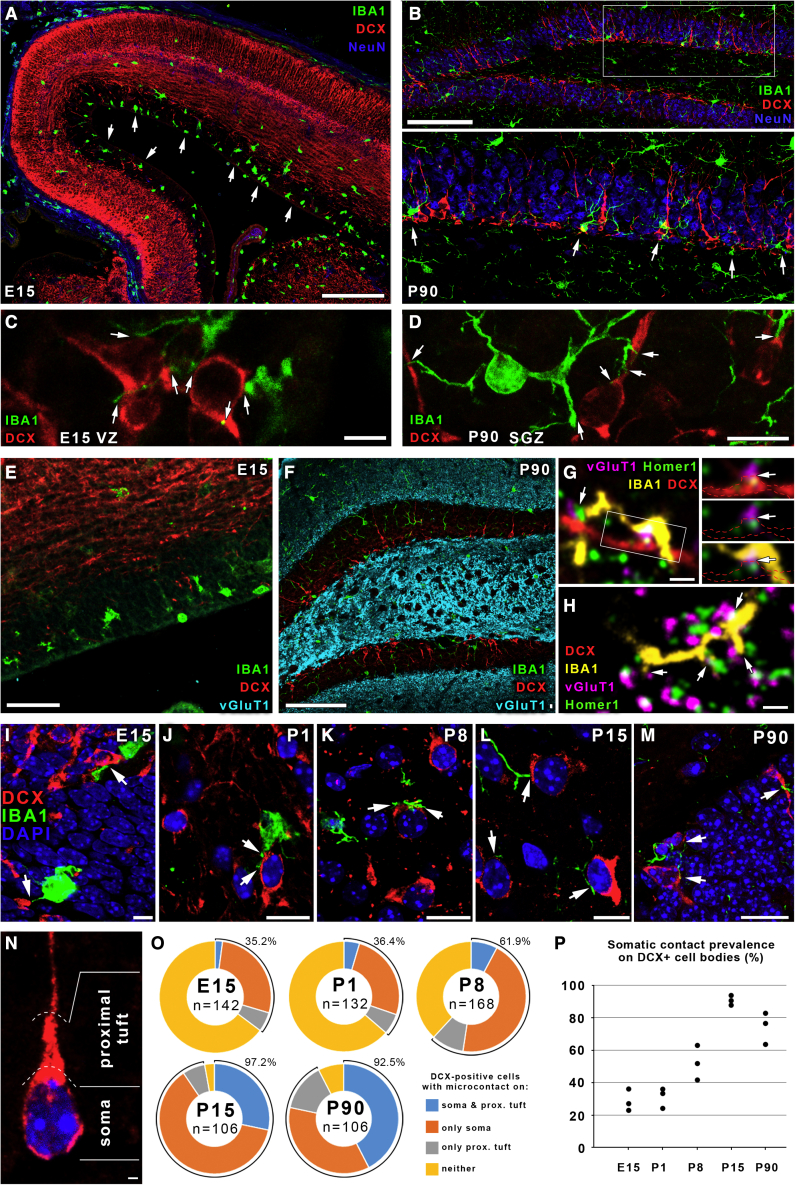
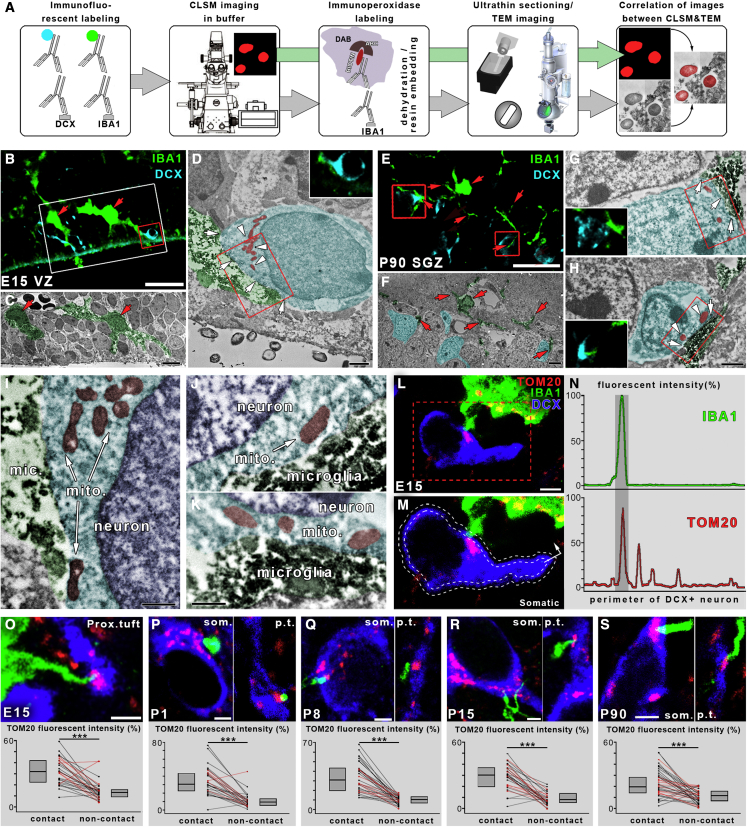
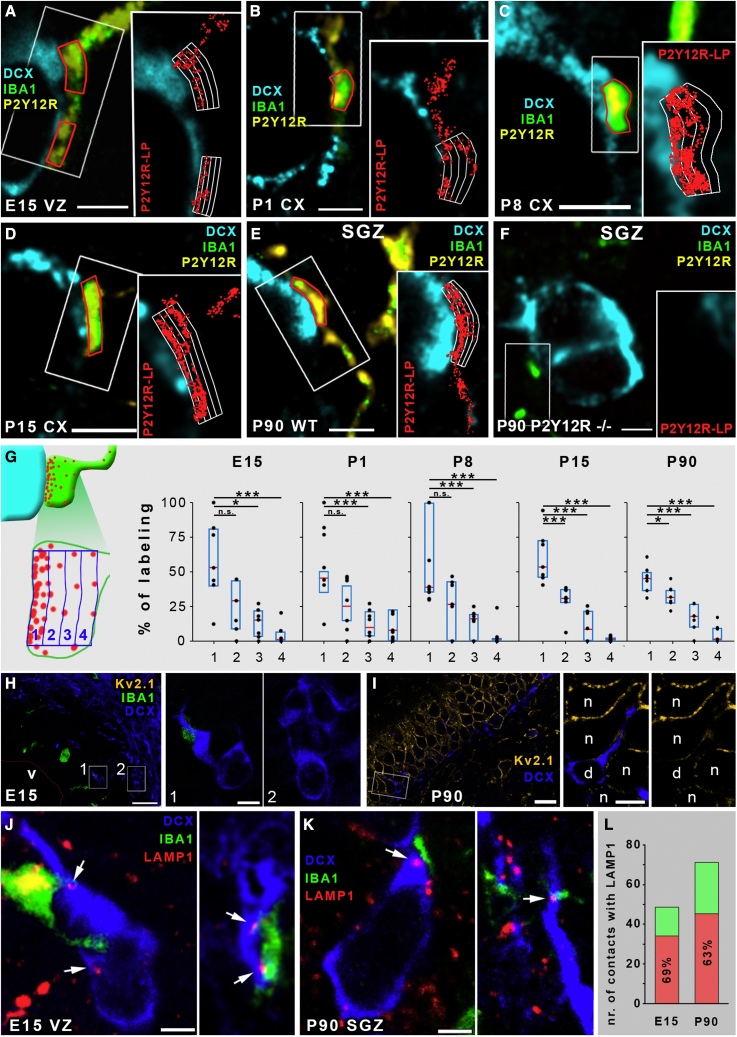
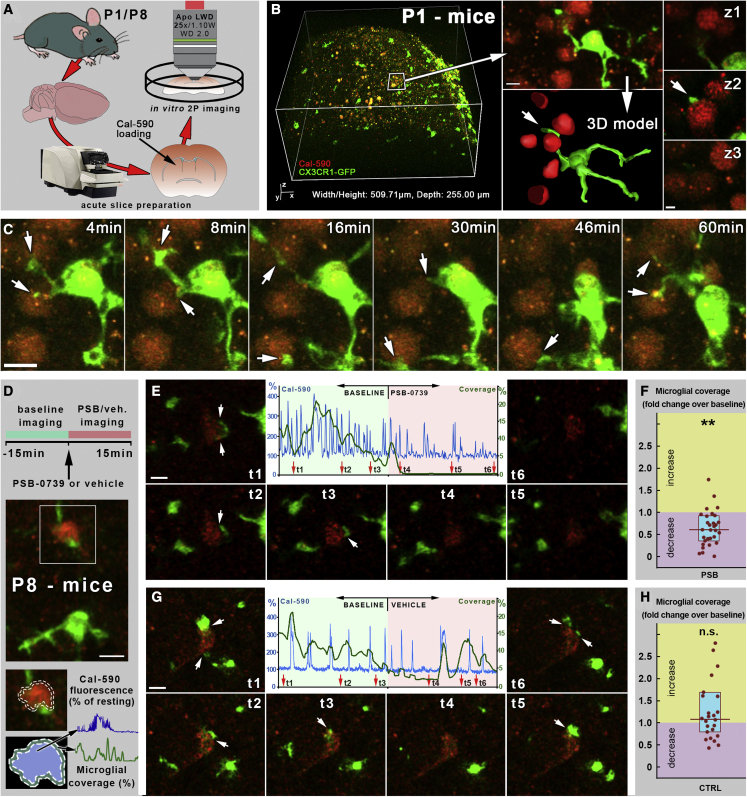
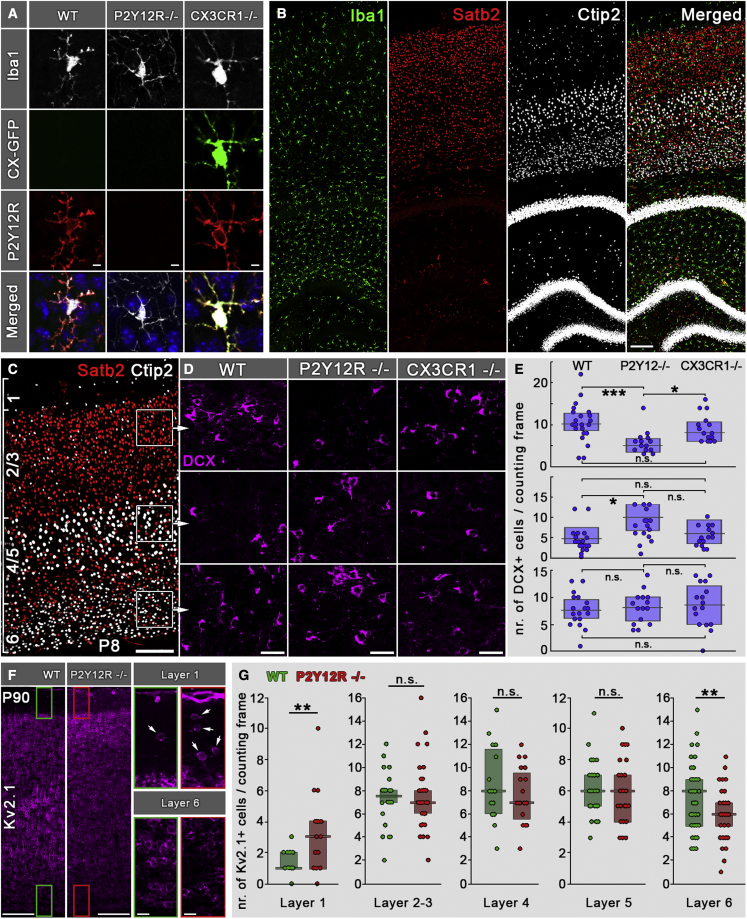
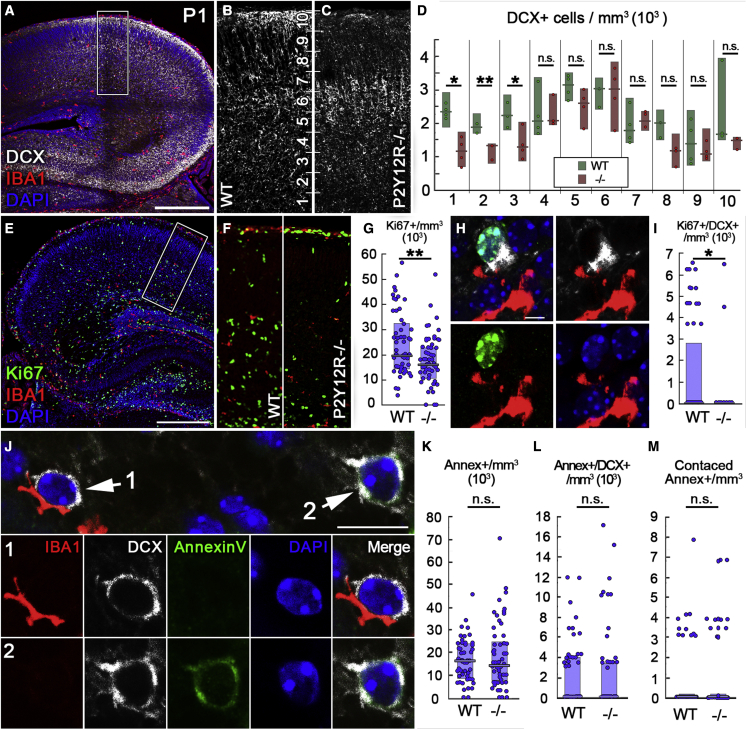
Microglia, the resident immune cells of the brain, play important roles during development. Although bi-directional communication between microglia and neuronal progenitors or immature neurons has been demonstrated, the main sites of interaction and the underlying mechanisms remain elusive. By using advanced methods, here we provide evidence that microglial processes form specialized contacts with the cell bodies of developing neurons throughout embryonic, early postnatal, and adult neurogenesis. These early developmental contacts are highly reminiscent of somatic purinergic junctions that are instrumental for microglia-neuron communication in the adult brain. The formation and maintenance of these junctions is regulated by functional microglial P2Y12 receptors, and deletion of P2Y12Rs disturbs proliferation of neuronal precursors and leads to aberrant cortical cytoarchitecture during development and in adulthood. We propose that early developmental formation of somatic purinergic junctions represents an important interface for microglia to monitor the status of immature neurons and control neurodevelopment.

Keywords: CP: Neuroscience; P2Y12R; doublecortin; microglia; neuronal development; purinergic; somatic junction.


Conflict of interest statement

Declaration of interests The authors declare no competing interests.

Figures

None
Graphical abstract
Figure 1
Figure 1
Microglial processes contact the cell bodies, neurites, and synapses of DCX+ developing neurons (A) Confocal laser scanning microscopy (CLSM) image shows the distribution of IBA1+ microglia (green) in E15 pallium. Postmitotic neurons are labeled for doublecortin (DCX, red), NeuN is shown in blue, and white arrows point to the enrichment of microglia in the SVZ and VZ. (B) IBA1+ microglia are enriched in the subgranular zone of the DG in P90 mice. Staining is as in (A), and white arrows point to some microglia. The area within the white box in the top panel is enlarged in the bottom panel. (C and D) High-resolution CLSM images show some examples of microglia contacts in the E15 VZ (C) and the DG in P90 mice (D); white arrows point to contact sites. (E) CLSM image shows the lack of synapses in an E15 cortical plate. Samples are labeled for IBA1 (green), DCX (red), and VGLUT1 (cyan). (F) Staining is the same as in (E); the image shows the abundant presence of glutamatergic synapses outside of the granule cell layer. (G) IBA1+ microglial processes (yellow) contact developing glutamatergic synapses, as identified by the appositions of VGLUT1 (magenta) and Homer1 (green) on a DCX+ dendrite (red) in the stratum moleculare of a P90 DG. White arrows point to contacts. (H) Staining is the same as in (G); microglial processes contact synapses of mature neurons in the stratum moleculare of a P90 DG. (I–M) CLSM images show some examples of microglia-neuron somatic contact sites during both developmental and adult neurogenesis. Nuclei are visualized by DAPI (blue), microglia are stained for IBA1 (green) and postmitotic neurons for DCX (red), and white arrows point to contact sites. (I), E15; (J), P1; (K), P8; (L), P15; (M), P90. (N) Division of a DCX+ neuron’s cell body into “soma” and “proximal tuft” compartments. (O) Ratio of DCX+ neurons contacted by microglial processes on their somata, proximal tufts, or both. Percentage values next to the diagrams represent the ratio of cells that were contacted either way. (P) Somatic contact prevalence on DCX+ cell bodies (individual values represent different animals). Images and measurements are from the cortical plate in E15 mice, neocortex from P1–P15 mice, and hippocampal dentate gyrus from P90 mice; n = 3 mice in each age group. Scale bars represent 200 μm in (A); 100 μm in (B) and (F); 5 μm in (C); 10 μm in (D), (J), and (L); 50 μm in (E), 1 μm in (G) and (H); 15 μm in (I), (K), and (M); and 2 μm in (N). See also Figure S1 and Table S1.
Figure 2
Figure 2
Microglial processes form direct membrane-membrane contacts with the cell bodies of DCX+ developing neurons at sites enriched with mitochondria (A) Schematic of correlated light and electron microscopy workflow. (B–D) Maximum intensity projection of a 1.5-μm-thick volume from a CLSM stack from an E15 mouse shows an example of identified microglia-neuron somatic junctions (B). IBA1+ microglia are shown in green, DCX+ neurons are shown in cyan, the area in the white box is shown on a correlated transmission electron microscopy (TEM) image in (C), and red arrows point to corresponding microglia. The somatic junction within the red box in (B) is enlarged in the TEM image in (D). White arrows point to the direct membrane-membrane contact, and white arrowheads mark neuronal mitochondria close to the junction. The small CLSM inset shows the single confocal image plane closest to the TEM image. TEM images are pseudo-colored (microglia in green, developing neurons in cyan, and mitochondria in red). All 6 CLSM-identified contacts proved to be direct membrane-membrane contacts after TEM assessment. (E–H) Same as (B)–(D) from a P90 mouse; the somatic junction within the left red box in (E) is enlarged in the TEM image in (G), and the junction within the right red box in (E) is enlarged in the TEM image in (H). All 10 CLSM-identified contacts proved to be direct membrane-membrane contacts after TEM assessment. (I–K) Areas within red boxes in (D), (G), and (H), respectively, are enlarged from subsequent ultrathin sections. (L) CLSM image showing an example of IBA1-labeled (green) microglia contacting the cell body of a DCX+ postmitotic neuron (blue) exactly where a large mitochondrion (TOM20 labeling, red) resides within the neuronal cell body. The area within the red dashed line is enlarged in (M). (M) The process of a semi-automated unbiased analysis of fluorescence intensity area. (N) The intensity values are plotted along the perimeter of the neuron. (O) Example of a microglial process (green) contacting the proximal tuft of a DCX+ neuron in an E15 brain. Results show that TOM20 fluorescence intensity is significantly higher within the contact sites than outside of them. Each line represents results from one neuron; somata are represented by black and proximal tufts by red lines. Median values and interquartile range are marked by gray boxes (n = 164 cells from 3 mice). (P–S) CLSM examples of mitochondrial enrichment at somatic (som.) and proximal tuft (p.t.) junctions in cortical brain samples from P1, P8, P15, and P90 mice and corresponding results. Images and measurements are from the cortical plate in E15 mice, neocortex from P1–P15 mice, and hippocampal dentate gyrus from P90 mice (3 mice/age group). Wilcoxon matched-pairs test; ∗∗∗p < 0.001. Scale bars represent 30 μm in (B); 4 μm in (C); 1 μm in (D), (G), and (H); 500 nm in (I)–(K); 20 μm in (E), 3 μm in (L); 2 μm in (F) and (O)–(S); this also applies to insets. See also Figures S2J–S2M and Table S2.
Figure 3
Figure 3
Microglial P2Y12Rs define somatic purinergic junctions on DCX+ developing neurons; these cells do not express Kv2.1 but contain LAMP1+ lysosomes in the vicinity of microglial contacts (A–F) Correlated STORM super-resolution and CLSM images showing the abundant expression of the microglia-specific P2Y12Rs on microglial processes contacting DCX-+ cell bodies. DCX is shown in cyan, IBA1 in green, P2Y12R in yellow, and STORM localization points (LPs) for P2Y12R in red in the insers. Counting frames are marked with red lines in main panels and white grids in insets. Images are from E15 (A), P1 (B), P8 (C), P15 (D), P90 (E), and P90 P2Y12R knockout (F) mice. Note the complete absence of CLSM and STORM signals for P2Y12R in the knockout mice in (F). All IBA1+ microglial processes in contact with DCX+ neuronal cell bodies were expressing P2Y12Rs. In the VZ and SVZ of E15 brains n = 72; in the neocortex of P1 n = 60, P8 n = 85, and P15 n = 74; and in the dentate gyrus of P90 animals n = 93 contacts were tested (n = 2 mice in each age group, altogether n = 10 mice). (G) Spatial analysis of super-resolution data shows the enrichment of P2Y12R labeling on the contacting side of microglial processes. Black dots represent data points, a blue bracket is the interquartile range, and median is shown by a red segment; n = 35 processes from 5 mice (Table S3). Kruskal-Wallis test followed by Tukey’s comparison; n.s., no significant difference; p < 0.05, ∗∗∗p < 0.001. (H) CLSM image showing the complete lack of Kv2.1 (yellow) expression in an E15 cortical plate (142 fully reconstructed DCX+ cells tested from two mice, zero Kv2.1+). DCX (blue), IBA1 (green); the ventricle (v) is delineated by a thin red line. Rectangular areas labeled with numbers are enlarged on the right. (I) CLSM image showing robust expression of Kv2.1 (yellow) in the dentate granule cells of P90 mice, but DCX+ (blue) cells are completely devoid of Kv2.1 labeling (136 fully reconstructed DCX+ cells tested from two mice, zero Kv2.1+). The rectangular area is enlarged on the right. n, neuron; d, DCX+ cell. (J and K) CLSM images showing examples of IBA1-labeled (green) microglial processes contacting the cell body of DCX+ postmitotic neurons (blue) with LAMP1+ puncta (red, white arrows) in the vicinity. The images are from the SVZ/VZ of E15 (J) and the DG of P90 mice (K). (L) 69% of all contacts in E15 and 63% in P90 mice contained LAMP1+ vesicles within the DCX+ cell bodies in the close vicinity of microglial process contact. The red and green columns together show the number of measured contacts (49 for E15, 71 for P90, 2 mice for each group), and the red columns represent the number of contacts with LAMP1 labeling (34 for E15, 45 for P90). Scale bars represent 2 μm in (A)–(F), 30 μm in (H) (5 μm in insets), 15 μm in (I) (5 μm in insets), 2 μm in (J), and 2 μm in (K). See also Figure S3.
Figure 4
Figure 4
Developmental microglia-neuron somatic junctions are dynamic and depend on P2Y12R function (A) Schematic depicting the experimental procedure. (B) In vitro 2-photon imaging of mouse neocortex from P1 animals confirmed the presence of dynamic somatic junctions between microglia and developing neurons. The area in the white box is enlarged in the right panel, which is also shown in the 3D model below. The contact site marked with a white arrow in the 3D model is shown at z2, with image planes marked by z1 and z3 above and below the contact, respectively. (C) The slice was scanned over 1 h; insets show representative time frames from a smaller area. Microglial processes (green, CX3CR1-GFP) establish somatic contacts on cell bodies of multiple developing neurons (red, Cal-590). White arrows point to contacts, some of which are re-connected multiple times by microglial processes. (D) Schematic of the P2Y12R-inhibition experiment (E) and representative measurement of a “PSB” experiment. The calcium trace and coverage values, measured over the 30-min experiment, are superimposed, and red arrows show the respective temporal positions (t1–t6) of the insets of the measured cell. White arrows point to contacts. (F) Statistical analysis confirmed that acute inhibition of microglial P2Y12Rs induced a rapid and robust decrease of microglial process coverage on developing neurons (median, 38% decrease from baseline; interquartile range, 0.36–0.92; n = 30 cells, 3 mice). Coverage in control is 1, and PSB effect is plotted as an increase or decrease compared with the control. Wilcoxon matched-pairs test; ∗∗p < 0.001. (G) Same as (E) but from a “vehicle” experiment. (H) Statistical analysis confirmed that vehicle addition did not induce a significant change in microglial coverage (median, 1.06-fold increase over baseline; interquartile range, 0.75–1.66; n = 25 cells, 3 mice). Wilcoxon matched-pairs test. Scale bars represent 10 μm.
Figure 5
Figure 5
Microglial P2Y12Rs are necessary for formation of proper cortical cytoarchitecture (A) CLSM images showing triple immunofluorescence staining for Iba1, GFP, and P2Y12Rs on the different genotypes used in this experiment. Merged images also show cell nuclei labeled with DAPI. (B) CLSM image showing triple immunofluorescence staining for Iba1, Ctip2, and Satb2 in P8 mice. (C–E) Ctip2 and Satb2 immunofluorescence staining was used to delineate cortical layers, and the density of DCX+ cells was assessed in layers 6, 4/5, and 2/3. (D and E) In layer 6, there was no difference in DCX+ cell density between WT, P2Y12R−/−, and CX3CR1−/− mice (n = 9 mice). However, in layers 4/5, we observed a significant (200% of WT) increase in DCX+ cell density in P2Y12R−/− mice compared with WT mice, which did not differ from CX3CR1−/− mice (n = 9 mice). On the contrary, in layers 2/3, the density of DCX+ cells was significantly lower (50% of WT) in P2Y12R−/− mice compared with WT or CX3CR1−/− mice, which did not differ from each other (n = 9 mice). Median values and interquartile range are marked by boxes and whiskers. Kruskal-Wallis test followed by Tukey’s comparison; p < 0.05, ∗∗∗p < 0.001. (F) Kv2.1 staining in adult mouse neocortex in WT and P2Y12R KO animals; insets show enlarged areas from layers 1 and 6. (G) Lack of P2Y12Rs causes robustly elevated neuronal density in layer 1 (300% over WT) and leads to a significant decrease of neuronal density in layer 6 (75% of WT, n = 6 mice). Median values and interquartile ranges are marked by boxes and whiskers. Mann-Whitney U test; ∗∗p < 0.01. Scale bars represent 5 μm in (A), 100 μm in (B) and (C), 20 μm in (D), 150 μm in (F), and 20 μm in insets.
Figure 6
Figure 6
Microglial P2Y12R signaling is necessary for proper neuronal proliferation in the developing neocortex (A–C) Maximum intensity projection of a 20-μm-thick volume from a CLSM stack from an P1 mouse (A). DCX+ neurons are shown in white and IBA1+ microglia in red, and nuclei are visualized by DAPI (blue). The area within the white box is enlarged in (B) and (C). The cortex is divided into 10 zones, numbered from the border of the SVZ to the pial surface. (D) Lack of P2Y12Rs causes decreased density of DCX+ cells in the lower zones (to 51% of WT in zone 1, 72% of WT in zone 2, and to 58% of WT in zone 3; n = 6 mice). Mann-Whitney U test; p < 0.05, ∗∗p < 0.01. (E) CLSM images showing triple immunofluorescence staining for Ki67 (green), IBA1 (red), and DAPI (blue). (F) The genotypes and the areas of measurements are the same as above. (G) Lack of P2Y12Rs causes decreased density of Ki67+ cells to 82% of WT; n = 6 mice. Mann-Whitney U test, ∗∗p < 0.01. (H) A population of DCX+ cells is also positive for Ki67. (I) Lack of P2Y12Rs causes a significant decrease of the density of Ki67/DCX double-positive cells (to 0% of WT, n = 6 mice). Mann-Whitney U test, p < 0.05. (J) CLSM image showing immunofluorescence staining for Iba1 (red), DCX (white), Annexin V (green), and DAPI (blue). The images below show microglia contacting a DCX+ cell (1) and an Annexin V/DCX double-positive cell without microglial contact (2). (K) Density of Annexin V+ cells in WT and P2Y12R−/− animals (n = 6 mice). (L) Density of Annexin V/DCX double-positive cells in WT and P2Y12R−/− animals (n = 6 mice). (M) Density of Annexin V+ cells contacted by microglia in WT and P2Y12R−/− animals (n = 6 mice). Mann-Whitney U test. Median values and interquartile ranges are marked by boxes and whiskers. Scale bars represent 300 μm in (A) and (E), 5 μm in (H), and 10 μm in (J). Insets are 200 μm wide in (B) and (C) and 150 μm wide in (F). See also Figures S4 and S5.

Similar articles

Cited by

References

    1. Aarum J., Sandberg K., Haeberlein S.L.B., Persson M.A.A. Migration and differentiation of neural precursor cells can be directed by microglia. Proc. Natl. Acad. Sci. USA. 2003;100:15983–15988. - PMC - PubMed
    1. Ali A.A.H., Abdel-Hafiz L., Tundo-Lavalle F., Hassan S.A., von Gall C. P2Y2 deficiency impacts adult neurogenesis and related forebrain functions. FASEB J. 2021;35:e21546. - PubMed
    1. Araki T., Ikegaya Y., Koyama R. The effects of microglia- and astrocyte-derived factors on neurogenesis in health and disease. Eur. J. Neurosci. 2020;54:5880–5901. - PMC - PubMed
    1. Arrázola M.S., Andraini T., Szelechowski M., Mouledous L., Arnauné-Pelloquin L., Davezac N., Belenguer P., Rampon C., Miquel M.C. Mitochondria in developmental and adult neurogenesis. Neurotox. Res. 2019;36:257–267. - PubMed
    1. Baalman K., Marin M.A., Ho T.S.Y., Godoy M., Cherian L., Robertson C., Rasband M.N. Axon initial segment–associated microglia. J. Neurosci. 2015;35:2283–2292. - PMC - PubMed

Publication types

LinkOut - more resources