. 2022 Sep 20;40(12):111400.
doi: 10.1016/j.celrep.2022.111400.

Genome-wide fetalization of enhancer architecture in heart disease

Affiliations

Genome-wide fetalization of enhancer architecture in heart disease

Cailyn H Spurrell et al. Cell Rep. .

Abstract

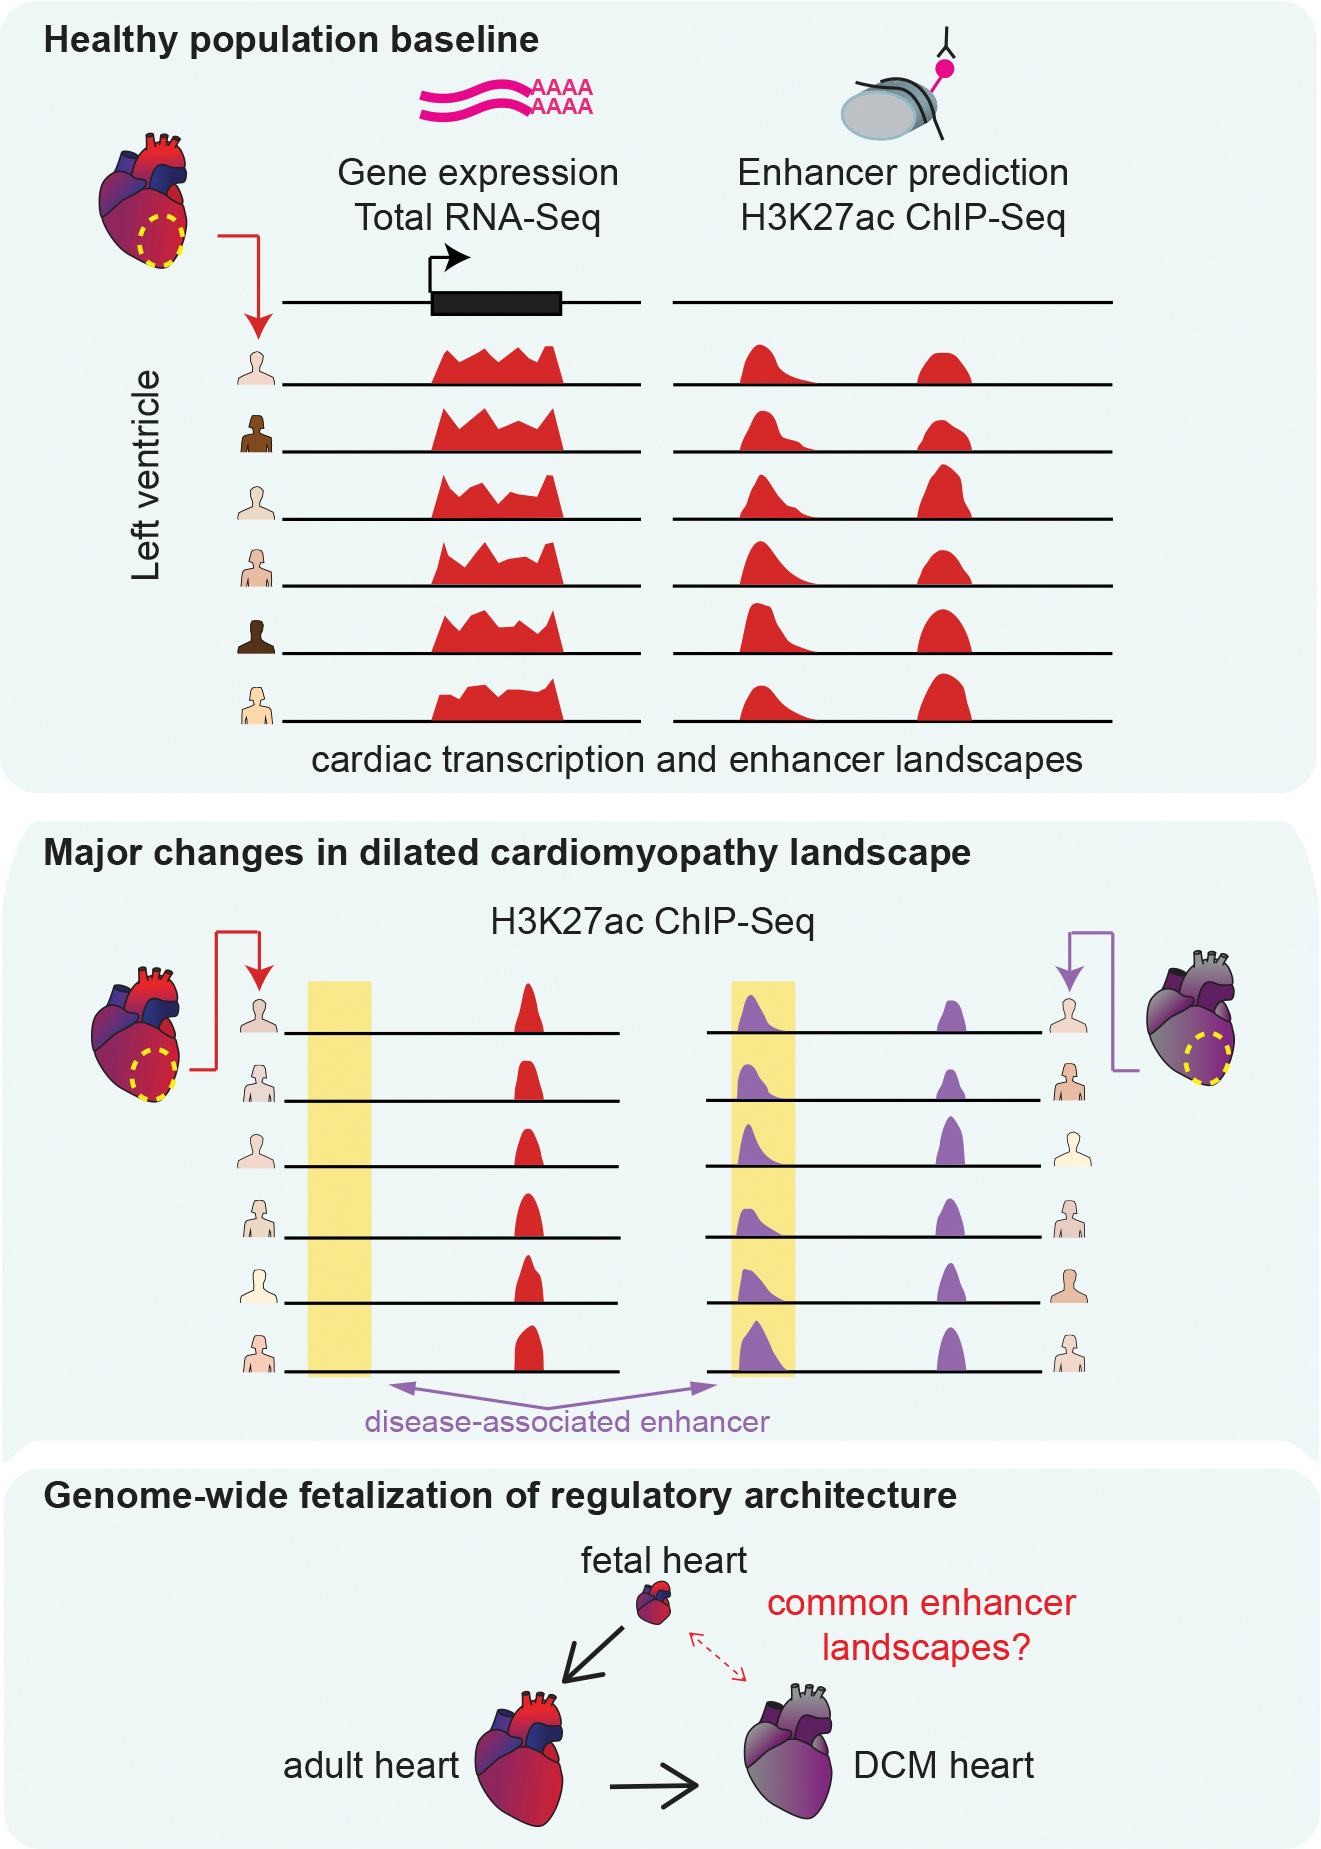
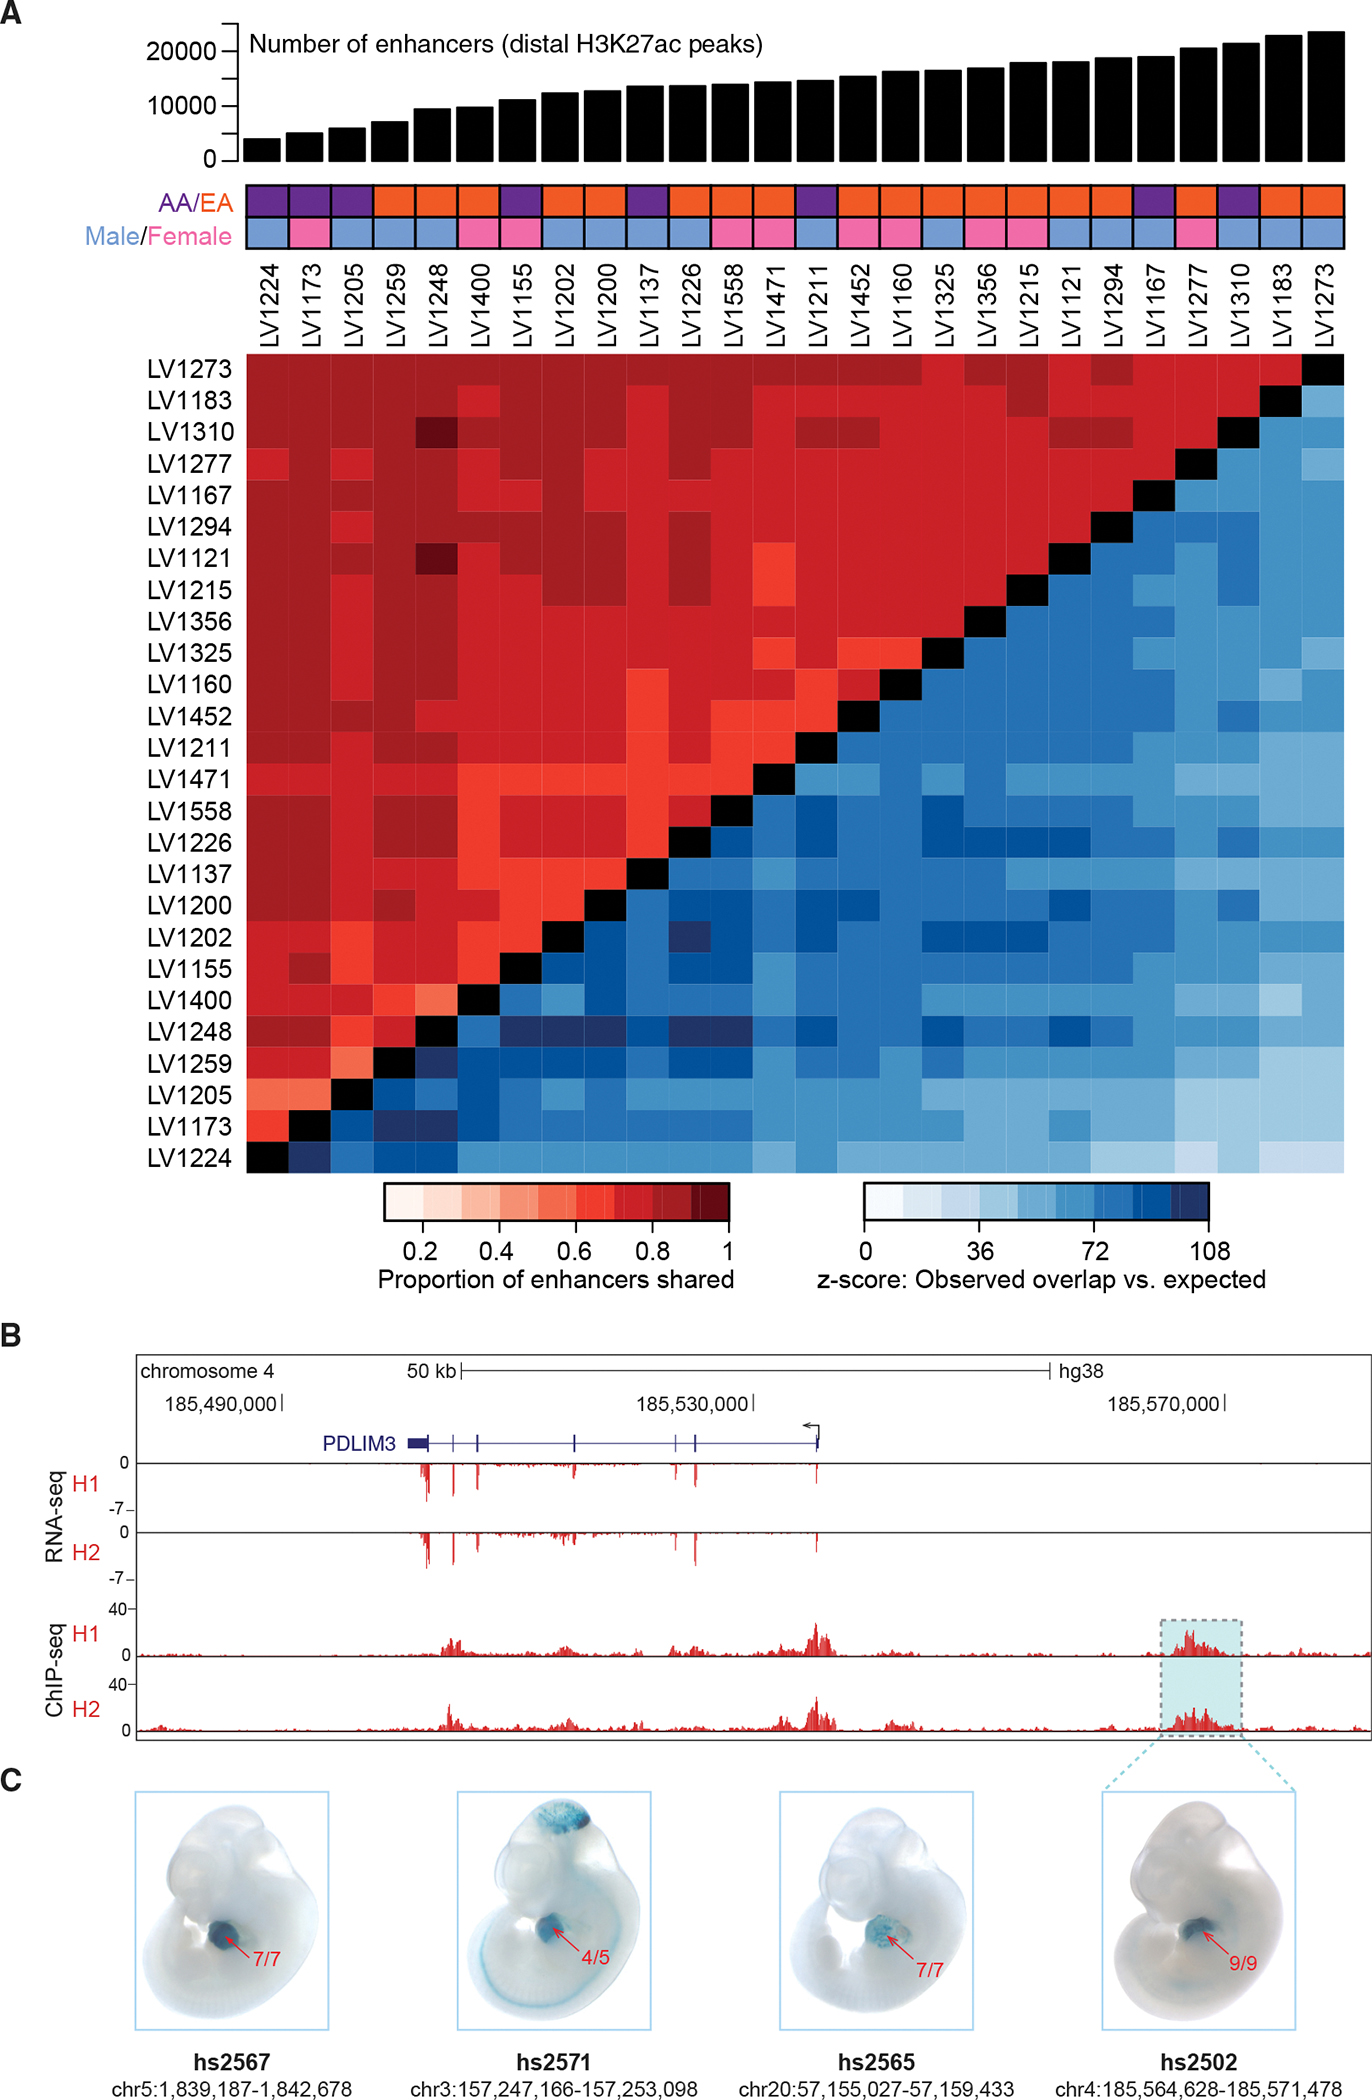
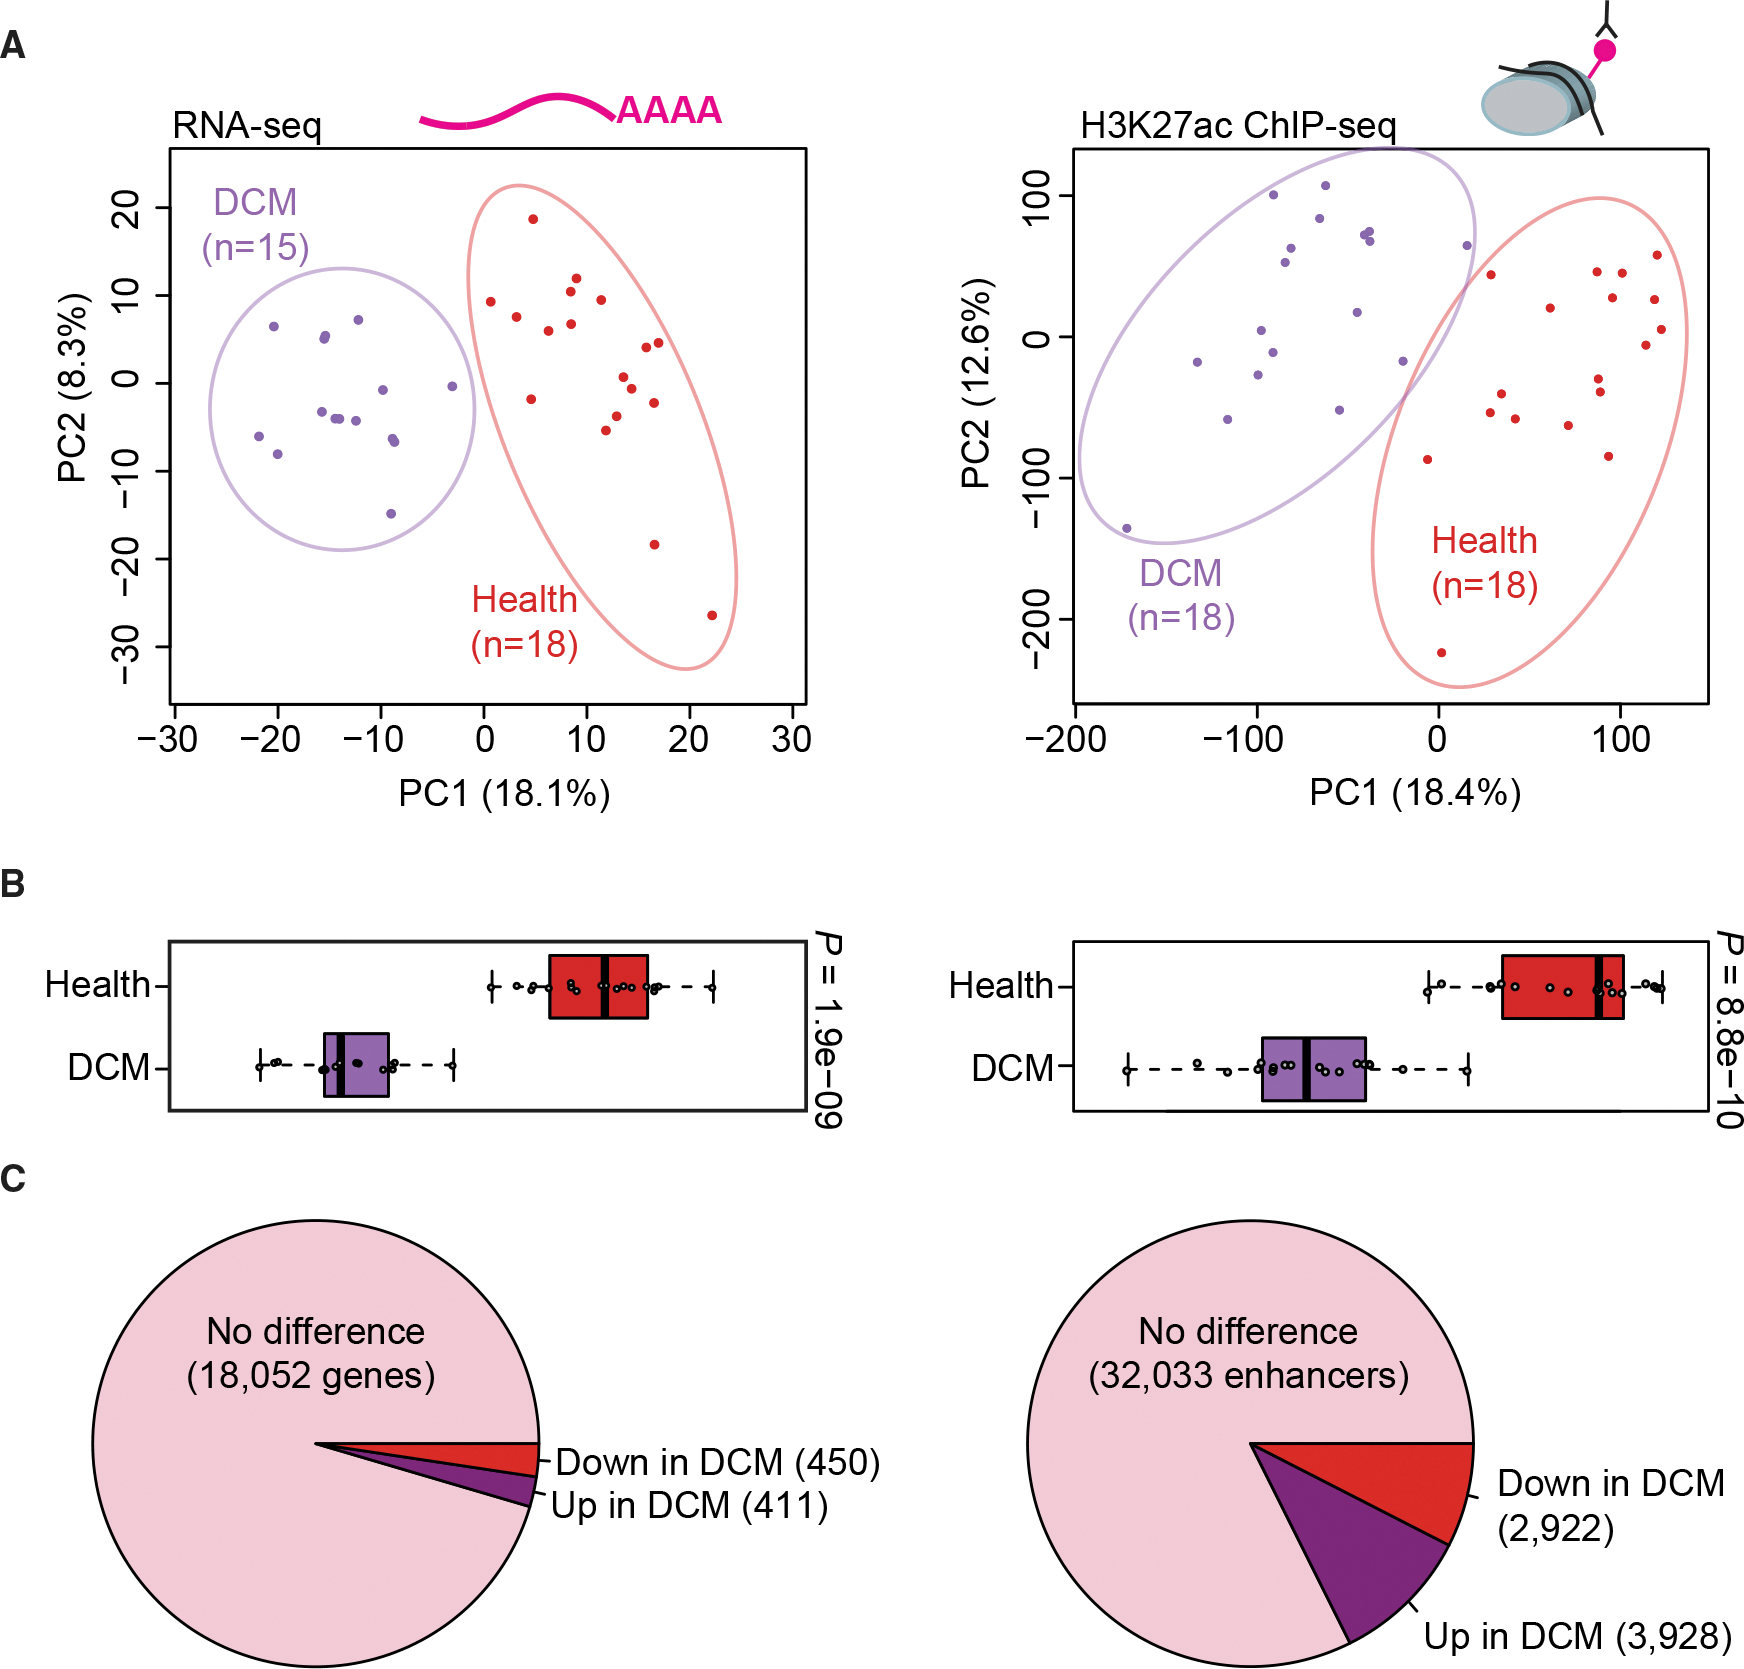
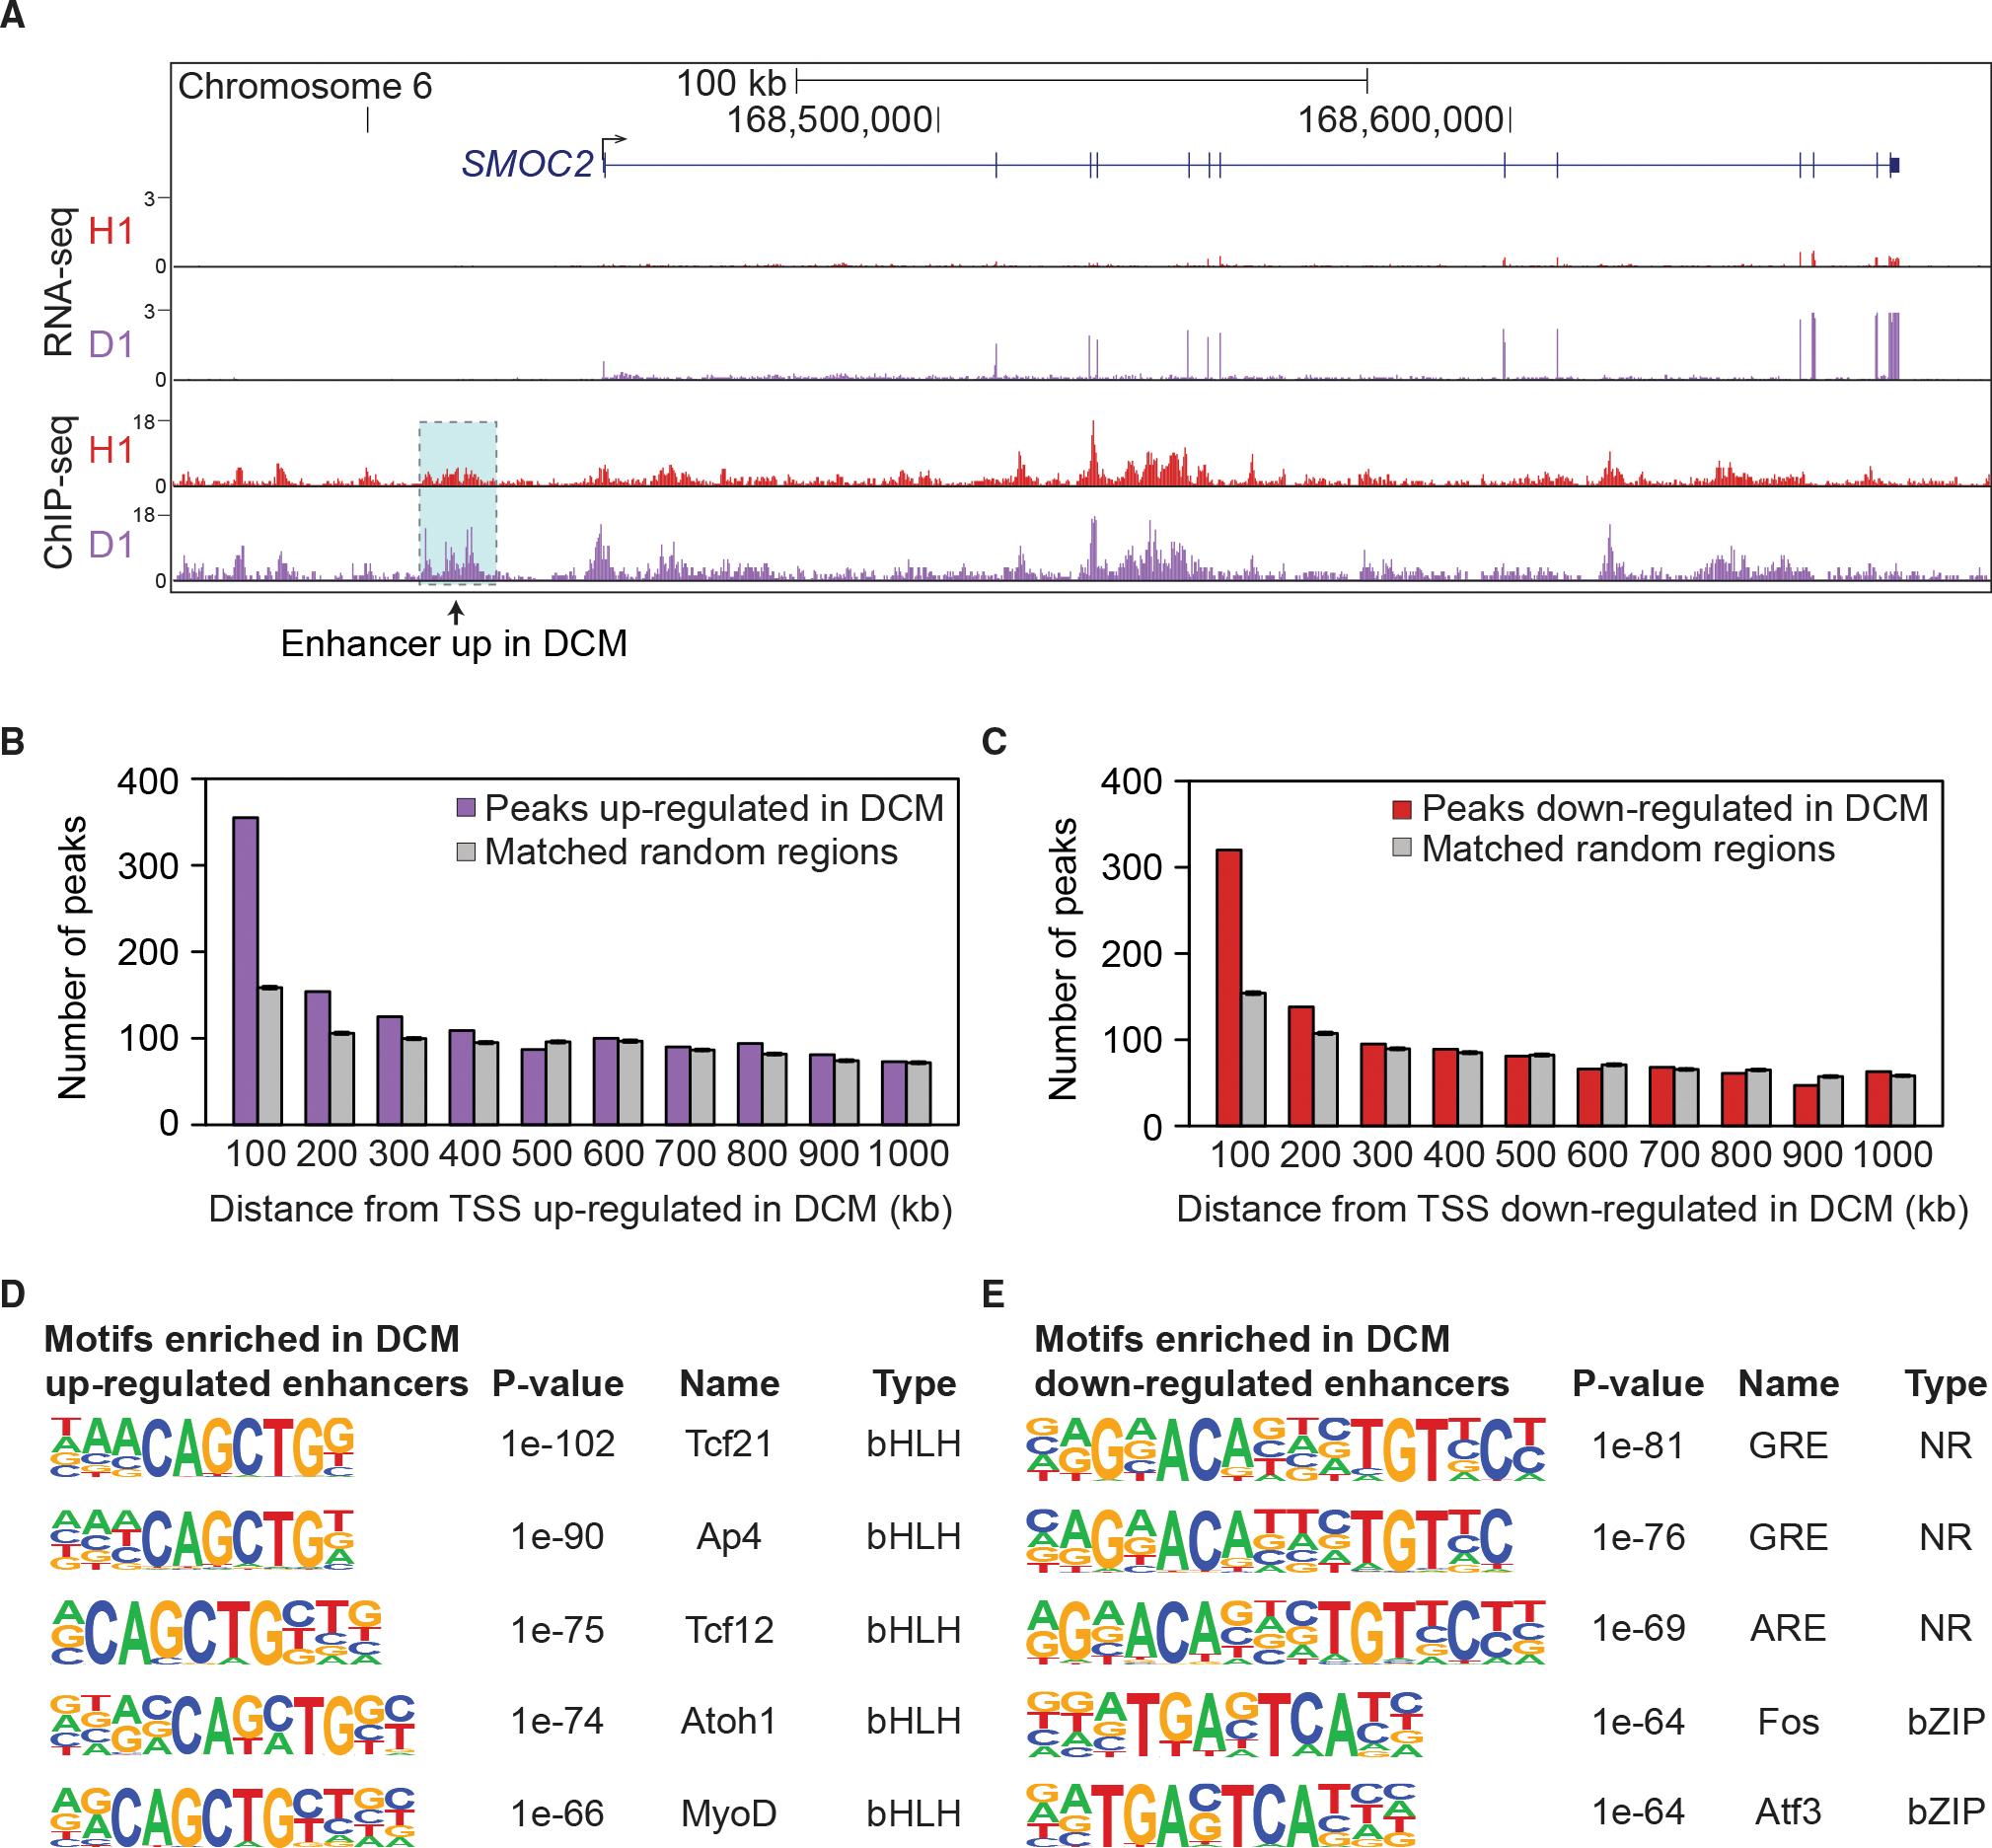
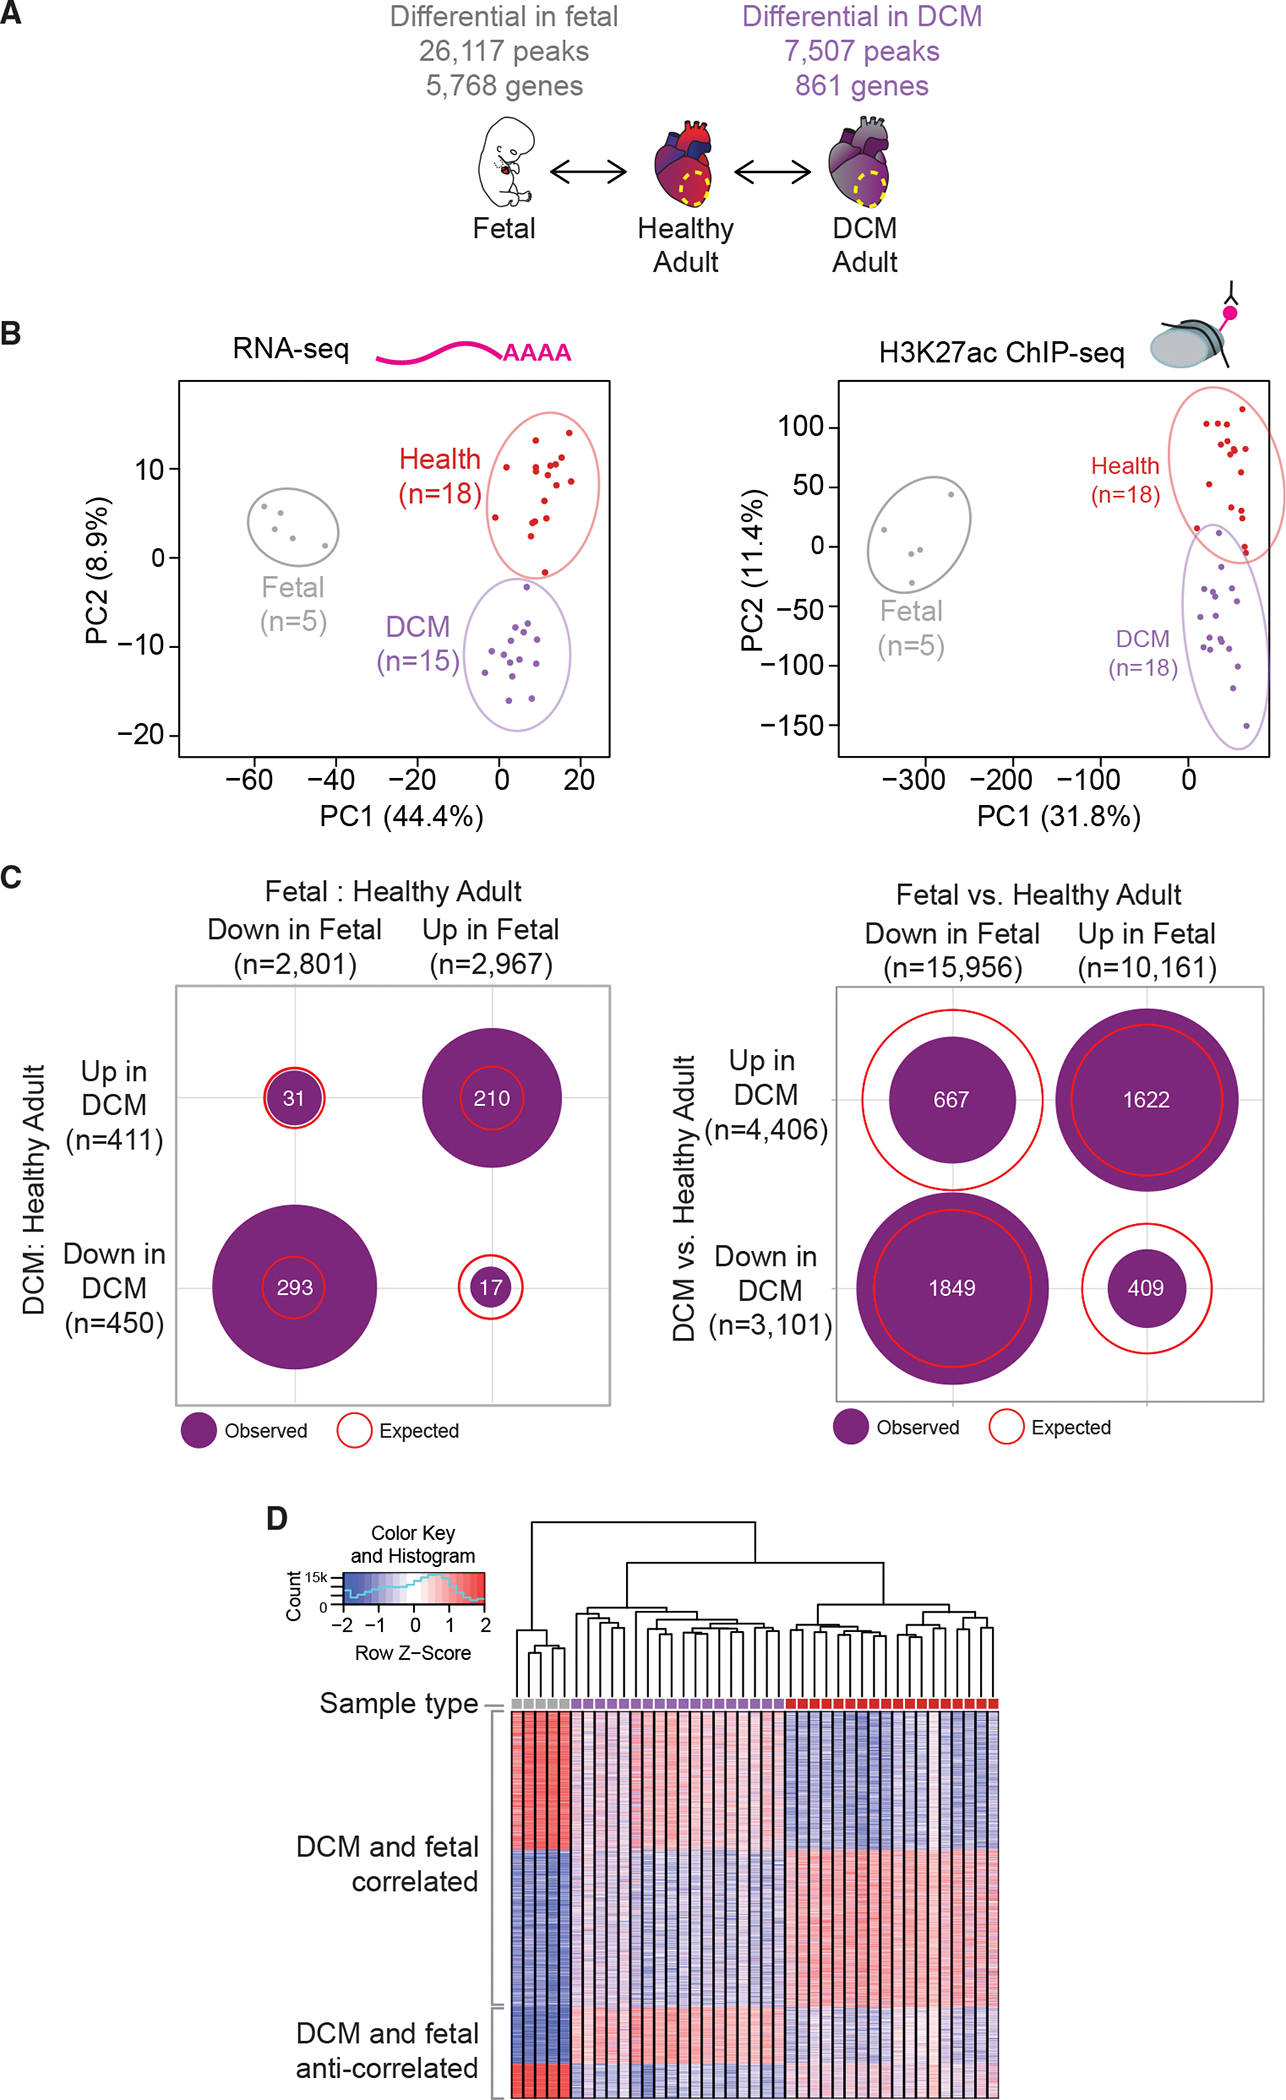
Heart disease is associated with re-expression of key transcription factors normally active only during prenatal development of the heart. However, the impact of this reactivation on the regulatory landscape in heart disease is unclear. Here, we use RNA-seq and ChIP-seq targeting a histone modification associated with active transcriptional enhancers to generate genome-wide enhancer maps from left ventricle tissue from up to 26 healthy controls, 18 individuals with idiopathic dilated cardiomyopathy (DCM), and five fetal hearts. Healthy individuals have a highly reproducible epigenomic landscape, consisting of more than 33,000 predicted heart enhancers. In contrast, we observe reproducible disease-associated changes in activity at 6,850 predicted heart enhancers. Combined analysis of adult and fetal samples reveals that the heart disease epigenome and transcriptome both acquire fetal-like characteristics, with 3,400 individual enhancers sharing fetal regulatory properties. We also provide a comprehensive data resource (http://heart.lbl.gov) for the mechanistic exploration of DCM etiology.

Keywords: CP: Molecular biology; RNA-seq; enhancers; fetalization; genomics; hIP-seq; heart disease; regulatory elements; transgenic assay.


Conflict of interest statement

Declaration of interests The authors declare no competing interests.

Figures

Figure 1.
Figure 1.. Overview of this study
We performed RNA-seq and ChIP-seq on left ventricle samples from 18 healthy donors. We identified reproducible enhancer predictions and gene expression patterns in healthy heart (top). Next, we identified global alterations in enhancer occupancy from 18 hearts with idiopathic dilated cardiomyopathy (DCM, center). Last, we compared adult healthy and disease states with five embryonic or fetal hearts and identified similarities in the enhancer landscapes of DCM and fetal heart (bottom).
Figure 2.
Figure 2.. The cardiac enhancer landscape is highly reproducible across individuals
(A) Top: number of predicted enhancers per sample for 26 healthy left ventricle samples. Middle: demographic information for each subject (AA, African American; EA, European American). Bottom: Heatmap showing the proportion of peaks shared between samples (red tones in top left), along with z-scores indicating how many standard deviations the observed number of shared peaks exceeded random expectation (blue tones in bottom right, see STAR Methods). (B) Paired RNA-seq and ChIP-seq tracks from two samples, H1 and H2, at the PDLIM3 locus. (C) Transgenic mouse assay validation of four heart enhancers, including one upstream of PDLIM3 (see Figure S2 for results for additional predicted heart enhancers). One representative embryonic day 11.5 embryo is shown for each enhancer, and numbers in red show the reproducibility of heart staining in each transgenic experiment. Information underneath each embryo includes the identification number in the VISTA Enhancer Browser (Visel et al., 2007) (enhancer.lbl. gov) and the human genome coordinates (hg38) of each tested enhancer. Embryos have an average crown-rump length of 6 mm.
Figure 3.
Figure 3.. Extensive reprogramming of the epigenomic architecture in heart disease
(A) Principal-component analysis showing the first two principal components (PC1 and PC2) for the top 1,000 variably expressed genes from RNA-seq (left) and for distal enhancer peaks from ChIP-seq (right). Each point indicates a unique sample, color coded by cohort. (B) Boxplots showing PC1 for each sample by cohort (left: RNA-seq, right: ChIP-seq). Boxplots indicate median and quartile values for each data set; points indicate individual samples. PC1 separates disease state in both RNA-seq and ChIP-seq data (p values by two-sided Mann-Whitney U test). (C) Pie charts showing the proportion of unchanged versus differentially expressed genes (left) and differentially bound enhancer peaks (right) relative to each cohort (see STAR Methods for details).
Figure 4.
Figure 4.. Differentially bound distal enhancers associated with heart failure-specific gene expression changes
(A) Co-occurrence of increased expression of SMOC2 (by RNA-seq) and increased H3K27ac at a nearby enhancer (by ChIP-seq) in DCM. Shown are data from a representative healthy (H1) and DCM (D1) sample. (B) Distal ChIP-seq peaks relative to their distance from transcription start sites (TSS) of genes upregulated in DCM, divided into 100-kb bins. Purple: distal peaks upregulated in DCM. Gray: An equal-size, random subset of regions matched to all heart ChIP-seq peaks was assessed. The average across 200 sets of randomized control elements is shown. (C) Same analysis as in (B), but for genes with decreased expression in DCM and distal peaks downregulated in DCM (red). An equal-size, random subset of regions matched to all heart ChIP-seq peaks was assessed (gray). (D and E) Transcription factor binding sites enriched in peaks upregulated (D) and downregulated (E) in DCM (Heinz et al., 2010). p values by HOMER.
Figure 5.
Figure 5.. Fetalization is a driver of regulatory change in heart disease
(A) Schematic of experimental comparisons and number of differential genes/peaks. (B) Principal-component analysis showing the first two principal components (PC1 and PC2) for the top 1,000 variably expressed genes from RNA-seq (left) and for distal enhancer peaks from ChIP-seq (right). Prenatal samples are gray, DCM samples are purple, and healthy samples are red. (C) Number of enhancer peaks co-regulated in prenatal and DCM states for RNA-seq (left) and ChIP-seq (right). Purple circles show number of peaks overlapping in each quadrant. Red lines show expected overlap between each category. (D) Heat map showing all differential peaks between 41 samples: 5 prenatal (gray), 18 DCM (purple), and 18 healthy (red).

References

    1. Alvira CM (2014). Nuclear factor-kappa-B signaling in lung development and disease: one pathway, numerous functions. Birth Defects Res. A Clin. Mol. Teratol. 700, 202–216. 10.1002/bdra.23233. - DOI - PMC - PubMed
    1. Azhar M, Schultz JEJ, Grupp I, Dorn GW, Meneton P, Molin DGM, Gittenberger-de Groot AC, Doetschman T, and Doetschman T (2003). Transforming growth factor beta in cardiovascular development and function. Cytokine Growth Factor Rev. 14, 391–407. 10.1016/s1359-6101(03)00044-3. - DOI - PMC - PubMed
    1. Barth AS, Kuner R, Buness A, Ruschhaupt M, Merk S, Zwermann L, Kääb S, Kreuzer E, Steinbeck G, Mansmann U, et al. (2006). Identification of a common gene expression signature in dilated cardiomyopathy across independent microarray studies. J. Am. Coll. Cardiol. 48, 1610–1617. 10.1016/j.jacc.2006.07.026. - DOI - PubMed
    1. Berger RD, Kasper EK, Baughman KL, Marban E, Calkins H, and Tomaselli GF (1997). Beat-to-beat QT interval variability: novel evidence for repolarization lability in ischemic and nonischemic dilated cardiomyopathy. Circulation 96, 1557–1565. 10.1161/01.cir.96.5.1557. - DOI - PubMed
    1. Bernstein BE, Stamatoyannopoulos JA, Costello JF, Ren B, Milosavljevic A, Meissner A, Kellis M, Marra MA, Beaudet AL, Ecker JR, et al. (2010). The NIH roadmap epigenomics mapping consortium. Nat. Biotechnol. 28, 1045–1048. 10.1038/nbt1010-1045. - DOI - PMC - PubMed

Publication types

Substances