. 2022 Sep 20;40(12):111384.
doi: 10.1016/j.celrep.2022.111384.

Circulating monocytes associated with anti-PD-1 resistance in human biliary cancer induce T cell paralysis

Affiliations

Circulating monocytes associated with anti-PD-1 resistance in human biliary cancer induce T cell paralysis

Bridget P Keenan et al. Cell Rep. .

Abstract

Suppressive myeloid cells can contribute to immunotherapy resistance, but their role in response to checkpoint inhibition (CPI) in anti-PD-1 refractory cancers, such as biliary tract cancer (BTC), remains elusive. We use multiplexed single-cell transcriptomic and epitope sequencing to profile greater than 200,000 peripheral blood mononuclear cells from advanced BTC patients (n = 9) and matched healthy donors (n = 8). Following anti-PD-1 treatment, CD14+ monocytes expressing high levels of immunosuppressive cytokines and chemotactic molecules (CD14CTX) increase in the circulation of patients with BTC tumors that are CPI resistant. CD14CTX can directly suppress CD4+ T cells and induce SOCS3 expression in CD4+ T cells, rendering them functionally unresponsive. The CD14CTX gene signature associates with worse survival in patients with BTC as well as in other anti-PD-1 refractory cancers. These results demonstrate that monocytes arising after anti-PD-1 treatment can induce T cell paralysis as a distinct mode of tumor-mediated immunosuppression leading to CPI resistance.

Trial registration: ClinicalTrials.gov NCT02703714.

Keywords: CP: Cancer; biliary tract cancer; checkpoint inhibitors; cholangiocarcinoma; immunotherapy; monocytes; myeloid cells.


Conflict of interest statement

Declaration of interests L.F. has received research support (to institution) from Abbvie, Amgen, Bavarian Nordic, Bristol Myers Squibb, Dendreon, Janssen, Merck, Roche/Genentech, and Partner Therapeutics. L.F. has received compensation for serving on the scientific advisory boards (to self) for Actym, Alector, Astra Zeneca, Atreca, Bioatla, Bolt, Bristol Myers Squibb, Immunogenesis, Merck, Merck KGA, Nutcracker, RAPT, Scribe, Senti, Soteria, TeneoBio, and Roche/Genentech. C.J.Y. is a co-founder of Dropprint Genomics, is a Scientific Advisory Board member for and holds equity in Related Sciences and ImmunAI, is a consultant for and holds equity in Maze Therapeutics, is a consultant for TReX Bio, and has received research funding from Genentech. B.K. has received research support (to institution) from Partner Therapeutics. R.K.K. has received research support (to institution) from Agios, Astra Zeneca, Bayer, BMS, Eli Lilly, EMD Serono, Exelixis, Genentech/Roche, Merck, Novartis, Partner Therapeutics, QED, Relay Therapeutics, and Taiho. R.K.K. has received compensation for consulting or IDMC membership from Exact Sciences, Genentech/Roche, and Gilead (to self) and from Agios, Astra Zeneca, BMS, and Merck (to institution).

Figures
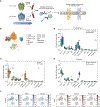
Figure 1.
Figure 1.. Analysis of circulating immune cells within healthy individuals and BTC patients
(A) Schematic of experimental design. (B) Uniform manifold approximation and projection (UMAP) plot of all cells from BTC patient and healthy donor blood samples colored by cell type. NK/NKT cluster contains T cells, NK T cells, and NK cells; cDC = conventional dendritic cells; mono = monocytes; pDC = plasmacytoid dendritic cells. (C–E) Percent of each cell type out of total immune cells in BTC patients (prior to treatment, n = 9) and healthy donors (n = 8) (C) and in responders (n = 4) and non-responders (n = 5) prior to treatment (D), and 3 weeks following anti-PD-1 (E). * denotes significance (adjusted p < 0.05). Boxes denote inter-quartile range (IQR), while bars denote 25% – 1.5 3 IQR and 75% + 1.5xIQR. (F) UMAP of all immune cells colored by protein and RNA expression for PD-1 (PDCD1), PD-L1 (CD274), and PD-L2 (PDCD1LG2).
Figure 2.
Figure 2.. Circulating myeloid populations within BTC patients and healthy responders
(A) UMAP colored by myeloid cell subtype. cDC = conventional dendritic cells; mono = monocytes; pDC = plasmacytoid dendritic cells. (B) UMAP of myeloid cells showing expression of each protein or RNA molecule used to annotate myeloid subtypes. (C) Heatmap with expression of genes in the top enriched pathways (right labels) for each monocyte subtype. (D) UMAP of RNA expression of the indicated gene across all myeloid cells. (E) Percent of each cell subtype out of total myeloid cells in BTC patients (prior to treatment, n = 9) and healthy donors (n = 8). * denotes significance (adjusted p < 0.05); *** denotes adjusted p value < 0.001. Boxes denote inter-quartile range (IQR), while bars denote 25% – 1.5xIQR and 75% + 1.5xIQR.
Figure 3.
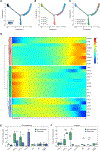
Figure 3.. Monocyte subtypes associated with anti-PD-1 response
(A–C) Trajectory analysis of monocyte subtypes from BTC patients and healthy donors. Cells are ordered in latent time (A) with monocyte subtype (B) or response status (C) overlaid. (D) Heatmap of differentially expressed genes, arranged by clusters of patterns of gene expression across latent time (direction shown by arrow). (E and F) Percent of each cell subtype out of total myeloid cells in BTC responders (n = 4) and non-responders (n = 5) prior to treatment (E) and 3 weeks following anti-PD-1 (F). * denotes significance (adjusted p < 0.05); ** denotes adjusted p value < 0.005; *** denotes adjusted p value < 0.001. Boxes denote inter-quartile range (IQR) while bars denote 25% – 1.5xIQR and 75% + 1.5xIQR.
Figure 4.
Figure 4.. Monocyte gene signatures associated with poor prognosis in CPI-insensitive cancer types
(A) Volcano plot of log2(fold change) and –log10(p value) showing differently expressed genes between CD14CTX and CD14APC. (B) Expression of suppressive chemokines and cytokines associated with MDSC and M2 macrophages is shown for CD14CTX and CD14APC. (C) Protein (top panel) and RNA (bottom panel) expression overlaid on UMAP of myeloid cells for HAVCR2 (Tim3) and ITGB1 (CD29, integrin-α1) and for the combination of both genes/proteins. (D) Bar plots of each myeloid population gated on CD68 and calculated as percentage of total CD45+ circulating immune cells as analyzed by flow cytometry of peripheral blood samples from healthy donors (‘‘Healthy,’’ n = 7) or BTC patients (n = 8). * = p < 0.05, error bars denote standard deviation. (E–G) Kaplan-Meier curve of overall survival for cholangiocarcinoma (E) and colon cancer (F), and disease-free survival for prostate cancer (G) cases in the TCGA dataset by high (red line: median expression greater than composite score [CS]) or low (dashed line: median expression lower than CS) expression of the CD14CTX gene signature. (H and I) Kaplan-Meier curve of progression-free survival for renal cell carcinoma (H) and melanoma (I) patients treated with PD-1 blockade inhibition by high (red) or low (black) expression of the CD14CTX gene signature. For (E)–(I), the y axis is in months, and the numbers below the plots denote number of individuals at risk. NR = not reached, CI = confidence interval, OS = overall survival, DFS = disease-free survival, PFS = progression-free survival.
Figure 5.
Figure 5.. CD14CTX are associated with SOCS3+CD4+ T cells and can induce CD4+ T cell suppression
(A) UMAP of all T cells in healthy donors and BTC patients colored by cell annotations. (B) Heatmap of Pearson correlation coefficients for cell type frequencies for myeloid and T cell subtypes. (C) The frequency of the specified cell type out of total myeloid or T cells was calculated and then correlated as shown in each plot. Each dot corresponds to an individual patient sample. (D) Schematic of co-culture conditions. The monocyte populations indicated were cultured with healthy T cells for 6 days and re-stimulated with anti-CD3/CD28 beads for 3 days prior to harvest. (E) CFSE staining is shown for representative CD4+ and CD8+ populations (left panel). Data are summarized in bar plots as the percentage of CD4+ and CD8+ T cells that remain undivided following re-stimulation in each co-culture condition (right panel, n = 3–6 wells per condition). Stim = stimulated. (F) Flow cytometry assessment for percentage SOCS3+ out of healthy donor (HD) CD4+ T cells co-cultured with the indicated monocyte population (n = 2–3 wells per condition). (G) Flow cytometry assessment for percentage SOCS3+ out of HD CD4+ T cells alone (n = 3 replicates) or co-cultured with plasma from HD (n = 3) or BTC patients (n = 18).

References

    1. Akkari L, Gocheva V, Kester JC, Hunter KE, Quick ML, Sevenich L, Wang HW, Peters C, Tang LH, Klimstra DS, et al. (2014). Distinct functions of macrophage-derived and cancer cell-derived cathepsin Z combine to promote tumor malignancy via interactions with the extracellular matrix. Genes Dev. 28, 2134–2150. 10.1101/gad.249599.114. - DOI - PMC - PubMed
    1. Ammon C, Meyer SP, Schwarzfischer L, Krause SW, Andreesen R, and Kreutz M (2000). Comparative analysis of integrin expression on monocyte-derived macrophages and monocyte-derived dendritic cells. Immunology 100, 364–369. 10.1046/j.1365-2567.2000.00056.x. - DOI - PMC - PubMed
    1. Antonarakis ES, Piulats JM, Gross-Goupil M, Goh J, Ojamaa K, Hoimes CJ, Vaishampayan U, Berger R, Sezer A, Alanko T, et al. (2020). Pembrolizumab for treatment-refractory metastatic castration-resistant prostate cancer: multicohort, open-label phase II KEYNOTE-199 study. J. Clin. Oncol. 38, 395–405. 10.1200/JCO.19.01638. - DOI - PMC - PubMed
    1. Ashburner M, Ball CA, Blake JA, Botstein D, Butler H, Cherry JM, Davis AP, Dolinski K, Dwight SS, Eppig JT, et al. (2000). Gene ontology: tool for the unification of biology. The Gene Ontology Consortium. Nat. Genet. 25, 25–29. 10.1038/75556. - DOI - PMC - PubMed
    1. Betjes MG, Haks MC, Tuk CW, and Beelen RH (1991). Monoclonal antibody EBM11 (anti-CD68) discriminates between dendritic cells and macrophages after short-term culture. Immunobiology 183, 79–87. 10.1016/S0171-2985(11)80187-7. - DOI - PubMed

Publication types

Associated data