. 2022 Sep 20;40(12):111405.
doi: 10.1016/j.celrep.2022.111405.

ATP hydrolysis tunes specificity of a AAA+ protease

Affiliations

ATP hydrolysis tunes specificity of a AAA+ protease

Samar A Mahmoud et al. Cell Rep. .

Abstract

In bacteria, AAA+ proteases such as Lon and ClpXP degrade substrates with exquisite specificity. These machines capture the energy of ATP hydrolysis to power unfolding and degradation of target substrates. Here, we show that a mutation in the ATP binding site of ClpX shifts protease specificity to promote degradation of normally Lon-restricted substrates. However, this ClpX mutant is worse at degrading ClpXP targets, suggesting an optimal balance in substrate preference for a given protease that is easy to alter. In vitro, wild-type ClpXP also degrades Lon-restricted substrates more readily when ATP levels are reduced, similar to the shifted specificity of mutant ClpXP, which has altered ATP hydrolysis kinetics. Based on these results, we suggest that the rates of ATP hydrolysis not only power substrate unfolding and degradation, but also tune protease specificity. We consider various models for this effect based on emerging structures of AAA+ machines showing conformationally distinct states.

Keywords: AAA+ protease; ATP dependent proteases; CP: Molecular biology; Caulobacter; ClpX; ClpXP; Lon.


Conflict of interest statement

Declaration of interests The authors declare no competing interests.

Figures
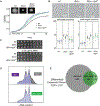
Figure 1.
Figure 1.. clpX* mutant suppresses Δlon phenotypes
(A) Growth curves of wild-type (wt), Δlon, and Δlon clpX* cells grown in PYE. Biological triplicate experiments are shown. Error bars represent 95% confidence interval. Inset shows motility assays as measured by growth in 0.3% PYE agar. (B) Representative phase-contrast microscopy images of wt, Δlon, and Δlon clpX* cells grown in PYE during exponential phase. Quantification of cell length and stalk length for three biological replicates of n = 100 cells. Error bars represent the standard deviation. (C) Serial dilution assays comparing colony formation of strains in PYE and PYE supplemented with MMC. Spots are plated 10-fold dilutions of exponentially growing cells from left to right. (D) Flow cytometry profiles showing chromosome content of indicated strains after 3-hour treatment with rifampicin. Cells were stained with SYTOX Green to measure DNA content. The fluorescent intensities corresponding with one chromosome (1) and two chromosomes (2) are indicated. Experiment was performed two times. Representative data from one of the biological replicates is shown here. (E) Venn diagram summarizing the number of differentially expressed genes with a false discovery rate (FDR) cutoff less than 0.01 from RNA-seq performed with stationary phase cells. Venn diagram created by BioVenn (Hulsen, de Vlieg and Alkema, 2008). See also Figure S1 and Data S1.
Figure 2.
Figure 2.. clpX* mutant restores levels of Lon substrates through degradation
(A) Lon degrades DnaA, SciP, and CcrM in C. crescentus (Wright et al., 1996; Gora et al., 2013; Jonas et al., 2013). (B) Western blot showing DnaA and CcrM levels in wt, Δlon, and Δlon clpX* cells. Lysates from an equal number of exponential phase cells were probed with anti-DnaA or anti-CcrM antibody. ClpP was used as a loading control. A representative image and quantifications of triplicate experiments are shown. Line represents the mean. (C) Antibiotic shutoff assays to monitor DnaA and CcrM stabilities in wt, Δlon, and Δlon clpX* cells. Chloramphenicol was added to stop synthesis and lysates from samples at the indicated time points were used for western blot analysis. Quantifications of triplicate experiments with substrate shown relative to ClpP control levels are shown to the right. Error bars represent the standard deviation. (D) Western blot showing SciP levels in synchronized populations of wt, Δlon, and Δlon clpX* cells. Swarmer cells were isolated using a density gradient and an equal number of cells were released into fresh PYE medium. Samples were withdrawn at the indicated time points and probed with anti-SciP. (E) DnaA stability is measured in Δlon strains expressing an extra copy of wild-type clpX or clpX*. Experiment was performed four times. Representative data from one of the biological replicates is shown here. Quantifications of experiments shown to the right. Error bars represent the standard deviation. See also Figure S2.
Figure 3.
Figure 3.. ClpX*P degrades some Lon substrates faster than ClpXP in vitro
(A) In vitro degradation of DnaA, SciP, or CcrM. Assays were performed with 0.1 μM ClpX6 or ClpX6*, and 0.2 μM ClpP14. Substrate concentrations were 1 μM DnaA, 5 μM SciP, 0.5 μM CcrM. Quantification of triplicate experiments shown. Error bars represent the standard deviation. (B) In vitro fluorescence degradation assay of FITC-casein in the presence of ClpXP or ClpX*P or Lon. Degradation assays were performed with 10 μg/mL FITC-Casein, 0.1 μM ClpX6 or ClpX6*, and 0.2 μM ClpP14 or 0.1 μM Lon6. Serial dilution assays comparing colony formation of strains in PYE and PYE supplemented with L-canavanine. Spots are plated 10-fold dilutions of exponentially growing cells from left to right. See also Figure S3.
Figure 4.
Figure 4.. ClpX* mutant is deficient in degradation of native ClpXP substrates
(A) Michaelis-Menten plot showing the rate of degradation as a function of GFP-ssrA concentration by ClpXP and ClpX*P. The inset displays kinetic parameters. Assays were performed with 0.1 μM ClpX6 or ClpX*6, 0.2 μM ClpP14, ATP regeneration system, and the indicated concentrations of GFP-ssrA. Data were fitted to the Michaelis-Menten equation. Triplicate experiments are shown. Error bars represent the standard deviation. (B) In vitro degradation assay of His-CtrA in the presence of ClpXP or ClpX*P. Degradation assays were performed with 3 μM His-CtrA, 0.1 μM ClpX6 or ClpX*6, 0.2 μM ClpP14, and ATP regeneration system. Quantification of duplicate experiments is shown below. Error bars represent the standard deviation. (C) In vivo degradation assay showing eGFP-ssrA (DAS), DnaA, and CtrA stability in wild-type (WT) and clpX* cells. The plasmid encoded M2FLAG-eGFP-ssrA (DAS) construct was induced with the addition of 0.2% xylose. Chloramphenicol was used to inhibit protein synthesis. Samples were withdrawn at the indicated time points and quenched in SDS lysis buffer. Lysate from an equal number of cells was used for western blot analysis and probed with anti-M2, or anti-CtrA, and anti-DnaA antibody. Quantification of triplicate experiments is shown below. Error bars represent the standard deviation. (D) Competition assay with wild-type cells harboring xylX:Plac-venus (constitutive venus expression) and nonfluorescent WT or clpX* strains. exponential phase cells were mixed 1:1, diluted, and allowed to outgrow for 12 doublings. Quantification of triplicate experiments is shown below. Error bars represent the standard deviation. (E) Serial dilution assays comparing colony formation of WT and clpX* cells in PYE and PYE supplemented with MMC. Spots are plated 10-fold dilutions of exponentially growing cells from left to right. See also Figure S4.
Figure 5.
Figure 5.. Limiting ATP alters wild-type ClpXP substrate specificity
(A) Michaelis-Menten plot showing the rate of ClpX/ClpX* catalyzed ATP hydrolysis as a function of ATP concentration. Inset displays kinetic parameters. Assays were performed with 0.1 μM ClpX6 or ClpX*6, in the presence and absence of 0.2 μM ClpP14. Data were fitted to the Michaelis-Menten equation. Triplicate experiments are shown. Error bars represent the standard deviation. (B) FITC-casein degradation by ClpXP or ClpX*P as a function of ATP concentration. Assays were performed with 0.1 μM ClpX6 or ClpX*6, 0.2 μM ClpP14, ATP regeneration system, and 50 μg/mL FITC-casein. Rates were normalized to highest concentration of ATP. Non-normalized rates shown in the inset. Error bars represent the standard deviation. (C) Michaelis-Menten plot showing the rate of degradation as a function of FITC-casein concentration by ClpXP under low and saturating ATP conditions. The inset displays kinetic parameters. Assays were performed with 0.1 μM ClpX6, 0.2 μM ClpP14, and ATP regeneration system. Data were fitted to the Michaelis-Menten equation. Triplicate experiments are shown. Error bars represent the standard deviation. (D) In vitro degradation of DnaA by ClpXP under low and saturating ATP conditions. Assays were performed with 0.1 μM ClpX6, and 0.2 μM ClpP14 and 0.5 μM DnaA. Quantification of triplicate experiments. (E) Antibiotic shutoff assays to monitor DnaA under ATP limiting conditions in WT and Δlon ΔclpA strains. Chloramphenicol was added to stop synthesis and lysates from samples at the indicated time points were used for western blot analysis. Quantifications of triplicate experiments shown to the right. Error bars represent the standard deviation. See also Figure S5.
Figure 6.
Figure 6.. ClpX adopts distinct ATP-dependent conformational states
(A) Limited proteolysis assay to probe conformational states. ClpX was incubated with chymotrypsin with either 12 μM ATP or 4 mM ATP in the presence of ClpP and ATP regeneration system at 25°C for the indicated time points. ClpX* was incubated with chymotrypsin at 4 mM ATP in the presence of ClpP and ATP regeneration system at 25°C for the indicated time points. ClpX was detected using anti-ClpX antibodies. (B) Stability of ClpX* with 4 mM ATP, ClpX with 4 mM ATP, and ClpX with 12 μM ATP as measured by DSF. Triplicate experiments shown. (C) Woods plot comparing deuterium uptake for wild-type ClpX vs ClpX* at 4 mM ATP after 60 min. Each bar on the Woods plot represents a single peptide with a peptide length corresponding with the bar length. Red bars indicate a deprotected (more deuterium uptake) region, blue represents a protected region, and gray bars are not significantly different. Woods plots were created with Deuteros (Lau et al., 2021) using the peptide significance test (p < 0.01). Residues 186–200 are highlighted in red for the equivalent residues in the substrate-bound E. coli ClpX structure (PDB: 6PO1) using PYMOL (Schrodinger). (D) In a wild-type cell, AAA+ proteases Lon and ClpXP promote normal growth by degrading distinct substrates. ClpX*P can compensate for the absence of the Lon protease by tuning ClpX substrate specificity to better degrade Lon-restricted substrates (such as DnaA, SciP, and misfolded proteins), but this comes at the cost of native ClpXP substrates (such as ssrA-tagged proteins and CtrA). In ATP-limited conditions, wild-type ClpXP can undergo a similar switch in substrate specificity to ClpX*P, gaining the ability to better degrade DnaA, SciP, and misfolded proteins than the wild-type enzyme at saturating ATP. See also Figure S6.

References

    1. Baker TA, and Sauer RT (2012). ClpXP, an ATP-powered unfolding and protein-degradation machine. Biochim. Biophys. Acta 1823, 15–28. - PMC - PubMed
    1. Bhat NH, Vass RH, Stoddard PR, Shin DK, and Chien P (2013). Identification of ClpP substrates in Caulobacter crescentus reveals a role for regulated proteolysis in bacterial development. Mol. Microbiol. 88, 1083–1092. - PMC - PubMed
    1. Breidenstein EBM, Janot L, Strehmel J, Fernandez L, Taylor PK, Kukavica-Ibrulj I, Gellatly SL, Levesque RC, Overhage J, and Hancock REW (2012). The lon protease is essential for full virulence in Pseudomonas aeruginosa. PLoS One 7, e49123. - PMC - PubMed
    1. Burton RE, Baker TA, and Sauer RT (2003). Energy-dependent degradation: linkage between ClpX-catalyzed nucleotide hydrolysis and protein-substrate processing. Protein Sci. 12, 893–902. - PMC - PubMed
    1. Chen YE, Tsokos CG, Biondi EG, Perchuk BS, and Laub MT (2009). Dynamics of two phosphorelays controlling cell cycle progression in Caulobacter crescentus. J. Bacteriol. 191, 7417–7429. - PMC - PubMed

Publication types

MeSH terms

Substances

LinkOut - more resources