. 2022 Sep 20;40(12):111371.
doi: 10.1016/j.celrep.2022.111371.

Thymidine rescues ATR kinase inhibitor-induced deoxyuridine contamination in genomic DNA, cell death, and interferon-α/β expression

Affiliations

Thymidine rescues ATR kinase inhibitor-induced deoxyuridine contamination in genomic DNA, cell death, and interferon-α/β expression

Norie Sugitani et al. Cell Rep. .

Abstract

ATR kinase is a central regulator of the DNA damage response (DDR) and cell cycle checkpoints. ATR kinase inhibitors (ATRi's) combine with radiation to generate CD8+ T cell-dependent responses in mouse models of cancer. We show that ATRi's induce cyclin-dependent kinase 1 (CDK1)-dependent origin firing across active replicons in CD8+ T cells activated ex vivo while simultaneously decreasing the activity of rate-limiting enzymes for nucleotide biosynthesis. These pleiotropic effects of ATRi induce deoxyuridine (dU) contamination in genomic DNA, R loops, RNA-DNA polymerase collisions, and interferon-α/β (IFN-α/β). Remarkably, thymidine rescues ATRi-induced dU contamination and partially rescues death and IFN-α/β expression in proliferating CD8+ T cells. Thymidine also partially rescues ATRi-induced cancer cell death. We propose that ATRi-induced dU contamination contributes to dose-limiting leukocytopenia and inflammation in the clinic and CD8+ T cell-dependent anti-tumor responses in mouse models. We conclude that ATR is essential to limit dU contamination in genomic DNA and IFN-α/β expression.

Keywords: ATR/origin firing/deoxyuridine contamination/IFN-α/β; CP: Cancer; CP: Immunology.


Conflict of interest statement

Declarations of interests The authors declare no competing interests.

Figures
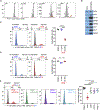
Figure 1.
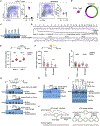
Figure 1.. ATRi induces death in activated and proliferating CD8+ T cells ex vivo
(A) Proliferation of Pmel-1 CD8+ T cells activated with gp100 ex vivo. CTV histograms of live, CD44hi CD8+ T cells at indicated times post-activation are shown. Red histograms are un-activated CD8+ T cells that have largely died. The number of divisions is shown. (B) Immunoblots of CD8+ T whole-cell extracts prepared the same number of cells at 0 and 30 h post-activation. (C) CD8+ T cells were activated and treated with 5 μM AZD6738 (ATRi) from 0 to 24 h (blue) or 24 to 48 h (red). At 48 h, live CD8+ T cells (eFluor 780CD8+TCRβ+) were quantitated. (D) Unactivated CD8+ T cells were maintained in IL-7 and treated with ATRi from 0 to 24 or 24 to 48 h. At 48 h, live CD8+ T cells were quantitated. (E) CD8+ T cells were activated and treated with ATRi, 500 nM AZD0156 (ATMi), 5 μM olaparib (PARPi), or 500 nM AZD1775 (WEE1i) from 24 to 48 h. At 48 h, live CD8+ T cells were quantitated. (A and B) Two biological replicates. (C and D) Three biological replicates. (E) Two biological replicates; three technical replicates. (C–E) Mean and SD bars are shown. *p < 0.05, **p < 0.01, ****p < 0.0001, by ANOVA with Tukey’s multiple comparisons.
Figure 2.
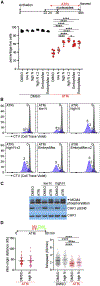
Figure 2.. ATRi induces death in proliferating CD8+ T cells in vivo
(A–D) Tissues were harvested on day 4 from CT26 tumor-bearing mice treated with 75 mg/kg AZD6738 (ATRi) or vehicle on days 1–3 and immunoprofiled. (A) Quantitation of TIL CD8+ T cells (per mg of tumor) and spleen and tumor-draining lymph node (DLN) CD8+ T cells (percentage of total CD45+ cells). (B) Representative contour plots of Ki67+ expression in CD8+ T cells in the TILs, spleen, and DLNs. (C) Quantitation of proliferating (Ki67+) CD8+ T cells in the TILs, spleen, and DLNs. (D) Quantitation of CD69+ CD8+ T cells in the TILs, spleen, and DLNs. (A–D) n = 7 mice (biological replicates) total (six DLNs for ATRi) from two independent experiments, each with 3–4 mice per arm. (A, C, and D) Mean and SD bars are shown. *p < 0.05, **p < 0.01, ****p < 0.0001, by two-tailed, unpaired t test.
Figure 3.
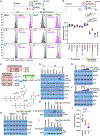
Figure 3.. ATR kinase limits origin firing across active replicons in proliferating CD8+ T cells
(A) EdU versus DNA plots of CD8+ T cells and fibroblasts. The percentage of cells in each cell cycle phase and the doubling time were used to estimate the length of G1, S, and G2/M. (B) The circumference of the circle represents the doubling time, and the lengths of G1, S, and G2/M are drawn to scale. (C) Immunoblot of MCM4 in the chromatin fraction prepared from CD8+ T cells treated with 5 μM AZD6738 (ATRi), 500 nM AZD0156 (ATMi), 5 μM olaparib (PARPi), or 500 nM AZD1775 (WEE1i) for 1 h. (D) Repli-seq analyses of the replication timing program of CD8+ T cells treated with ATRi (red) or DMSO (blue) for 1 h. Upper: whole genome. Lower: chromosome 1. Data were deposited at GEO: GSE183412. (E) EdU incorporation in early (2N–3N) and late (3N–4N) S phase in CD8+ T cells treated with ATRi for 1 h. 10 μM EdU was added from 30 to 60 min. (F) DNA combing analyses of CD8+ T cells and fibroblasts treated with ATRi for 1 h. Cells were treated with IdU from 30 to 40 min and CldU from 40 to 60 min of the treatment. (G) Immunoblots of MCM4 in the chromatin fraction prepared from CD8+ T cells treated with increasing concentrations of Ro-3306 (CDK1i), CVT-313 (CDK2i), or PHA-767491 (CDC7i) for 75 min. Cells were treated with ATRi from 15 to 75 min. (H) Immunoblot of RIF1 phosphoserine-2153 in whole-cell extracts prepared from CD8+ T cells treated with Ro-3306 for 75 min. Cells were treated with five ATRi’s from 15 to 75 min. (I) Immunoblot of MCM4 in chromatin fraction and CDC25A in the soluble fraction prepared from CD8+ T cells treated with ATRi and/or 5 mM HU in the sequence indicated. (J) Cartoon of a model in which ATR limits origin firing across active replicons. Green circles indicate origins that fired, and red circles indicate origins that have not fired. (A) CD8+ T cells: 12 biological replicates, 1–5 technical replicates; fibroblasts: 7 biological replicates, 1–2 technical replicates. (E) 10 biological replicates. (F) Left panel, CD8+ T cells DMSO: n = 179 fibers from 4 biological replicates, CD8+ T cells ATRi: n = 203 fibers from 3 biological replicates, fibroblasts DMSO: n = 30 fibers from 2 biological replicates, fibroblasts ATRi: n = 28 fibers from 2 biological replicates. Right panel, CD8+ T cells DMSO: n = 675 fibers from 5 biological replicates, CD8+ T cells ATRi: n = 520 fibers from 4 biological replicates, fibroblasts DMSO: n = 226 fibers from 2 biological replicates, fibroblasts ATRi: n = 219 fibers from 2 biological replicates. (C and G–I) Two biological replicates. (E and F) Mean and SD bars are shown. **p < 0.01, ***p < 0.001, ****p < 0.0001 by two-tailed, unpaired t test.
Figure 4.
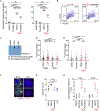
Figure 4.. Nucleosides rescue proliferating CD8+ T cells from ATRi-induced cell death
(A) CD8+ T cells were treated with nucleoside cocktails at 22 h and 5 μM AZD6738 (ATRi) at 24 h and for ×2 nucleoside cocktails at 22 and 30 h. At 48 h, live CD8+ T cells (eFluor 780CD8+TCRβ+) were quantitated. Low N: 250 nM A, C, G, and T. High N: 15 μM A, C, and G and 6 μM dT. EmbryoMax: 15 μM A, C, G, and U and 6 μM dT. (B) CTV histograms of live (eFluor 780CD44hiCD8+) cells at 24 (gray) or 48 h (blue) treated with nucleosides and ATRi as described in (A). Number of divisions is indicated. (C) Immunoblot of MCM4 in the chromatin fraction and CHK1 and GAPDH in the soluble fraction prepared from CD8+ T cells treated with low N or high N for 2 h prior to ATRi for 1 h. (D) DNA combing analyses of CD8+ T cells treated with high N for 2 h prior to ATRi for 1 h. Cells were treated with IdU from 30 to 40 min and CldU from 40 to 60 min during the treatment with ATRi. (A and B) Two biological replicates; three technical replicates. (C) Two biological replicates. (D) Left panel, DMSO: n = 33 fibers, high N: n = 39 fibers. Right panel, DMSO/DMSO: n = 257 fibers, DMSO/high N: n = 187 fibers, ATRi/DMSO: n = 224 fibers, ATRi/high N: n = 217 fibers from two biological replicates. (A and D) Mean and SD bars are shown. Right panels: *p < 0.05, ****p < 0.0001, by one-way ANOVA with Tukey’s multiple comparisons. Left panel: not significant by two-tailed, unpaired t test.
Figure 5.
Figure 5.. Thymidine rescues ATRi-induced cell death
(A) CD8+ T cells were treated with either 15 μM A, C, and G or 6 μM dT, or high N at 22 h and 5 μM AZD6738 (ATRi) at 24 h. At 48 h, live CD8+ T cells (eFluor 780CD8+TCRβ+) were quantitated. (B) CTV histograms of live (eFluor 780CD44hiCD8+) cells at 24 (gray) or 48 h (color) treated with nucleosides and ATRi as described in (A). Number of divisions is indicated. (C) CT26 cells were treated with 6 μM dT and 5 or 10 μM AZD6738 (ATRi) for 72 h, and cell viability was determined using CellTiter-Glo. (D and E) B16 cells were treated with 6 μM dT and 10 μM AZD6738 (ATRi) for (D) 72 or (E) 96 h, and cell viability was determined using CellTiter-Glo. (A and B) Three biological replicates; two technical replicates. (C and D) Two biological replicates; five technical replicates. (E) Three biological replicates; five technical replicates. (A and C–E) Mean and SD bars are shown. (A) **p < 0.01, ***p < 0.001, ****p < 0.0001, by one-way ANOVA with Tukey’s multiple comparisons. (C–E) Data from two (C and D) or three (E) independent experiments, each with five biological replicates. **p < 0.01, ****p < 0.0001, by one-way ANOVA with Sidak’s multiple comparisons (bars shown for all comparisons tested). ns, not significant.
Figure 6.
Figure 6.. ATRi induces degradation of RRM2 and dCK in proliferating CD8+ T cells
(A) CD8+ T cells were treated with 6 μM T at 22 h and either 5 mM AZD6738 (ATRi) or 5 mM HU at 24 h. At 30 h, cells were re-plated with and without 6 μM dT in the absence of ATRi and HU. CTV histograms of live (eFluor 780CD44hiCD8+) cells at 24 h (gray), and 30 and 48 h (with recovery) for ATRi- and HU-treated (6 h) samples (DMSO-treated histograms in black; thymidine-treated histograms in pink). Number of divisions is indicated. (B) CD8+ T cells were activated and treated with 6 μM T at 22 h and either ATRi or HU at 24 h. At 33 h, cells were re-plated with and without 6 μM T. At 48 h, live CD8+ T cells (eFluor 780CD8+TCRβ+) were quantitated. (C) Nucleotide metabolism. (D–G) Immunoblots of proliferating CD8+ T whole-cell extracts. (D) CD8+ T cells were treated with ATRi and HU for 1 or 4 h. (E) CD8+ T cells were treated with increasing concentrations of Ro-3306 (CDK1i) for 15 min followed by ATRi for 1 h. (F) CD8+ T cells were treated with increasing concentrations of CVT-313 (CDK2i) for 15 min followed by ATRi for 1 h. (G) CD8+ T cells were treated with 5 mM MG132 (protease inhibitor) and 5 mM Ro-3306 (CDK1i) for 15 min prior to ATRi for 2 h. (H and I) Whole-cell extracts were prepared from CD8+ T cells treated with ATRi and CDK1i for 1 h. (H) Proteins immunopurified with anti-pSPXK antibodies were immunoblotted for RRM2. (I) Proteins immunopurified with anti-pSQ antibody were immunoblotted for dCK. (J) Quantitation of cellular dUTP in proliferating CD8+ T cells treated with DMSO, ATRi, or HU. (A and B) Two biological replicates; two technical replicates. (D–I) Two biological replicates. (J) Two biological replicates; six technical replicates. (B and J) Mean and SD bars are shown. (B) **p < 0.01, ****p < 0.0001, by one-way ANOVA with Tukey’s multiple comparisons. (J) *p < 0.05, ****p < 0.0001, by one-way ANOVA with Dunnett’s multiple comparisons.
Figure 7.
Figure 7.. ATRi-induces genome instability in proliferating CD8+ T cells
(A) Quantitation of γH2AX-positive CD8+ T cells treated with 6 μM dT for 2 h followed by 5 μM AZD6738 (ATRi) for 2 or 4 h. (B) γH2AX versus DNA content plots of CD8+ T cells treated with dT for 2 h followed by ATRi for 2 h. (C) CD8+ T cells were treated with 10 μM camptothecin (TOP1i) or ATRi for 1 h. Genomic DNA was prepared and digested with restriction endonucleases, +/− RNase H. DNA fragments were immunopurified with anti-RNA-DNA hybrid antibody (S9.6). Purified DNA was dentured and blotted using an anti-single-stranded DNA antibody. (D–F) Proximity ligation assay (PLA) of PCNA and RNA Pol II pS5 in CD8+ T cells. 10 μM EdU was added during the last 15 min of the 30-min ATRi treatment. (D) Quantitation of PLA foci per nucleus in S phase (EdU+) and non-S phase (EdU) CD8+ T cells treated with ATRi for 30 min. (E) Quantitation of PLA foci per nucleus in CD8+ T cells treated with dT for 2 h and then ATRi for 30 min. (F) Representative images of PLA in CD8+ T cells treated with ATRi for 30 min. (G) Quantitation of dU contamination in genomic DNA prepared from CD8+ T cells treated with ATRi for 1 h, dT for 2 h followed by ATRi for 1 h, or 5 mM HU for 1 h. (H) Quantitation of changes in IFN-α and IFN-β gene expression (ΔΔCt) in CD8+ T cells treated with ATRi and dT for 24 h. Each data point represents the expression change for a given biological replicate, averaged from two technical replicates. (A and B) Two biological replicates; three technical replicates. (C) Three biological replicates. (D) EdU+ DMSO: n = 1551 foci, EdU+ ATRi: n = 1463 foci, EdU DMSO: n = 457 fcci, EdU ATRi: n = 527 foci from five biological replicates; one to three technical replicates. (E) DMSO: n = 385 foci, DMSO + dT: n = 411 foci, ATRi: n = 467 foci, ATRi + dT: n = 387 foci from two biological replicates. (G) Two biological replicates; three technical replicates. (H) Two biological replicates; two technical replicates. (A, D, E, G, and H) Mean and SD bars are shown. (A, D, and E) *p < 0.05, ***p < 0.001, ****p < 0.0001, by one-way ANOVA with Tukey’s multiple comparisons. (G) *p < 0.05, by one-way ANOVA with Holm-Sidak’s multiple comparisons for DMSO versus ATRi, DMSO versus HU, ATRi versus HU, and ATRi versus ATRi + dT.

References

    1. Aird KM, Zhang G, Li H, Tu Z, Bitler BG, Garipov A, Wu H, Wei Z, Wagner SN, Herlyn M, and Zhang R (2013). Suppression of nucleotide metabolism underlies the establishment and maintenance of oncogene-induced senescence. Cell Rep. 3, 1252–1265. 10.1016/j.cel-rep.2013.03.004. - DOI - PMC - PubMed
    1. Beyaert M, Starczewska E, Pérez ACG, Vanlangendonck N, Saussoy P, Tilman G, De Leener A, Vekemans MC, Van Den Neste E, and Bontemps F (2017). Reevaluation of ATR signaling in primary resting chronic lymphocytic leukemia cells: evidence for pro-survival or pro-apoptotic function. Oncotarget 8, 56906–56920. 10.18632/oncotarget.18144. - DOI - PMC - PubMed
    1. Beyaert M, Starczewska E, Van Den Neste E, and Bontemps F (2016). A crucial role for ATR in the regulation of deoxycytidine kinase activity. Biochem. Pharmacol 100, 40–50. 10.1016/j.bcp.2015.11.022. - DOI - PubMed
    1. Bjursell G, and Reichard P (1973). Effects of thymidine on deoxyribonucleoside triphosphate pools and deoxyribonucleic acid synthesis in Chinese hamster ovary cells. J. Biol. Chem 248, 3904–3909. - PubMed
    1. Brown EJ, and Baltimore D (2000). ATR disruption leads to chromosomal fragmentation and early embryonic lethality. Genes Dev. 14, 397–402. - PMC - PubMed

Publication types