. 2022 Nov 16;110(22):3789-3804.e9.
doi: 10.1016/j.neuron.2022.08.022. Epub 2022 Sep 20.

Striatal dopamine explains novelty-induced behavioral dynamics and individual variability in threat prediction

Affiliations

Striatal dopamine explains novelty-induced behavioral dynamics and individual variability in threat prediction

Korleki Akiti et al. Neuron. .

Abstract

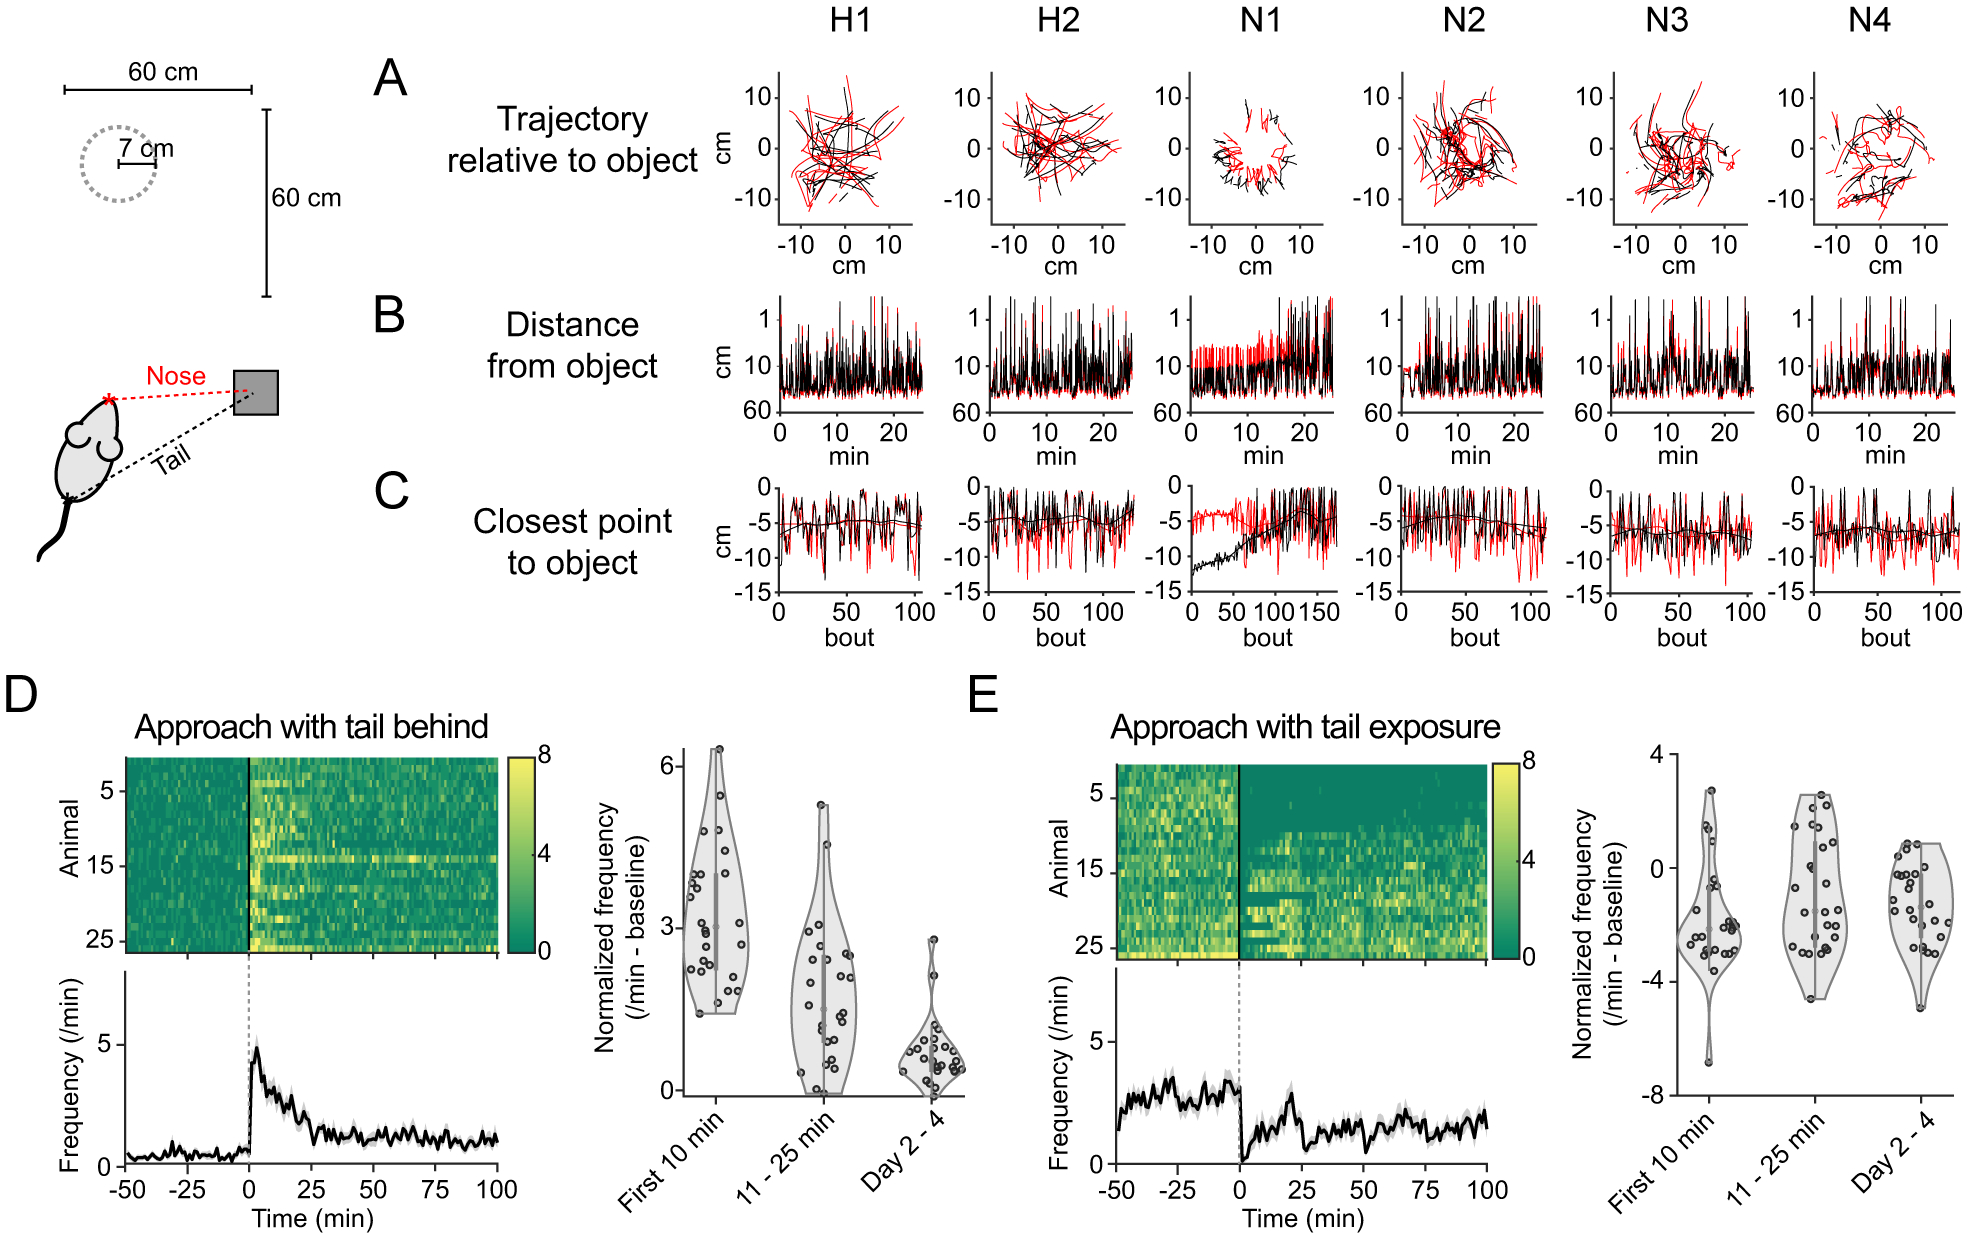
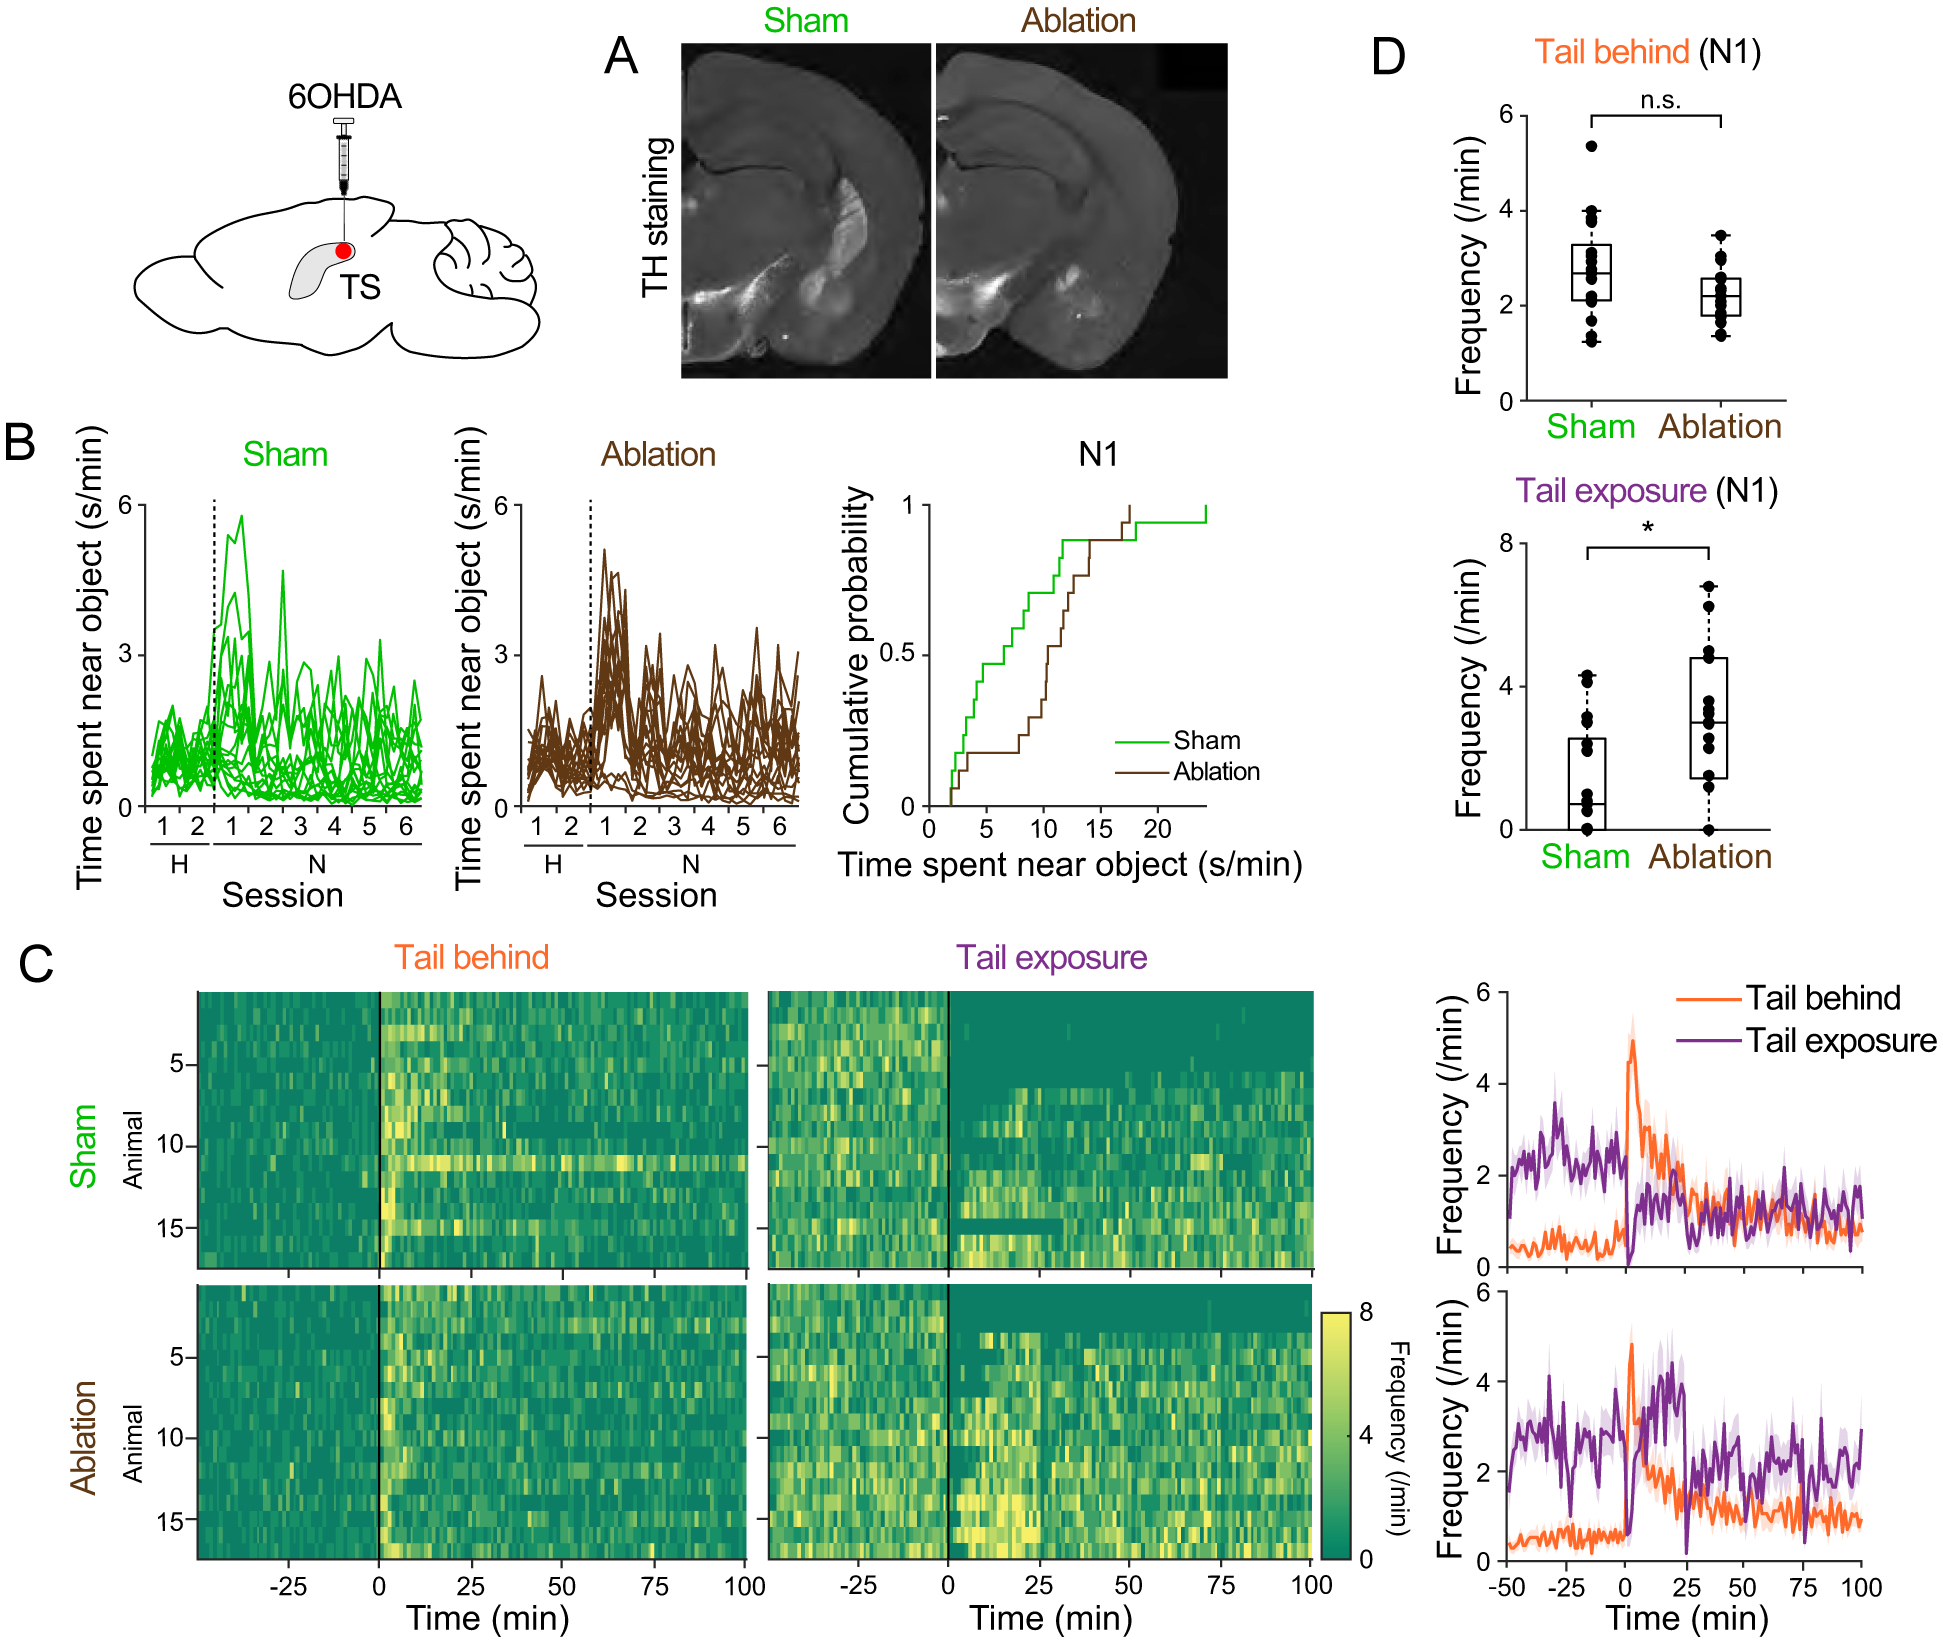
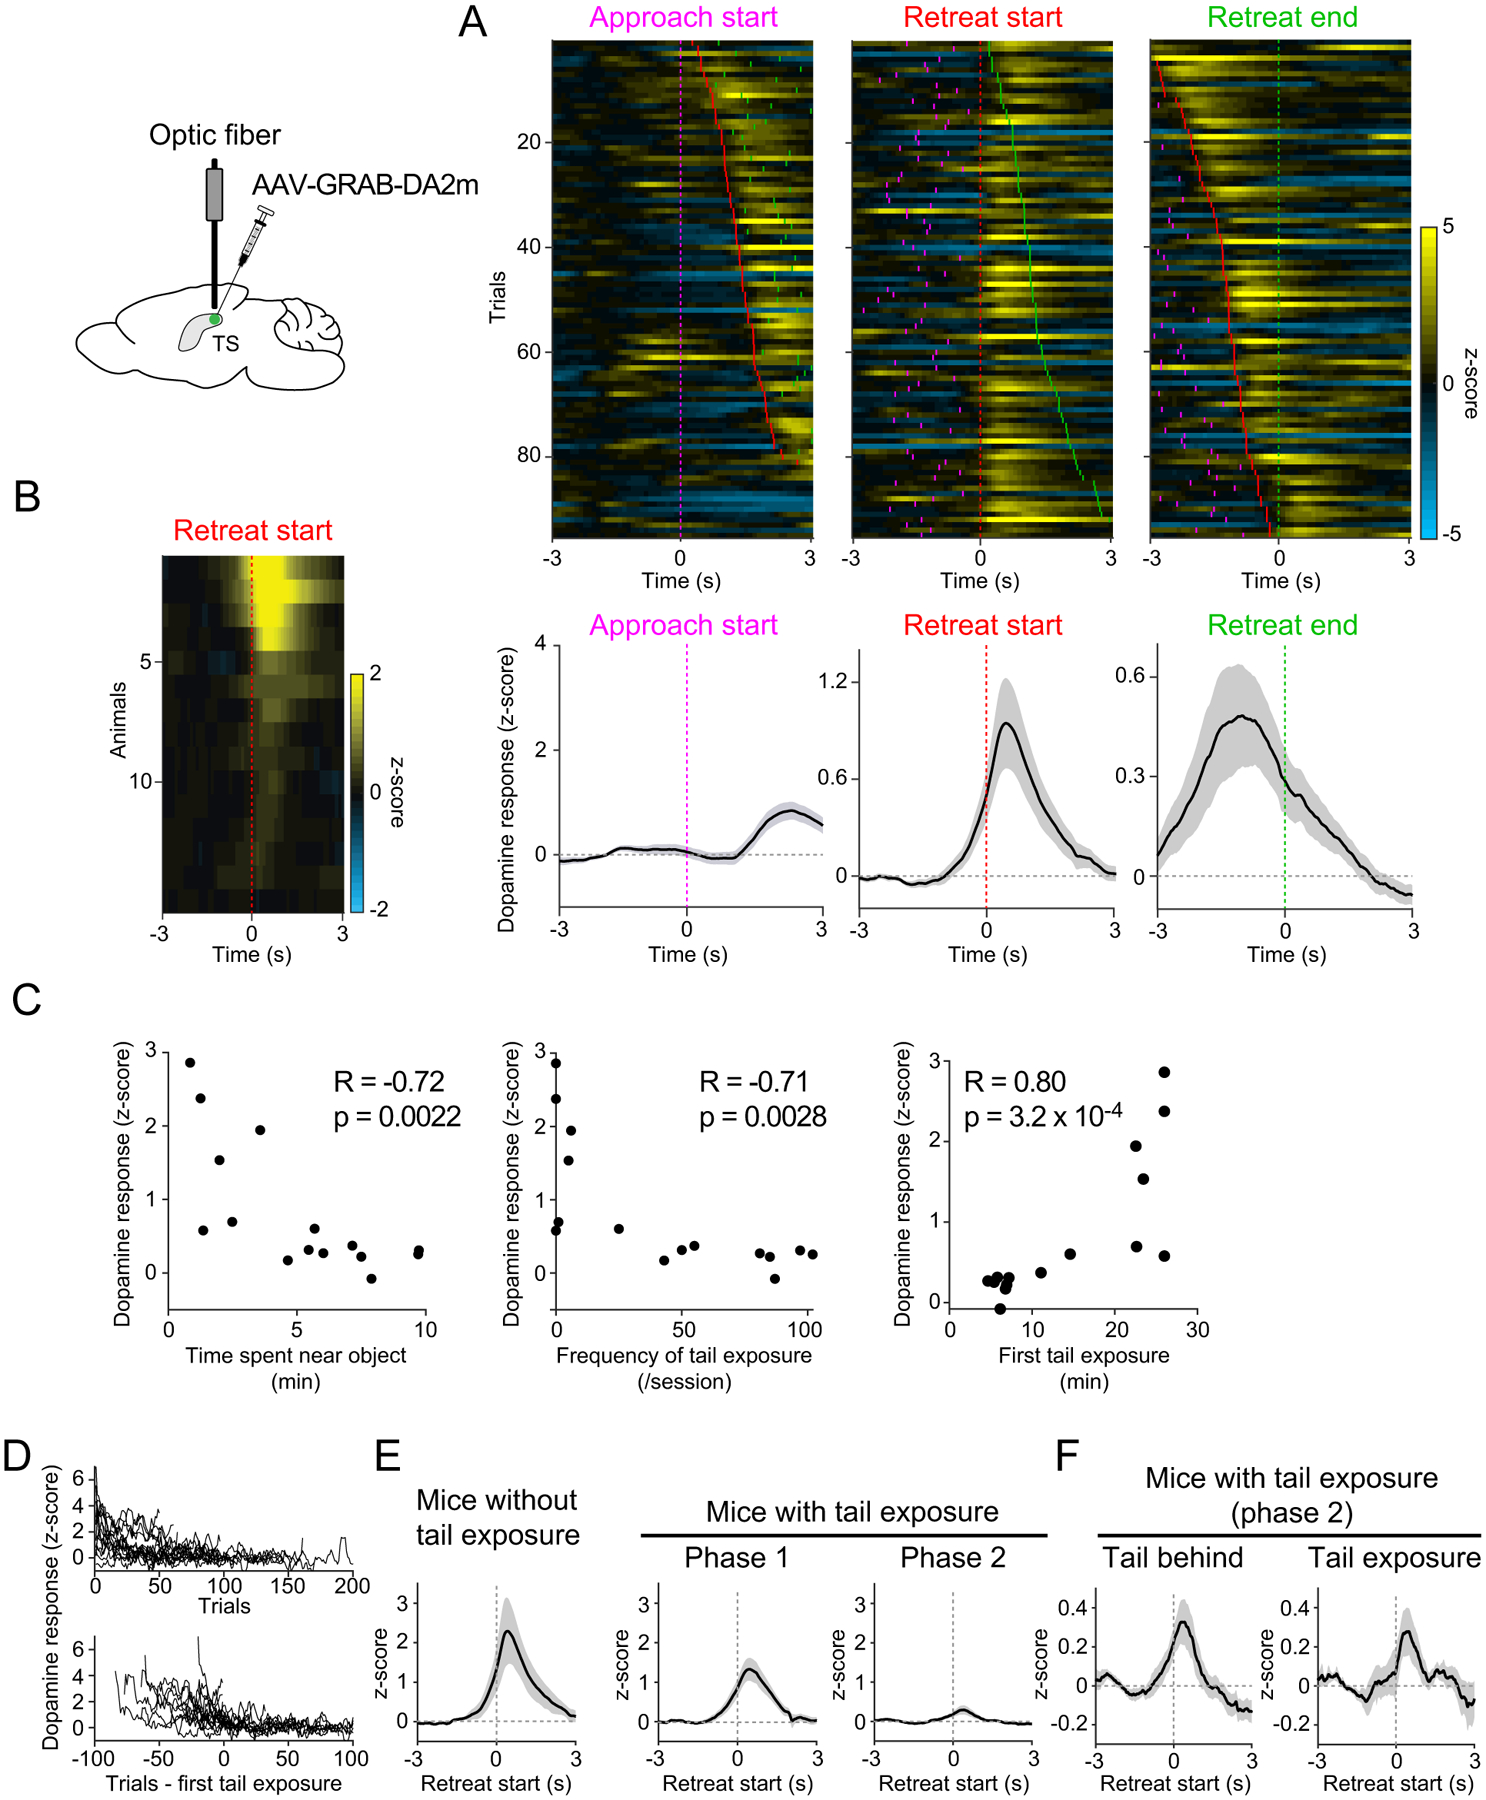
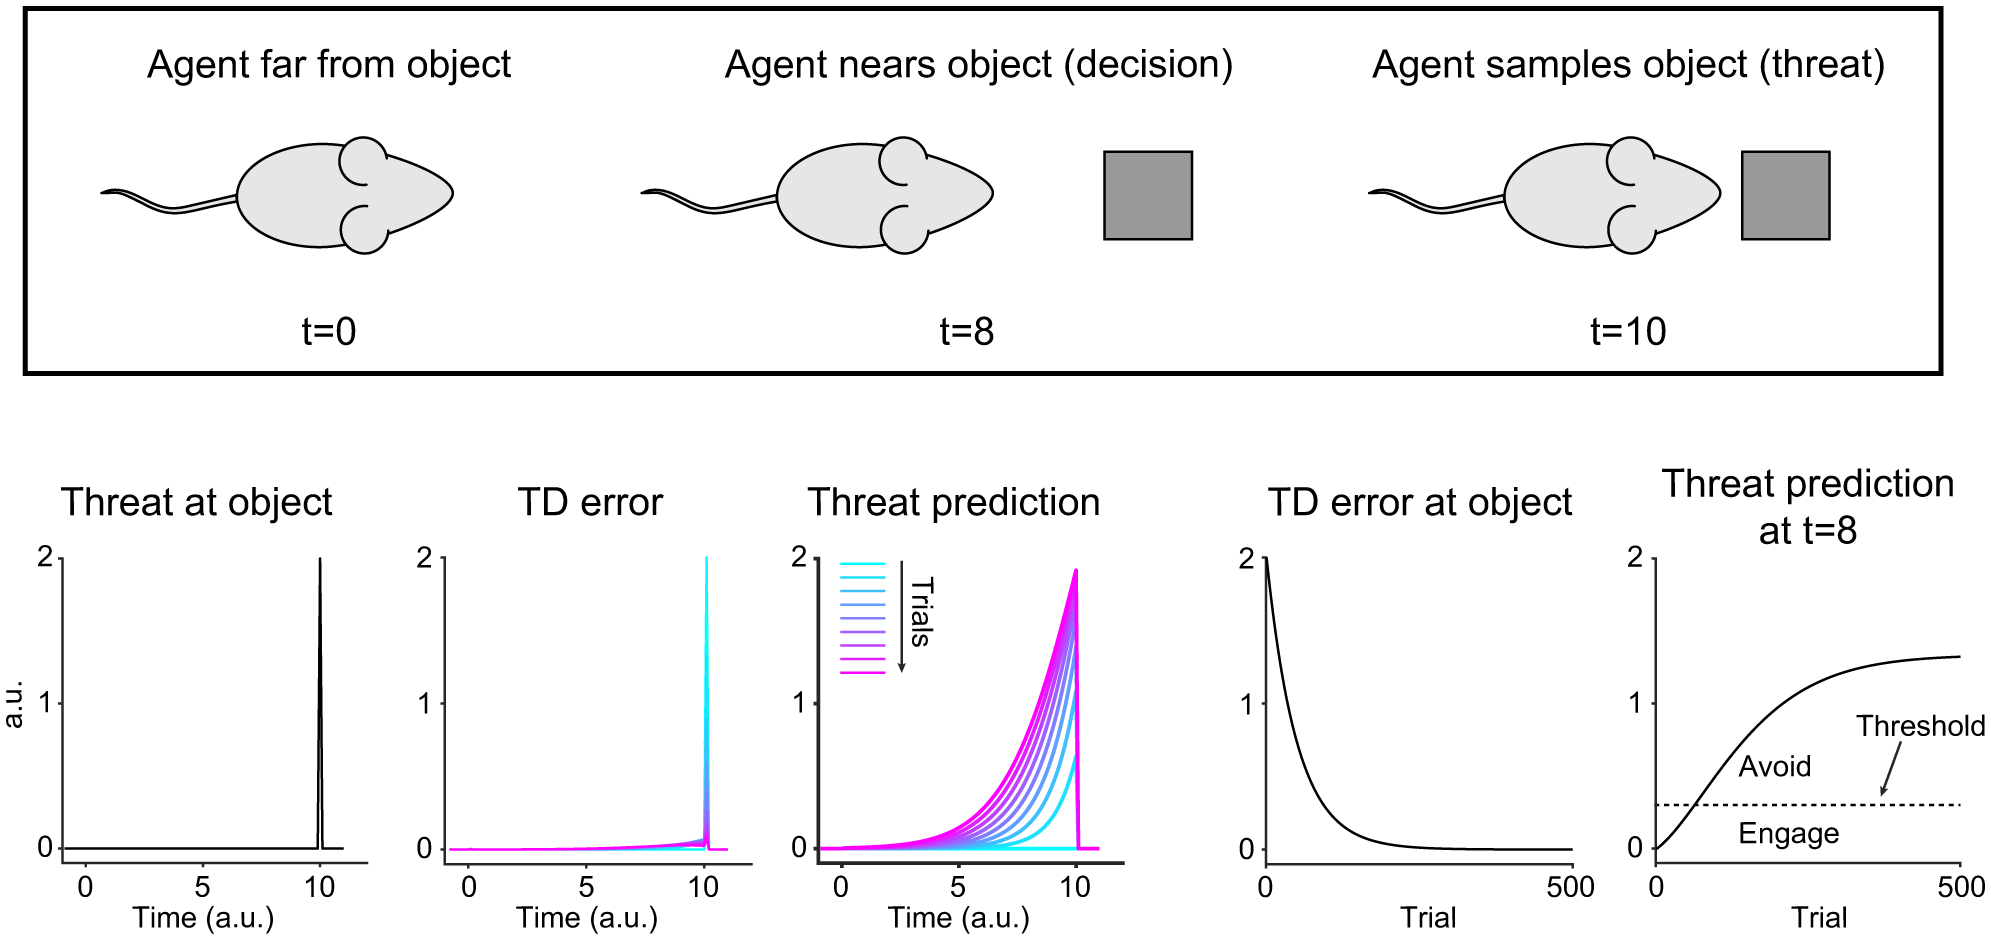
Animals both explore and avoid novel objects in the environment, but the neural mechanisms that underlie these behaviors and their dynamics remain uncharacterized. Here, we used multi-point tracking (DeepLabCut) and behavioral segmentation (MoSeq) to characterize the behavior of mice freely interacting with a novel object. Novelty elicits a characteristic sequence of behavior, starting with investigatory approach and culminating in object engagement or avoidance. Dopamine in the tail of the striatum (TS) suppresses engagement, and dopamine responses were predictive of individual variability in behavior. Behavioral dynamics and individual variability are explained by a reinforcement-learning (RL) model of threat prediction in which behavior arises from a novelty-induced initial threat prediction (akin to "shaping bonus") and a threat prediction that is learned through dopamine-mediated threat prediction errors. These results uncover an algorithmic similarity between reward- and threat-related dopamine sub-systems.

Keywords: avoidance; dopamine; initialization; neophobia; novelty; prediction; reinforcement learning; tail of the striatum; threat; threat prediction error; uncertainty.


Conflict of interest statement

Declaration of interests The authors declare no competing interests.

Figures

Figure 1.
Figure 1.. Diversity of novelty behavior is captured in open arena
A. Trajectory of nose from an example animal in the first 10 minutes of each session. B. Time spent within object area (7cm radius). Left thick black, average value across mice. Right bottom, mean ± SEM. Time spent near object was significantly correlated across novelty days, but not between novelty and habituation days (R=−0.02, p=0.89, H1; R=0.29, p=0.13, H2; R=0.87, p=0.0000, N2; R=0.69, p=0.001, N3; R=0.66, p=0.0002, N4, Pearson’s correlation coefficient with N1, n=26 animals). C. Frequency of approaches. D. Duration of approach bouts.
Figure 2.
Figure 2.. Stereotypic behavioral response to novelty.
A. Trajectory of nose or tail (in red and black, respectively) from an example mouse in the first 20 bouts of each session. B. Nose and tail position relative to object in an example animal. C. The closest position to object within each bout for nose and tail in an example animal. D. Frequency of approach bout with tail behind. Bottom, mean ± SEM. Right, average frequency normalized with baseline on habituation for each mouse. Tail behind approach frequency decreases over time (p=2.8×10⁻¹¹, t-test, n=26 animals, beta coefficients of linear regression of frequency with time). E. Fraction of tail exposure.
Figure 3.
Figure 3.. Suppression of post-assessment engagement with stimulus novelty.
A. Time spent near an object. Right, cumulative probability on N1. Mice spend less time near a novel object (p=0.018, n=9 animals for each group, Kolmogorov-Smirnov (K-S) test). B. Frequency of each approach type. Right, mean ± SEM. C. Average frequency of approaches on N1 for each mouse. Approach with tail behind is more frequent towards novel objects (p=0.0031), whereas approach with tail exposure is more frequent towards unexpected familiar objects (p=0.0031, n=9 animals for each group, t-test). D. Fraction of animals with approach with tail behind in each approach bout.
Figure 4.
Figure 4.. Ablation of TS-projecting dopamine neurons promotes post-assessment engagement.
A. Coronal sections (bregma −1.5mm) from sham (left) and ablation (right) animals. Dopamine axons were labeled with anti-tyrosine hydroxylase (TH) antibody. BLA, basolateral amygdala; CeA, central amygdala. B. Time spent near object. Right, cumulative probability on N1. Ablation vs sham, p=0.030 (K-S test). C. Frequency of each approach type bouts. Right, mean ± SEM. D. Average frequency of approach with tail behind (left; p=0.069, t-test) and approach with tail exposure (right, p=0.010, t-test) on N1. n=17 animals for each group. See also Figure S1 and Figure S2.
Figure 5.
Figure 5.. Behavioral segmentation of novelty responses using MoSeq
A. MoSeq workflow. B. Top, syllable usage across all approach bouts on N1 in all mice. Bottom, fraction of syllable usage at retreat (−1s to 1s). C. Syllable usage in novel object group. D. Top, example image series and superimposed images (full videos in Video S1 and S2). Bottom, spatial expression. E. Syllable usage in each group. Top, time-course (mean ± SEM). Bottom, total syllable expression (novel object vs unexpected familiar object, p=4.9×10⁻⁴, syllable 79; p=4.9×10⁻⁴, syllable 14, n=9 animals for each; sham vs ablation, p=0.010, syllable 79; p=0.030, syllable 14, n=17 animals for each, K-S test). Expression of both syllables decreased over time (−0.10/min, p=6.8×10⁻¹⁵, F-statistic 9.0; syllable 79; −0.07/min, p=2.0×10⁻¹², F-statistic 7.2, syllable 14, linear regression with time and animals in the novel object group, degree of freedom 215). F. Left, fractional expression of each syllable after syllable 79. Right, fraction of syllable 14 expression following syllable 79 expression (p=0.72, n=17 animals for each, t-test). See also Figure S3.
Figure 6.
Figure 6.. Individual variability in behavior correlates with dopamine in TS.
A. Dopamine signals in each trial in an example animal (top) and mean ± SEM (bottom, n=15 animals). Tick marks, approach start (cyan), retreat start (red), and retreat end (green). B. Average dopamine signals on N1 in each animal. C. Average dopamine signals of each animal plotted against behavioral measurements and Pearson’s correlation coefficient, n=15 animals. First tail exposure for mice that never showed tail exposure (3 animals) was set to 25min. D. Time-course of dopamine signals across trials for each animal (top) or aligned to the first tail exposure (bottom). E. Dopamine signals in mice that never showed approach with tail exposure (left, n=3 animals) and in other mice (right, n=12 animals). mean ± SEM. F. Dopamine signals during phase 2. mean ± SEM, n=12 animals. See also Figure S4.
Figure 7.
Figure 7.. Basic reinforcement learning model with constant threat.
The time-course of variables within each trial (left) and over trials (right). Color, Trial 1–161, every 20 trials.
Figure 8.
Figure 8.. Reinforcement learning model with shaping bonus and uncertainty.
A. The time-course of variables within each trial (left) and over trials (right). Color, trial 1–321, every 40 trials. B. Components to determine behaviors. Left, threat prediction near object (t=8). Second from left, threat uncertainty near object. Third from left, threat prediction plotted together with threat uncertainty (shading). Black dotted line, threat threshold. Right, threat prediction distribution in example trials (trial 1 and trials shown with blue and cyan dotted line in third from left). C. Development of behaviors based on different degrees of shaping bonus. See also Figure S5.

Comment in

References

    1. Baron-Cohen S, Knickmeyer RC, and Belmonte MK (2005). Sex differences in the brain: Implications for explaining autism. Science 310, 819–823. 10.1126/science.1115455. - DOI - PubMed
    1. Barto A, Mirolli M, and Baldassarre G (2013). Novelty or Surprise? Frontiers in Psychology 4. - PMC - PubMed
    1. Blanchard DC, Blanchard RJ, and Rodgers RJ (1991). Risk Assessment and Animal Models of Anxiety. In Animal Models in Psychopharmacology, Olivier B, Mos J, and Slangen JL, eds. (Basel: Birkhäuser; ), pp. 117–134.
    1. Bromberg-Martin ES, and Hikosaka O (2009). Midbrain Dopamine Neurons Signal Preference for Advance Information about Upcoming Rewards. Neuron 63, 119–126. 10.1016/j.neuron.2009.06.009. - DOI - PMC - PubMed
    1. Cohen JY, Haesler S, Vong L, Lowell BB, and Uchida N (2012). Neuron-type-specific signals for reward and punishment in the ventral tegmental area. Nature 482, 85–88. 10.1038/nature10754. - DOI - PMC - PubMed

Publication types

LinkOut - more resources