. 2022 Oct 11;55(10):1872-1890.e9.
doi: 10.1016/j.immuni.2022.08.019. Epub 2022 Sep 20.

Human anti-smallpox long-lived memory B cells are defined by dynamic interactions in the splenic niche and long-lasting germinal center imprinting

Affiliations

Human anti-smallpox long-lived memory B cells are defined by dynamic interactions in the splenic niche and long-lasting germinal center imprinting

Pascal Chappert et al. Immunity. .

Abstract

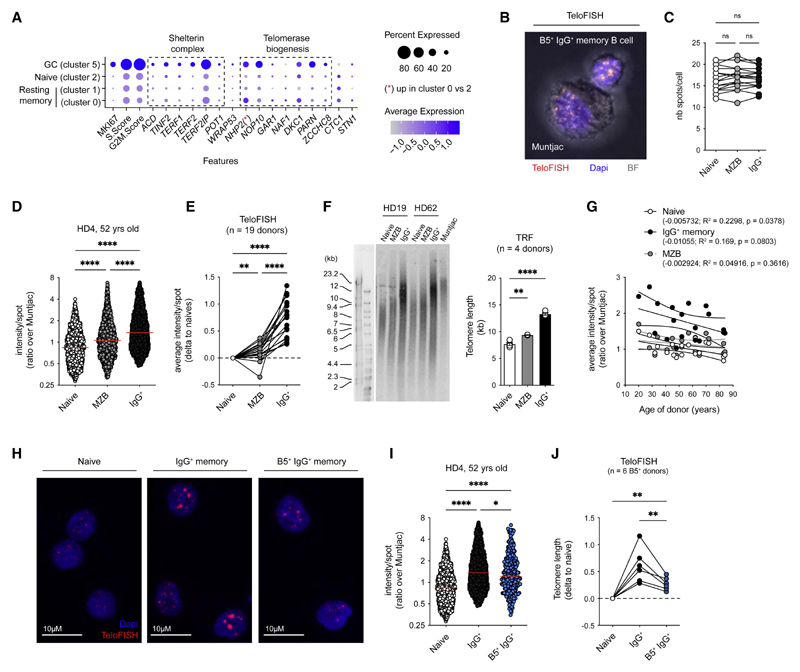
Memory B cells (MBCs) can persist for a lifetime, but the mechanisms that allow their long-term survival remain poorly understood. Here, we isolated and analyzed human splenic smallpox/vaccinia protein B5-specific MBCs in individuals who were vaccinated more than 40 years ago. Only a handful of clones persisted over such an extended period, and they displayed limited intra-clonal diversity with signs of extensive affinity-based selection. These long-lived MBCs appeared enriched in a CD21hiCD20hi IgG+ splenic B cell subset displaying a marginal-zone-like NOTCH/MYC-driven signature, but they did not harbor a unique longevity-associated transcriptional or metabolic profile. Finally, the telomeres of B5-specific, long-lived MBCs were longer than those in patient-paired naive B cells in all the samples analyzed. Overall, these results imply that separate mechanisms such as early telomere elongation, affinity selection during the contraction phase, and access to a specific niche contribute to ensuring the functional longevity of MBCs.

Keywords: affinity selection; long-lasting immune memory; memory B cells; smallpox; splenic microenvironment; telomeres; vaccinia.


Conflict of interest statement

Declaration of interests M.M. received research funds from GSK and personal fees from LFB and Amgen, and J.-C.W. received consulting fees from Institut Mérieux, all outside of the submitted work.

Figures

Graphical abstract
Graphical abstract
Figure 1
Figure 1. Long-lived splenic vaccinia-specific MBCs reside in the splenic CD73+CD21+CD27+ IgG+ B cell population
(A) Experimental scheme for the isolation and retrospective validation of sorted of anti-vaccinia B5 MBCs from the spleen of organ donors. (B) Corrected frequencies of B5-specific MBCs in live IgG+ CD27+ MBCs plotted against donor’s age. Donors born after 1977 (n = 8) and before 1970 (n = 56) are highlighted in red and white, respectively. (C) Representative dot-plot of B5-staining (left) and corrected frequencies of B5-specific MBCs in enriched IgG+ or IgM+CD27+ live CD20+ splenic B cells (right, n = 5 donors). (D) Representative overlaid IgG and CD27 staining (left) and frequencies of CD27+ in B5+IgG+ or total IgG+ live CD20+ splenic B cells (right, n = 18 donors). (E) Representative overlaid CD11c and CD21 staining (left) and frequencies of CD21lowCD11c+ in validated B5+IgG+ or total IgG+ live CD20+ splenic B cells (right, n = 10 donors). (F) Representative CD73 staining (left) and graph frequencies of CD73+ in validated B5+IgG+ or total IgG+ live CD20+ splenic B cells (right, n = 6 donors). (C-F) Wilcoxon matched-pairs signed rank test (**** p < 0.0001, ** p < 0.01, * p < 0.05). See also Figure S1 and Table S1.
Figure 2
Figure 2. Vaccinia-specific long-lived MBCs display evidence of extensive clonal selection
(A) Clonal distribution forVμ sequencesfrom validated B5-specific IgG+ MBCs (n = 5 donors). Outer blue semicircular line indicates the proportion ofsequences belonging to the top five clones for each donor. The total number of sequences is indicated at the pie center. Colored dots highlight shared clones between donors. (B) Number of mutations in the VH segment of B5-specific IgG+ MBCs grouped by clone of size 5 or more for each donor. Mean ± SEM. (C) Measured KDvalue(nM) foreachtested supernatants(white, n = 102) or re-expressed antibodies (red, n = 14)from B5-specific IgG+ MBCs. Mean KD (line) and total number of tested antibodies (above) per donor are shown. (D) Representative lineage trees for B5-specific IgG+ MBC clones (dot size: number of identical VH sequences; dot color: isotype). Sequence logo representing all CDR3 inside that clone, as well as V and J calls, is added on the bottom right. Affinities from tested supernatants are displayed on the right side of each tree in front of related sequence nodes. (E) Representative amino acid VH alignment for all non-identical sequences at the nucleotidic level from clone 11 (rank 1) of donor HD4. See also Figure S2 and Table S2.
Figure 3
Figure 3. Vaccinia-specific long-lived MBCs are enriched in a splenic CD21hi IgG+ MBC subset
(A) UMAP and clustering of all (left) and individual sorted cell types (right) among the 8,326 scRNA-seq analyzed naive, GC, and total or vaccinia-specific memory B cells (n = 9 organ donors [healthy donors, HD]; n = 4 young donors [YD]; and n = 3 immune thrombocytopenia [ITP] patients). (B) Relative cluster distribution for all sorted MBCs from indicated donor groups (top) and from donors for whom both total and vaccinia-specific MBCs were sorted (matched donors, n = 6 of 9 HD). Bar indicates mean with SEM. (C) Expression (scaled normalized counts) of selected genes in cells from all clusters. (D) Representative CD20 and CD21 staining in gated splenic naive and IgG+ MBCs, with frequencies and gating strategies for CD21hiCD20hi, CD21intCD20int, and CD21loCD20hi populations (left). Representative overlaid CD11c (right, up) and Tbet staining (right, bottom) in indicated splenic naive and IgG+ memory populations. (E) Representative overlaid CD21 staining in gated circulating (PBMCs) or splenic naive, CD27+gD+ marginal zone (MZB) and IgG+ MBCs. (F) Frequencies of naive, MZB, and IgG+ memory in B cells (left) and of indicated subpopulation in IgG+ MBCs (right) from total PBMCs or spleen of organ donors (n = 7). (G) Frequencies of CD21hiCD20hi in splenic IgG+ MBCs plotted against donor’s age (n = 42 donors). Linear regression and 95% confidence intervals are shown. (H) Representative overlaid CD21 and CD20 staining (left) and graph showing the frequencies of CD21hiCD20hi in validated B5+IgG+ or total IgG+ live CD20+ splenic B cells (right, n = 10 donors). (I) Representative lineage trees for B5-specific IgG+ MBC clones (dot size: number of identical VH sequence; dot color: index-sorting phenotype). (B) Ordinary two-way ANOVA (top) and repeated measure two-way ANOVA (bottom) with all comparisons made compared with the “Mem HD” group. (F) Multiple and (H) single Wilcoxon matched-pairs signed rank test with false discovery rate (FDR) correction for multiple comparisons) (**** p < 0.0001, *** p < 0.001, ** p < 0.01, * p < 0.05). See also Figure S3 and Table S3.
Figure 4
Figure 4. CD21hi IgG+ splenic MBCs exhibit a NOTCH/MYC/ETV6-driven signature
(A) scRNA-seq expression data for all donors with matched naive and memory populations and for all genes significantly upregulated in one of the two quiescent IgG+ memory clusters (clusters 0 and 1) in one of the three following comparisons: cluster 0 versus 1, cluster 0 versus 2, and cluster 1 versus 2. Row-scaled pseudobulk expression averaged by cluster and donor is displayed, and genes belonging to the HALLMARK_MYC_Targets_v1 (black lines) and RYAN_NOTCH_DIRECT genesets (red lines and gene labels; Ryan et al., 2017) are highlighted. (B) Preranked geneset enrichment analysis (GSEA) results for all three comparisons performed in (A) and all genesets with a normalized enrichment score (NES) > 1.5 and FDR < 0.01 in one of the 3 comparisons. (C) Representative enrichment plots for the comparison of cluster 0 versus cluster 1. (D) Scaled expression (row-normalized area under the curve [AUC] score) of the topmost significantly upregulated SCENIC regulons in indicated clusters. (E) Overlaid AUC score for MYC, ETV6, and HES1 regulons in cells from indicated clusters. (F-J) Isolation of paired splenic naive, CD21int, and CD21hi IgG+ MBC samples from organ donors (n = 4) for bulk RNA-seq and ATAC-seq analysis. (F) Gating strategy, (G) PCA analysis of bulk RNA-seq expression data, (H) representative GSEA enrichment plot, (I) log2 of the fold change (Log2FC) in RNA expression for differentially expressed genes in the comparison of sorted CD21hiCD20hi and CD21 intCD20int IgG+ MBCs, and (J) row-scaled RNA-seq expression data for all genes of the RYAN_NOTCH_DIRECT geneset detected as differentially expressed in one of the three comparisons: CD21hi versus CD21int, CD21hi versus naives, and CD21int versus naives. Log2FC in accessibility at the most differentially accessible NOTCH binding regions identified in our bulk ATAC-seq data for each individual gene are displayed on the right of the heatmap for all three comparisons. See also Figures S4 and S5 and Table S3.
Figure 5
Figure 5. CD21hi IgG+ splenic MBCs share partial phenotype and homing potential with splenic marginal zone B cells
(A) scRNA-seq expression (scaled normalized counts) of selected genes coding for integrins, chemokine receptors, and positive and negative regulators of BCR signaling in cluster 0 (CD21hi), 1 (CD21int), and 2 (naives). (B) Enrichment plots for HART_KLF2–/– FoB_DN geneset (Hart et al., 2011) in the comparison of cluster 0 versus cluster 1 (scRNA-seq) and sorted splenic CD21hiCD20hi versus CD21intCD20int IgG+ MBCs (bulk RNA-seq). (C-E) Representative overlaid stainings (top) and median fluorescence intensities (medianFI) for indicated markers (bottom) in gated splenic naive, CD21int, or CD21hi IgG+ MBCs (gated as in Figure 3D), and IgD+CD27+ marginal zone B cells (MZB) (n = 7-10 HD donors). A non-parametric Friedman test with FDR correction for multiple comparisons (**** p < 0.0001, *** p < 0.001, ** p < 0.01, * p < 0.05). See also Figure S6.
Figure 6
Figure 6. CD21hi IgG+ splenic MBCs display enhanced metabolic activity
(A and B) (A) Representative Seahorse XF Gluco stress test’s extracellular acidification rate (ECAR) results and (B) calculated basal glycolysis, glycolytic activity, and glycolytic reserve for sorted splenic naive and IgG+ MBCs (n = 5 HD donors). (C-E) (C) Representative Seahorse XF Mito stress test’s oxygen consumption rate (OCR) results; (D) calculated basal respiration, maximal respiration, and spare capacity; and (E) calculated OCR/ECAR ratio prior to oligomycin addition for sorted splenic naive and IgG+ MBCs (n = 5 donors). (A-E) Mean ± SEM. (F) Representative overlaid histograms (top) and graph showing the fold change in TMRE and MitoID median fluorescence intensities (bottom) between splenic naive and CD21hi or CD21int IgG+ MBCs (gated as in Figure 3D, n = 8 HD donors). (G) Row-scaled UHPLC-MS quantification of basal expression of KREBS cycle metabolites between splenic naive and total IgG+ MBCs (n = 3 HD donors). (H) Representative overlaid histograms (left) and graph showing the fold change in 2-NBDG incorporation (right) between splenic naive and CD21hi or CD21int IgG+ MBCs (n = 8 HD donors). (I) Representative overlaid histograms showing 2-NBDG incorporation in splenic naive, CD21hi or CD21int IgG+ memory, and GC B cells from young donors (n = 4 YD donors). (J) Isotopomer distribution (from no labeled carbon [black, M+0] to six [yellow, M+6]) in all detected metabolites from splenic naive and total IgG+ MBCs at 0, 1, and 6 h post incubation with labeled 13C-glucose (n = 3 HD donors). (K) Representative overlaid histograms (left) and graph showing the fold change in NileRed median fluorescence intensities (right) between splenic naive and CD21hi or CD21int IgG+ MBCs (n = 8 HD donors). (L) Representative confocal image of NileRed stained CD21hi IgG+ MBCs. (M) Representative overlaid FSC and SSC fluorescence intensities in splenic naive and CD21hi or CD21int IgG+ MBCs. (E) Wilcoxon matched-pairs signed rank test. (B, D, F, H, and K) Repeated measure two-way ANOVA with FDR correction for multiple comparisons (****p < 0.0001, ***p < 0.001, **p < 0.01, *p < 0.05). See also Figure S7.
Figure 7
Figure 7. IgG+ splenic MBCs exhibit elongated telomeres that last for decades
(A) scRNA-seq expression (scaled normalized counts) of detected genes coding for members of the shelterin complex or linked to telomerase biogenesis/activity and MKI67 and signature score for G2M and S cell-cycle phases in cluster 0 (CD21hi), 1 (CD21int), 2 (naives), and 5 (GC). (B) Representative TeloFish staining in a B5+ IgG+ splenic MBCs (top) and an internal control Muntjac cell (bottom). (C) Median number of TeloFish spots detected per cell of each sorted cell type for each donor analyzed. (Dand E) (D) Representative distribution of TeloFish spot intensities (ratio over average intensity of spots in Muntjac cells), and (E) variation in average intensity per spots as compared to naive B cells from the same donor in indicated subsets (n = 19 HD donors). (F) Representative gel for telomere restriction fragment (TRF) analysis (left) and estimated telomere length (right) in indicated subsets (n = 4 HD donors). (G) Average intensity per spots in indicated subsets compared with donors age (n = 19 HD donors). Linear regression and 95% confidence intervals are shown. (H-J) Representative TeloFish staining (H), representative distribution of TeloFish spots intensities (I), and variation in average intensity per spots as compared to naive B cells from the same donor in indicated subsets (J) (n = 6 HD donors). (D and I) Kruskal-Wallis test and (C, E, F, and J) repeated measures one-way ANOVA with FDR correction for multiple comparisons (**** p < 0.0001, *** p < 0.001, ** p < 0.01, * p < 0.05, n.s. non-significant).

References

    1. Aibar S, Gonzalez-Blas CB, Moerman T, Huynh-Thu VA, Imrichova H, Hulselmans G, Rambow F, Marine J-C, Geurts P, Aerts J, et al. SCENIC: single-cell regulatory network inference and clustering. Nat Methods. 2017;14:1083–1086. doi: 10.1038/nmeth.4463. - DOI - PMC - PubMed
    1. Akondy RS, Fitch M, Edupuganti S, Yang S, Kissick HT, Li KW, Youngblood BA, Abdelsamed HA, McGuire DJ, Cohen KW, et al. Origin and differentiation of human memory CD8 T cells after vaccination. Nature. 2017;552:362–367. doi: 10.1038/nature24633. - DOI - PMC - PubMed
    1. Albagli-Curiel O, Lecluse Y, Pognonec P, Boulukos KE, Martin P. A new generation of pPRIG-based retroviral vectors. BMC Biotechnol. 2007;7:85. doi: 10.1186/1472-6750-7-85. - DOI - PMC - PubMed
    1. Aldaz-Carroll L, Whitbeck JC, Ponce de Leon M, Lou H, Hirao L, Isaacs SN, Moss B, Eisenberg RJ, Cohen GH. Epitope-mapping studies define two major neutralization sites on the vaccinia virus extracellular enveloped virus glycoprotein B5R. J Virol. 2005;79:6260–6271. doi: 10.1128/JVI.79.10.6260-6271.2005. - DOI - PMC - PubMed
    1. Amanna IJ, Slifka MK. Quantitation of rare memory B cell populations by two independent and complementary approaches. J Immunol Methods. 2006;317:175–185. doi: 10.1016/j.jim.2006.09.005. - DOI - PMC - PubMed

Publication types

Substances