. 2022 Sep 21;11(1):58.
doi: 10.1038/s41389-022-00428-0.

Heparanase modulates the prognosis and development of BRAF V600E-mutant colorectal cancer by regulating AKT/p27Kip1/Cyclin E2 pathway

Affiliations

Heparanase modulates the prognosis and development of BRAF V600E-mutant colorectal cancer by regulating AKT/p27Kip1/Cyclin E2 pathway

Mengling Liu et al. Oncogenesis. .

Abstract

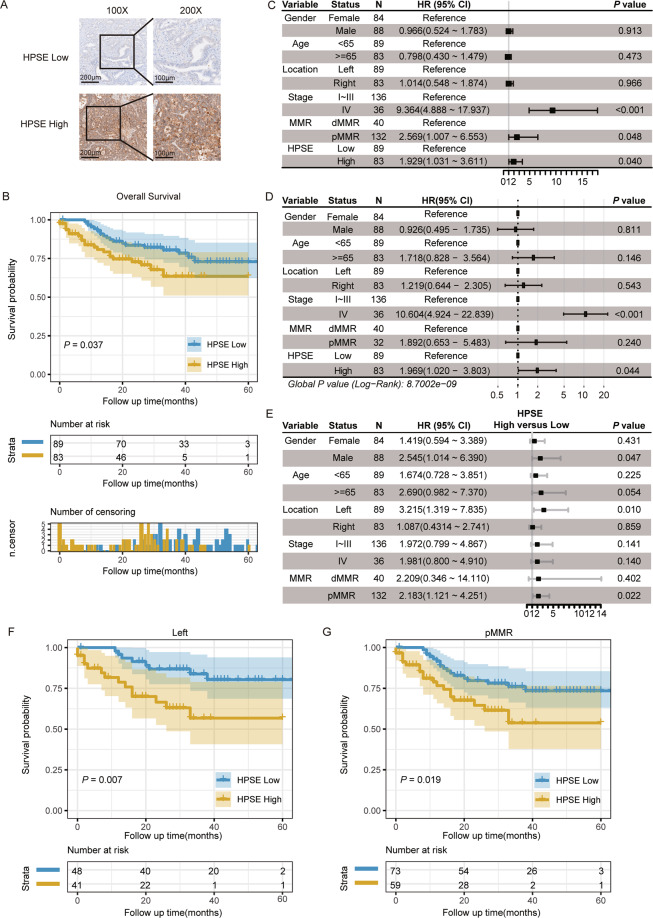
BRAF V600E-mutant colorectal cancer (CRC) is a rare subtype of colorectal cancer with poor prognosis. Compelling evidence indicates that the heparanase (HPSE) gene has multiple functions in cancer, however, its role in BRAF V600E-mutant CRC remains elusive. Differentially expressed genes between BRAF V600E-mutant and wild-type patients were explored by analyzing public data from The Cancer Genome Atlas and the Gene Expression Omnibus. Clinical samples of 172 patients with BRAF V600E-mutant CRC diagnosed at Zhongshan Hospital Fudan University were collected. Overall survival was analyzed using Kaplan-Meier curves and Cox regression models. Cell models and xenografts were utilized to investigate the effect of HPSE on tumor proliferation. HPSE was significantly highly expressed in the BRAF V600E-mutant group. High HPSE expression level was independently associated with inferior survival in the BRAF V600E-mutant cohort. HPSE knockdown impeded tumor proliferation of BRAF V600E-mutant CRC cells in vitro and in vivo. Mechanistically, HPSE silencing arrested cell cycle in G0/G1 phase by downregulating Cyclin E2 expression via the AKT/p27Kip1 pathway. These findings support a role for HPSE in promoting BRAF V600E-mutant CRC progression, which suggests it holds great promise as a prognostic biomarker and a potential therapeutic target for the aggressive CRC subtype.


Conflict of interest statement

The authors declare no competing interests.

Figures

Fig. 1
Fig. 1. HPSE expression level is significantly higher in BRAF V600E-mutant compared to BRAF wild-type patients.
A Volcano maps of differentially expressed genes between BRAF V600E-mutant and wild-type colorectal cancer patients in the TCGA dataset (left) and GSE39582 dataset (right). Dots represent genes. Significantly upregulated and downregulated genes, based on a cutoff fold change of 2 and an adjusted P-value at 0.05, are colored in orange and green, respectively. The top 10 upregulated and downregulated genes are colored in red and blue, respectively. Common six genes were labeled with gene symbols. The ggpubr and ggthemes R packages were used to generate the map. B Multiple linear regression analysis of HPSE expression levels in public datasets. Samples with missing values were removed. F test P < 0.001 in TCGA and GSE39582 datasets. Estimate (blocks in the center) and 95% confidence intervals (Whiskers of error bars) are shown. CI confidence intervals. C Expression levels of HPSE in BRAF V600E-mutant and BRAF wild-type CRC patients based on public data. Dots in violin plots represent samples. Centerlines indicate median, red dots indicate the mean, box plots indicate the quartiles, and bars indicate 95% confidence intervals. Violin plots were generated using ggplot2 package and ggstatsplot package. A two-sided Welch’s t-test was used to determine P values. D Higher HPSE expression level in BRAF V600E-mutant CRC verified using frozen tissue of CRC samples from Zhongshan hospital. Locations of the primary tumor were unbalanced between BRAF V600E-mutant and wild-type samples (Table S2); however, no difference was reported in HPSE expression level between different primary tumor sites. Data are presented as mean ± standard deviation. The student’s t-test was used to calculate P values. ***P < 0.001, ns P > 0.05.
Fig. 2
Fig. 2. High HPSE expression level is associated with poor prognosis of BRAF V600E-mutant CRC patients.
A Representative images of immunohistochemical staining for HPSE. B Kaplan–Meier survival curves in HPSE high and low groups of patients with BRAF V600E-mutant CRC. A log-rank test was used to calculate the P-value. Shaded regions around the curves indicate 95% confidence intervals. The number of patients at risk and censoring are presented below the survival curve. C Results of univariate Cox proportional hazard model presented as Hazard ratios (blocks in the center) and 95% confidence intervals (Whiskers of error bars). D Results of multivariate Cox proportional hazard model presented as Hazard ratios (blocks in the center) and 95% confidence intervals (Whiskers of error bars). E Results of survival analysis in different subgroups. Hazard ratios (blocks in the center) and 95% confidence intervals (Whiskers of error bars) were determined by univariate Cox regression. The reference level in each subgroup was HPSE low. Kaplan–Meier survival curves in the (F) left location subgroup and (G) pMMR subgroup. A log-rank test was used to determine P-value. Shaded regions around the curves indicate 95% confidence intervals. The number of patients at risk are presented below the survival curve. R survival package, survminer package, and forest package were used for survival analysis. HR hazard ratios; CI confidence intervals.
Fig. 3
Fig. 3. Silencing HPSE inhibits proliferation of BRAF V600E-mutant CRC cells in vitro and in vivo.
A Baseline relative expression level of HPSE in different CRC cell lines at mRNA level (top) and protein level (bottom). The same trend was observed in three independent repeated experiments. Representative results are shown. WT: KRAS/BRAF wild type; KRAS MT: KRAS mutant type; BRAF V600E MT: BRAF V600E mutant type. B Verification of knockdown of HPSE expression in HT29 and RKO at mRNA level (top) and protein level (bottom). The same trend was observed in three independent repeated experiments. Representative results are shown. Data are presented as mean ± standard deviation. NC negative control. C Representative images and statistical analysis of colony formation assay. Cells were seeded in six-well plates at 500 cells per well and cultured for 14 days. The same trend was observed in three independent repeated experiments. Data are presented as the mean ± standard deviation. D Subcutaneous xenograft models and tumors isolated on day 24. Each group contained six mice. Subcutaneous tumor formation rates of the two groups were 100% (6/6) in the control group and 33.3% (2/6) in the HPSE silencing group. E Growth curves of subcutaneous tumors in nude mice. Points and error bars represent mean ± standard errors. F Weight of subcutaneous tumors isolated from models on day 24. Data are presented as the mean ± standard deviation. G HE staining and IHC staining of HPSE and Ki67 in subcutaneous tumor tissues. Representative images and semi-quantification analysis are shown. Data are presented as the mean ± standard deviation. The student’s t-test was used to determine the P-value in two-group comparisons. One-way ANOVA analysis and Tukey’s test were used for multiple comparisons. ****P < 0.0001, ***P < 0.001, **P < 0.01, *P < 0.05, ns P > 0.05.
Fig. 4
Fig. 4. Silencing HPSE arrests cell cycle of BRAF V600E-mutant CRC cells by downregulating Cyclin E2 expression.
A Cell cycle distributions and statistical analysis of HT29 and RKO with or without HPSE silencing. The same trend was observed in three independent repeated experiments. Representative images and statistical analysis of cell cycle distribution are shown. Data are presented as the mean ± standard deviation. B Expressions of critical cell cycle-related proteins in BRAF V600E-mutant CRC cells with or without HPSE silencing. The same trend was observed in three independent repeated experiments. Green color represents downregulated proteins. Representative results and semi-quantification analysis are shown. Data are presented as the mean ± standard deviation. C IHC staining of Cyclin E2 in subcutaneous tumor tissues. Representative results and semi-quantification analysis are shown. Data are presented as the mean ± standard deviation. D Verification of CCNE2 overexpression in HPSE-knockdown HT29 at the protein level. The same trend was observed in three independent repeated experiments. Representative results and semi-quantification analysis are shown. Data are presented as the mean ± standard deviation. NC negative control. OE overexpression of CCNE2. E Representative images and statistical analysis of colony formation assay. Cells were seeded in six-well plates at 1000 cells per well and cultured for 10 days. The same trend was observed in three independent repeated experiments. Data are presented as the mean ± standard deviation. The student’s t-test was used to determine the P-value in two-group comparisons. One-way ANOVA analysis and Tukey’s test were used for multiple comparisons. ****P < 0.0001, ***P < 0.001, **P < 0.01, *P < 0.05, ns P > 0.05.
Fig. 5
Fig. 5. Silencing HPSE suppresses cell proliferation of BRAF V600E-mutant CRC cells through AKT/p27Kip1 pathway.
A Expression levels of cell proliferation-related signaling proteins in BRAF V600E-mutant CRC cells with or without HPSE silencing. Red color represents upregulated proteins. Green represents downregulated proteins. The same trend was observed in three independent repeated experiments. Representative images and semi-quantification analysis are shown. Data are presented as the mean ± standard deviation. B IHC staining of p27Kip1 and phospho-AKTser473 in subcutaneous tumor tissues. Representative images and semi-quantification analysis are shown. Data are presented as the mean ± standard deviation. CE Representative images and statistical analysis of colony formation assay. Cells were seeded in six-well plates at 1000 cells per well and cultured for 10 days. In the group treated with SC79, SC79 (S7863, Selleckchem, Shanghai, China) was dissolved in dimethyl sulfoxide (DMSO, Sigma) and diluted to 10 µM with the complete medium before use. Cells were incubated with DMSO/SC79 (10 µM) for 7 days. The same trend was observed in three independent repeated experiments. Data are presented as the mean ± standard deviation. F Proposed model for the mechanism of HPSE function on cell proliferation in BRAF V600E-mutant CRC cells. Red color represents upregulated or activated proteins. Green represents downregulated or inactivated proteins. The student’s t-test was used to determine the P-value in two-group comparisons. One-way ANOVA analysis and Tukey’s test were used for multiple comparisons. ****P < 0.0001, ***P < 0.001, **P < 0.01, *P < 0.05, ns P > 0.05.

References

    1. Cancer Genome Atlas N. Comprehensive molecular characterization of human colon and rectal cancer. Nature. 2012;487:330–7. doi: 10.1038/nature11252. - DOI - PMC - PubMed
    1. Sanz-Garcia E, Argiles G, Elez E, Tabernero J. BRAF mutant colorectal cancer: prognosis, treatment, and new perspectives. Ann Oncol. 2017;28:2648–57. doi: 10.1093/annonc/mdx401. - DOI - PubMed
    1. Yao Z, Yaeger R, Rodrik-Outmezguine VS, Tao A, Torres NM, Chang MT, et al. Tumours with class 3 BRAF mutants are sensitive to the inhibition of activated RAS. Nature. 2017;548:234–8. doi: 10.1038/nature23291. - DOI - PMC - PubMed
    1. Seligmann JF, Fisher D, Smith CG, Richman SD, Elliott F, Brown S, et al. Investigating the poor outcomes of BRAF-mutant advanced colorectal cancer: analysis from 2530 patients in randomised clinical trials. Ann Oncol. 2017;28:562–8. doi: 10.1093/annonc/mdw645. - DOI - PubMed
    1. Roth AD, Tejpar S, Delorenzi M, Yan P, Fiocca R, Klingbiel D, et al. Prognostic role of KRAS and BRAF in stage II and III resected colon cancer: results of the translational study on the PETACC-3, EORTC 40993, SAKK 60-00 trial. J Clin Oncol. 2010;28:466–74. doi: 10.1200/JCO.2009.23.3452. - DOI - PubMed