. 2022 Sep 21;12(1):15746.
doi: 10.1038/s41598-022-20025-w.

Machine learning partners in criminal networks

Affiliations

Machine learning partners in criminal networks

Diego D Lopes et al. Sci Rep. .

Abstract

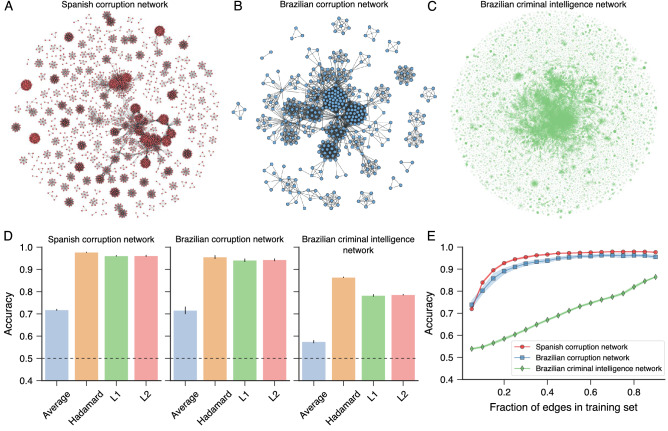
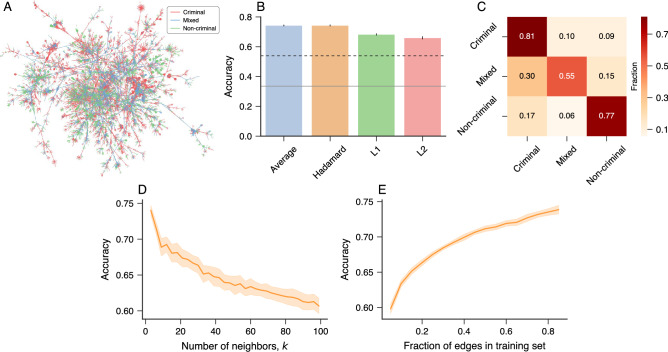
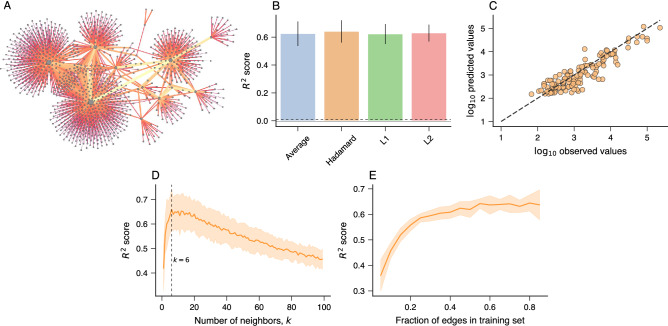
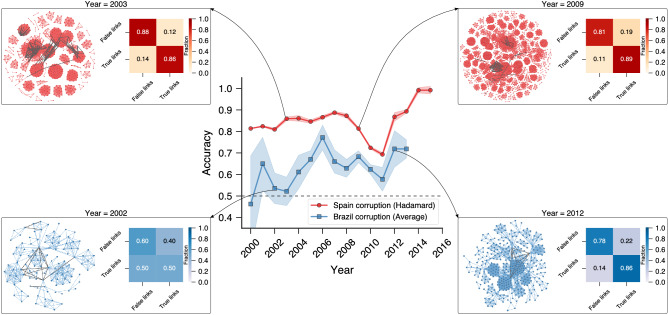
Recent research has shown that criminal networks have complex organizational structures, but whether this can be used to predict static and dynamic properties of criminal networks remains little explored. Here, by combining graph representation learning and machine learning methods, we show that structural properties of political corruption, police intelligence, and money laundering networks can be used to recover missing criminal partnerships, distinguish among different types of criminal and legal associations, as well as predict the total amount of money exchanged among criminal agents, all with outstanding accuracy. We also show that our approach can anticipate future criminal associations during the dynamic growth of corruption networks with significant accuracy. Thus, similar to evidence found at crime scenes, we conclude that structural patterns of criminal networks carry crucial information about illegal activities, which allows machine learning methods to predict missing information and even anticipate future criminal behavior.


Conflict of interest statement

The authors declare no competing interests.

Figures

Figure 1
Figure 1
Predicting partnerships in criminal networks. Visualizations of the criminal networks related to (A) Spanish corruption cases, (B) Brazilian corruption cases, and (C) Brazilian criminal intelligence network. In corruption networks, nodes represent people involved in corruption scandals, and connections indicate people participating in the same corruption case. In its turn, nodes in the criminal intelligence network represent people investigated by the Brazilian Federal Police, and an edge between two individuals indicates some co-participation (unlawful or lawful) uncovered by police investigations. (D) Accuracy of logistic classifiers trained for predicting missing links with node2vec representations of nodes and different binary operators. The bars stand for the average accuracy estimated from test sets over ten realizations of the embedding and training processes (error bars represent one standard deviation). The test sets are generated by randomly removing 10% of network edges and sampling the same number of false connections. The horizontal dashed lines represent the baseline accuracy (0.5). (E) Accuracy of logistic classifiers as a function of the fraction of nodes in the training set for each criminal network. The markers represent the average accuracy estimated from test sets over ten realizations of the embedding and training processes with the Hadamard operator (shaded regions stand for one standard deviation band).
Figure 2
Figure 2
Determining the types of association in criminal networks. (A) Visualization of the three different types of association among people in the giant component of the Brazilian criminal intelligence network. Edges in red, blue, and green represent criminal relationships, mixed relationships, and non-criminal relationships, respectively. (B) Accuracy of k-nearest neighbor classifiers (kNN with k=1) trained with node2vec representations and different binary operators. The bars stand for the average accuracy estimated from test sets over ten realizations of the embedding and training processes (error bars represent one standard deviation). The gray continuous line represents the accuracy of a dummy classifier that makes random predictions based on the relative frequency of each type of association in the training set, and the black dashed line indicates the accuracy of a dummy classifier that always predicts the most common type of association in the training set (criminal edge). (C) Confusion matrix associated with the kNN classifier predictions (with k=1 and the Hadamard operator) for the type of criminal associations in the test sets (rows indicate true labels). (D) Average accuracy in the test sets as a function of the number of neighbors (k) in the kNN classifiers. (E) Average accuracy in the test sets as a function of the fraction of edges in the training sets. In the last two panels, the solid lines indicate the average accuracy, and the shaded regions stand for one standard deviation band estimated over ten realizations of the embedding and training processes with the Hadamard operator.
Figure 3
Figure 3
Predicting the total amount of money exchanged among agents of the criminal financial network. (A) Visualization of the criminal financial network. Nodes represent agents (people or companies) and edges indicate financial transactions. The thicker the edge and lighter its color, the larger the amount exchanged between a pair of nodes. (B) Coefficient of determination (R2 score) of the association between the logarithm of the predicted and observed amounts of money exchanged between pairs of nodes in the test sets. These predictions are obtained using k-nearest neighbor regressors (kNN with k=6) trained with node2vec representations of edges and different binary operators. The bars stand for the average accuracy and error bars represent one standard deviation over ten realizations of the embedding and training processes. The gray continuous line represents the accuracy of a baseline regressor that always predicts the average value of the training set, and the black dashed line represents the accuracy of another dummy regressor that always predicts the median of the training set. (C) A typical example of the relationship between the base-10 logarithm of the predicted and observed amounts of money exchanged between pairs of nodes in the test sets obtained with a kNN regressor (k=6) trained with node2vec representations of edges and the Hadamard operator. The dashed line represents the 1:1 relationship. (D) Average R2 score as a function of the number of neighbors (k) in the kNN regressors estimated from the test sets. The vertical dashed line indicates the optimal number of neighbors (k=6). (E) Average R2 score on the test sets as a function of the fraction nodes in the training sets. In the last two panels, the solid lines indicate the average R2 score, and the shaded regions stand for one standard deviation band estimated over ten realizations of the embedding and training processes with the Hadamard operator.
Figure 4
Figure 4
Predicting future partnerships in corruption networks. The central panel shows the accuracy in tasks of predicting future partnerships in the Spanish (red circles) and Brazilian (blue squares) corruption networks created considering scandals occurring up to a given year. The results for the Spanish network use the Hadamard operator, while the ones related to the Brazilian network use the average operator for creating vector representations of edges from the node embeddings obtained with node2vec. The test sets of both networks comprise edges among nodes already present in the network that emerge after the threshold year, and the same number of randomly generated false links that do not appear after the threshold year. The markers represent the average accuracy in the test sets estimated over ten realizations of the embedding and training processes (shaded regions stand for one standard deviation band) for different threshold years. The black dashed line indicates the baseline accuracy. The insets depict network visualizations where the colored edges represent connections among nodes that occurred up to the threshold year, while the gray edges represent the links that will appear after the threshold year. These insets also show confusion matrices associated with the tasks of predicting whether future links are true (rows) or false (columns).

References

    1. D’Orsogna MR, Perc M. Statistical physics of crime: A review. Phys. Life Rev. 2015;12:1–21. doi: 10.1016/j.plrev.2014.11.001. - DOI - PubMed
    1. Jusup M, et al. Social physics. Phys. Rep. 2022;948:1–148. doi: 10.1016/j.physrep.2021.10.005. - DOI
    1. Luna-Pla I, Nicolás-Carlock JR. Corruption and complexity: A scientific framework for the analysis of corruption networks. Appl. Netw. Sci. 2020;5:13. doi: 10.1007/s41109-020-00258-2. - DOI
    1. Kertész J, Wachs J. Complexity science approach to economic crime. Nat. Rev. Phys. 2021;3:70–71. doi: 10.1038/s42254-020-0238-9. - DOI
    1. Granados OM, Nicolás-Carlock JR, editors. Corruption Networks: Concepts and Applications. Cham: Springer; 2021.

Publication types