. 2022 Oct;610(7930):182-189.
doi: 10.1038/s41586-022-05235-6. Epub 2022 Sep 21.

Antibody targeting of E3 ubiquitin ligases for receptor degradation

Affiliations

Antibody targeting of E3 ubiquitin ligases for receptor degradation

Hadir Marei et al. Nature. 2022 Oct.

Abstract

Most current therapies that target plasma membrane receptors function by antagonizing ligand binding or enzymatic activities. However, typical mammalian proteins comprise multiple domains that execute discrete but coordinated activities. Thus, inhibition of one domain often incompletely suppresses the function of a protein. Indeed, targeted protein degradation technologies, including proteolysis-targeting chimeras1 (PROTACs), have highlighted clinically important advantages of target degradation over inhibition2. However, the generation of heterobifunctional compounds binding to two targets with high affinity is complex, particularly when oral bioavailability is required3. Here we describe the development of proteolysis-targeting antibodies (PROTABs) that tether cell-surface E3 ubiquitin ligases to transmembrane proteins, resulting in target degradation both in vitro and in vivo. Focusing on zinc- and ring finger 3 (ZNRF3), a Wnt-responsive ligase, we show that this approach can enable colorectal cancer-specific degradation. Notably, by examining a matrix of additional cell-surface E3 ubiquitin ligases and transmembrane receptors, we demonstrate that this technology is amendable for 'on-demand' degradation. Furthermore, we offer insights on the ground rules governing target degradation by engineering optimized antibody formats. In summary, this work describes a strategy for the rapid development of potent, bioavailable and tissue-selective degraders of cell-surface proteins.


Conflict of interest statement

All authors are current or former employees of Genentech.

Figures

Fig. 1
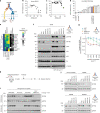
Fig. 1. The Wnt-responsive E3 ubiquitin ligases RNF43 and ZNRF3 can degrade IGF1R.
a, Left, CRISPR–Cas9 strategy used to generate APC mutant organoids. Right, phase-contrast images of wild-type (WT) and APC truncation mutant (Apc−/−) colon organoids. Data are representative of two independent experiments. Scale bars, 250 μm. b, Gene expression analysis of wild-type and Apc−/− colon organoids. Genes encoding proteins with predicted transmembrane domains (TM) (grey), E3 ubiquitin (Ub) ligases (light blue) or both (dark blue) are shown. Data are the mean expression from three independent experiments. FC, fold change; FDR, false discovery rate. c, In situ hybridization in AKPS colon organoids probing for Rnf43 and Znrf3. Data are representative of two independent experiments. Scale bars, 50 μm. d, Schematic representation of the iDimerize construct. HA, haemagglutinin tag. e, Levels of total and immunoprecipitated IGF1R and RNF43 following HA tag immunoprecipitation (IP) following treatment of HEK293T cells harbouring the RNF43–IGF1R iDimerize construct with the A/C heterodimerizer. f, Schematic representation of gD-based PROTAB-mediated IGF1R degradation. g, Levels of cell-surface IGF1R assessed by flow cytometry following treatment of HT29 cells expressing gD–RNF43–Flag or gD–ZNRF3–Flag with 10 μg ml−1 of the indicated gD-based PROTABs for 48 h. Graphs depict IGF1R clearance from four independent experiments. Data are mean ± s.e.m., with values from individual biological repeats overlaid. h,i, Levels of IGF1Rβ following treatment of parental HT29 cells or cells expressing gD–RNF43–Flag (h) or gD–ZNRF3–Flag (i) with 0.5 μg ml−1 of the indicated PROTABs for 24 h. In e,h,i, α-tubulin was used as a loading control. Data are representative of three independent experiments. IGF1R-binding antibodies: Cixu, cixutumumab; Figi, figitumumab; Gani, ganitumab; h10H5.V1; Istira, istiratumab; Roba, robatumumab; Tepro, teprotumumab. For gel source data, see Supplementary Fig. 1. Source data
Fig. 2
Fig. 2. Tethering endogenous RNF43 or ZNRF3 to IGF1R induces target internalization and degradation.
a, Schematic representation of ligase-based PROTAB-mediated IGF1R degradation.b,c, Levels of cell-surface IGF1R assessed by flow cytometry following treatment of HT29 cells expressing gD–RNF43–Flag (b) or gD–ZNRF3–Flag (c) with campaign PROTABs for 24 h. Graphs depict IGF1R clearance versus bivalent affinities of ligase campaign antibodies from one high-throughput FACS screening campaign. d, Levels of cell-surface IGF1R following treatment of HT29 HiBiT-IGF1R knock-in (KI) cells with ZNRF3*IGF1R bispecific PROTABs for 24 h. The graph depicts IGF1R clearance from one screening campaign with values from technical repeats overlayed. Assay controls and PROTABs used subsequently are highlighted. e, Levels of IGF1R-β following treatment of various CRC cell lines with indicated antibodies for 24 h. Per cent degradation is normalized to Cixu*NIST treatment and is the average of two independent experiments. Expression levels of key genes are indicated. CPM, counts per minute. f, Levels of total and phosphorylated IGF1Rβ, AKT and S6 following treatment of SW48 cells with 2 μg ml−1 of the indicated antibodies for 24 h with or without IGF1 stimulation for 20 min. α-Tubulin was used as a loading control. Data are representative of three independent experiments. g, Viability of SW48 cells following treatment with indicated antibodies for six days. Data are mean ± s.e.m. from three independent experiments. h, Schematic representation of SW48 xenograft in vivo model. i, Levels of IGF1Rβ in SW48 xenografts and normal colon tissues 48 h after intraperitoneal administration of 1 μg ml−1 of indicated antibodies. GAPDH was used as a loading control. n = 4 animals per group. j, Levels of IGF1Rβ following treatment of normal or tumour-derived organoids treated with 1 μg ml−1 of indicated antibodies for 24 h. GAPDH was used as a loading control. Data are representative of two independent experiments. For gel source data, see Supplementary Fig. 1. Source data
Fig. 3
Fig. 3. ZNRF3*IGF1R bispecific PROTABs induce target degradation in a ligase-dependent manner.
a, Clearance of IGF1R in cells treated with PROTABs (Fig. 2e) versus the basal IGF1R:ZNRF3 cell-surface ratio determined by copy number analysis (Extended Data Fig. 3a,b). b, Levels of cell-surface ZNRF3 in indicated cell lines. Data are representative of two independent experiments. c, Levels of IGF1Rβ in HT29 cells endogenously expressing wild-type or indicated ZNRF3 indels following treatment with 10 μg ml−1of the indicated PROTABs for 24 h. β-Tubulin was used as a loading control. Data are representative of two independent experiments. d, Levels of IGF1Rβ and ubiquitin in SW48 cells treated with DMSO or E1 inhibitor MLN7243 for 2 h followed by PROTAB treatment for 6 h. Data are representative of three independent experiments. e, Levels of total and immunoprecipitated IGF1Rβ and ubiquitin in HT29 cells subjected to denaturing IGF1Rβ immunoprecipitation (IP) following treatment with indicated antibodies for 2 h. Data are representative of two independent experiments. f, Levels of IGF1Rβ, ubiquitin and LC3B in SW48 cells treated with DMSO, the proteasome inhibitor MG132 or the lysosomal pathway inhibitor bafilomycin A1 (BafA1) for 2 h followed by PROTAB treatment for 6 h. Data are representative of three independent experiments. In df, α-tubulin was used as a loading control. g, Quantitative proteomic analysis of SW48 cells treated with indicated antibodies for 24 h. Volcano plots depict the average abundance fold change of 8,173 proteins from four independent experiments. h, Levels of Wnt-related gene transcripts in intestinal tissue from mice treated with indicated antibodies for 24 h. Data are mean ± s.e.m. with values from individual mice overlaid. n = 4 mice per group. i, Intestinal architecture of mice treated with indicated antibodies for 7 days. n = 4 mice per group. Scale bars, 100 μm. For gel source data, see Supplementary Fig. 1. Source data
Fig. 4
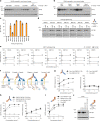
Fig. 4. Multiple cell-surface E3 ubiquitin ligases can degrade plasma membrane targets.
a,b, Levels of HER2 (a) and PD-L1 (b) in SW48 xenografts 48 h after intraperitoneal administration with indicated antibodies. GAPDH was used as a loading control. n = 4 mice per group. c, Frequency of detectable cell-surface gD epitopes in HT29 cells expressing indicated gD–ligase–Flag constructs versus parental cells. Graph depicts gD-positive cells from three independent experiments. Data are mean ± s.e.m. with values from biological repeats overlaid. d, Levels of IGF1Rβ in HT29 cells expressing indicated gD–ligase–Flag constructs following treatment with specified antibodies for 24 h. Data are representative of three independent experiments. e, Levels of cell-surface FZD5 in ASPC1 cells expressing indicated gD–ligase–Flag constructs following antibody treatment at 1 or 10 µg ml−1 for 24 h. Data are presented as lines connecting mean values from two independent experiments with values from biological repeats overlaid. f, Schematic representation of PROTAB antibody engineering and the effect on downstream degradation. gi, Levels of cell-surface IGF1R and RNF43 assessed by flow cytometry in HT29 cells expressing gD–RNF43–Flag following treatment with various antibody formats for 24 h: 2 (target) + 1 (ligase) (g), 2 (ligase) + 1 (target) (h), or one-arm Fv–IgG (i). The 2 (target) + 1 (ligase) and 2 (ligase) + 1 (target) antibodies are referred to as ‘2+1 Fab–IgGs’. Graphs depict IGF1R or RNF43 clearance from three independent experiments. Data are mean ± s.e.m. For gi, samples were processed simultaneously using Cixu*NIST and Cixu*RNF43-37.39 as common controls for two (g,i) or three (g,h) biological repeats. j, Levels of IGF1R in DLD1 cells treated with indicated antibodies for 24 h. α-Tubulin was used as a loading control. Data are representative of two independent experiments. For gel source data and molecular masses of gD–ligase–Flag proteins in d, see Supplementary Fig. 1. Source data
Extended Data Fig. 1
Extended Data Fig. 1. Dimerization of IGF1R to the Wnt-responsive E3 ubiquitin ligases RNF43 and ZNRF3 leads to IGF1R degradation.
a) Comparative gene set enrichment analysis of wild type (WT) and APC truncation mutant (Apc−/−) colon organoids highlighting MSigDB C2 Wnt pathway gene sets from three independent experiments. b) RNA expression profile of indicated E3 ubiquitin ligases with predicted transmembrane domains in healthy control and colon adenomas. Box plots represent data distribution (minimum, first quartile, median, third quartile and maximum) with individual gene probes overlayed from 8 independent healthy control and 15 colon adenoma samples. c) Heatmap depicting RNF43 and ZNRF3 TCGA RNA expression profile in human tumors compared to their respective normal tissues. d) Schematic representation of iDimerize technology utilized to chemically induce the interaction of C-terminally DmrA-HA-tagged RNF43 or ZNRF3 with C-terminally DmrC-FLAG-tagged IGF1R following treatment with the A/C heterodimerizer. e) Western blot lysate analysis from HEK293T cells co-expressing C-terminally DmrA-HA-tagged ZNRF3 and C-terminally DmrC-FLAG-tagged IGF1R subjected to HA immunoprecipitation (IP) following no treatment (-) or 24 h treatment with indicated A/C heterodimerizer concentrations. Precipitated and total DmrA-HA-tagged ZNRF3 and DmrC-FLAG-tagged IGF1R were detected. α-TUBULIN was used as a loading control. Data are representative of three independent experiments. f) Summary of Surface Plasmon Resonance (SPR) analysis of IGF1R bivalent antibodies binding to purified human IGF1R. Graph depicts bivalent antibody affinity to human IGF1R detected using Biacore T200 at 37 °C in HBSEP buffer with representative sensorgrams from three independent experiments. Data are presented as mean ± s.e.m. with values from biological repeats overlaid. For Gani one outlier data point was excluded. g) Epitope binning analysis of IGF1R bivalent antibodies binding to purified human IGF1R. For (f and g) IGF1R bivalent antibodies were tested (Cixu = Cixutumumab; Figi = Figitumumab; Gani = Ganitumab; h10H5.V1; Istira = Istiratumab; Roba = Robatumumab; Tepro = Teprotumumab). For gel source data, see Supplementary Fig. 2. Source data
Extended Data Fig. 2
Extended Data Fig. 2. RNF43 and ZNRF3 bivalent antibody campaigns facilitate rational design of ligase-based bispecific PROTABs that tether endogenous RNF43 or ZNRF3 to IGF1R.
a) SPR analysis of RNF43 or ZNRF3 bivalent antibodies from rabbit and rat antibody campaigns binding to purified human RNF43 or ZNRF3 extracellular domain. Graph depicts KD values of individual campaign antibodies from one high throughput screen and line as the mean value per campaign. b) Schematic representation of HiBiT-LgBiT Nano-luciferase technology. Endogenous IGF1R was N-terminally tagged with HiBiT. Incubation of live cells with LgBiT and substrate allows HiBiT-LgBiT Nano-luciferase reconstitution and substrate catalysis. This can be quantified using luminescence as a proxy for IGF1R cell-surface levels. c) IGF1R cell-surface clearance in HT29 HiBiT-IGF1R knock-in (KI) cells subjected to LgBiT + substrate incubation following 24 h treatment with RNF43*IGF1R bispecific PROTABs. Graph depicts IGF1R clearance (%) from one screening campaign with values from technical repeats overlaid. Assay controls and PROTABs used subsequently are highlighted. d, e) IGF1R cell-surface clearance in HT29 HiBiT-IGF1R KI cells subjected to LgBiT + substrate incubation following treatment with indicated antibodies. Graphs depict IGF1R clearance (%) time kinetics (top) or dose response (bottom) (d) and impact of dosing, recovery and redosing (e) from two independent experiments. Data are presented as non-linear curves (d and e) and mean (e) with values from biological repeats overlaid. f, g) Western blot lysate analysis from SW1417 (f) or RKO (g) cells left untreated (-) or subjected to indicated antibodies for 48 h. Endogenous IGF1R-β was detected. α and β-TUBULIN were used as loading controls. Data are representative of three independent experiments. h) Flow cytometry histograms of PE signal in HT29 wildtype (WT), RNF43 Knock Out (KO) or ZNRF3 KO cells stained with an antibody against RNF43, ZNRF3 or the matched isotype control from two independent experiments. i) Western blot lysate analysis from HT29 WT, RNF43 KO or ZNRF3 KO cells that were left untreated (-) or subjected to indicated antibodies for 24 h. Endogenous IGF1R-β protein was detected. β-TUBULIN was used as a loading control. Data are representative of two independent experiments. j) Western blot lysate analysis from SW48 xenograft in vivo tumours derived from mice left untreated (-) or subjected to indicated antibodies for 72 h. Endogenous IGF1R-β was detected. GAPDH was used as a loading control. N = 4 animals per group. k) Mice bodyweight following treatment with indicated antibodies for 7 days. Graph depicts changes of bodyweight (% of day 0) over time from four animals per group. Data are presented as mean ± s.e.m. For gel source data, see Supplementary Fig. 2. Source data
Extended Data Fig. 3
Extended Data Fig. 3. ZNRF3 cell-surface levels and catalytic activity mediate IGF1R ubiquitylation and degradation induced by ZNRF3*IGF1R bispecific PROTABs.
a, b) Anti-IGF1R Cixu (a) or anti-ZNRF3 ZNRF3–55 (b) bivalent antibodies saturation assay in LS180 cells. Graphs depict bound target antibody in counts per minute (CPM) versus concentration of total antibody. Data are presented as one-site specific binding curves fitted to mean values from three technical repeats. c, d) Indel representation in genetically engineered HT29 ZNRF3 N-term(i) (c) or HT29 ZNRF3 RING(i) (d) cells. Graphs depict the percentage of various indel sizes in HT29 pooled cells from two independent analyses. e) Western blot lysate analysis from doxycycline-treated parental HEK293T, doxycycline-inducible WT or delta RING (ΔRING) gD-ZNRF3-FLAG cells left untreated (-) or subjected to indicated antibodies for 24 h. Endogenous IGF1R-β and exogenous gD-ZNRF3-FLAG were detected. Data are representative of two independent experiments. f) Western blot lysate analysis from parental HEK293T, doxycycline-inducible WT or ΔRING gD-ZNRF3-FLAG cells subjected to FLAG immunoprecipitation (IP). Precipitated and total gD-ZNRF3-FLAG and LRP6 were detected. Data are representative of three independent experiments. g) Western blot lysate analysis from DLD1 cells subjected to denaturing IGF1R-β IP following treatment with indicated antibodies for 2 h. Precipitated and total endogenous IGF1R-β and ubiquitin were detected. Data are representative of two independent experiments. For (e-g) α-TUBULIN was used as a loading control. h) Normalized protein intensities for depicted proteins across various antibody treatments in SW48 cells. Box plots represent data distribution (minimum, first quartile, median, third quartile and maximum) with biological repeats overlaid from four independent experiments. The lower whisker is the smallest normalized log2 intensities or equal to lower bound of box - 1.5*IQR (Interquantile range = 75% quantile − 25% quantile). The upper whisker is the largest normalized log2 intensities or equal to upper bound of box + 1.5*IQR (minimum, first quartile, median, third quartile and maximum). Fold changes are the difference between the means of four biological repeats per condition; * = adjusted p-value < 0.05, ** = adjusted p-value < 0.005. To test the two-sided null hypothesis of no changes in abundance, the model-based test statistics were compared with the Student t-test distribution with the degrees of freedom appropriate for each protein and each dataset by MSstatsTMT R package. The resulting p-values were adjusted to control the FDR with the method by Benjamini-Hochberg. IGF1R, adj.pvalue = 0.00004 for ZNRF3_55 vs Untreated, adj.pvalue = 0.032 for CIXU vs Untreated, adj.pvalue = 0.6256 for NIST vs Untreated, adj.pvalue = 0.0329 for ZNRF3_55 vs CIXU, LRP10, adj.pvalue = 5.27e-7 for ZNRF3_55 vs Untreated, adj.pvalue = 0.0007 for CIXU vs Untreated, adj.pvalue = 0.9309 for NIST vs Untreated, adj.pvalue = 0.0093 for ZNRF3_55 vs CIXU. FZD7, adj.pvalue = 3.76e-10 for ZNRF3_55 vs Untreated, adj.pvalue = 1.46e-6 for CIXU vs Untreated, adj.pvalue = 0.3828 for NIST vs Untreated, adj.pvalue = 2.34e-5 for ZNRF3_55 vs CIXU. i) Wnt signaling activity measured in TCF luciferase HEK293 cells subjected to indicated antibodies. RSPO3 and GSK3beta were used as positive Wnt agonists. Data are presented as mean ± s.d. with values from individual technical repeats from one experiment overlaid. Graph is representative of two independent experiments. For gel source data, see Supplementary Fig. 2. Source data
Extended Data Fig. 4
Extended Data Fig. 4. ZNRF3 PROTABs targeting endogenous HER2 and PD-L1 induce target degradation.
a) Western blot lysate analysis from SW48 cells left untreated (-) or subjected to indicated antibodies for 48 h. Data are representative of three independent experiments. b) Western blot lysate analysis of healthy or tumor-derived organoids treated with indicated antibodies for 24 h. Data are representative of two independent experiments. For (a and b) endogenous HER2 was detected. α-TUBULIN and GAPDH were used as loading controls. c) Western blot lysate analysis from SW48 cells left untreated (-) or subjected to indicated antibodies for 24 h. Endogenous PD-L1 was detected. VINCULIN was used as a loading control. Data are representative of three independent experiments. d) Western blot lysate analysis from SW48 cells subjected to DMSO or E1 inhibitor MLN7243 2 h pre-treatment followed by the ZNRF3–55*PD-L1 bispecific PROTAB for 6 h. Endogenous PD-L1 and ubiquitin were detected. e) Western blot lysate analysis from SW48 cells subjected to DMSO, the proteasome inhibitor MG132 or the lysosomal pathway inhibitor Bafilomycin A1 (Baf A1) 2 h pre-treatment followed by the ZNRF3–55*PD-L1 bispecific PROTAB for 6 h. Endogenous PD-L1, ubiquitin and LC3B were detected. For (d and e) α-TUBULIN was used as a loading control. Data are representative of two independent experiments. For gel source data, see Supplementary Fig. 2.
Extended Data Fig. 5
Extended Data Fig. 5. Identification of cell-surface E3 ubiquitin ligases and altering PROTABs format facilitate platform expansion.
a) Venn diagram depicting bioinformatics analysis to identify putative cell-surface E3 ubiquitin ligases based on having a signal peptide, transmembrane domain and whether they have been shown or are predicted to localize to the plasma membrane. b) Dendrogram of known E3 ubiquitin ligases clustered based on sequence homology highlighting a subset of putative cell-surface E3 ubiquitin ligases that were tested for cell-surface expression and applicability as PROTAB degraders. c) Western blot lysate analysis from indicated doxycycline-treated HT29 doxycycline-inducible gD-ligase-FLAG cells following no treatment (-) or 24 h incubation with indicated antibodies. Endogenous IGF1R-β and exogenous gD-ligase-FLAG proteins were detected. Data are representative of three independent experiments. d) Western blot lysate analysis from indicated doxycycline-treated HT29 doxycycline-inducible gD-ligase-FLAG cells following no treatment (-) or 24 h incubation with indicated antibodies. Endogenous HER2 and exogenous gD-ligase-FLAG proteins were detected. Data are representative of two independent experiments. e) Western blot lysate analysis from indicated doxycycline-treated SW48 doxycycline-inducible gD-ligase-FLAG cells following no treatment (-) or 48 h incubation with indicated antibodies. Endogenous PD-L1 and exogenous gD-ligase-FLAG proteins were detected. Data are representative of three independent experiments. f) Heatmap depicting expression of indicated cell-surface E3 ubiquitin ligases across normal tissues (source GTEX). Data is z-score normalized. g) IGF1R cell-surface clearance in HT29 HiBiT-IGF1R KI cells subjected to LgBit + substrate incubation following treatment with indicated antibodies for 24 h. Graph depicts IGF1R clearance (%) from two independent experiments. Data are presented as mean with values from biological repeats overlaid. h, i) IGF1R cell-surface clearance in HT29 HiBiT-IGF1R KI cells subjected to LgBiT + substrate incubation following treatment with indicated RNF43*IGF1R PROTAB bispecific or one-arm Fv-IgG format. Graphs depict IGF1R clearance (%) time kinetics (h) or dose response (i) from two independent experiments. Data are presented as non-linear curves with values from biological repeats overlaid. For gel source data and molecular weight sizes of gD-ligase-FLAG in (c–e), see Supplementary Fig. 2. Source data

Comment in

  • Developing antibody-based PROTACs.
    Crunkhorn S. Crunkhorn S. Nat Rev Drug Discov. 2022 Nov;21(11):795. doi: 10.1038/d41573-022-00159-2. Nat Rev Drug Discov. 2022. PMID: 36171334 No abstract available.

References

    1. Sakamoto KM, et al. Protacs: chimeric molecules that target proteins to the Skp1–Cullin–F box complex for ubiquitination and degradation. Proc. Natl Acad. Sci. USA. 2001;98:8554–8559. doi: 10.1073/pnas.141230798. - DOI - PMC - PubMed
    1. Dale B, et al. Advancing targeted protein degradation for cancer therapy. Nat. Rev. Cancer. 2021;21:638–654. doi: 10.1038/s41568-021-00365-x. - DOI - PMC - PubMed
    1. Goracci L, et al. Understanding the metabolism of proteolysis targeting chimeras (PROTACs): the next step towards pharmaceutical applications. J. Med. Chem. 2020;63:11615–11638. doi: 10.1021/acs.jmedchem.0c00793. - DOI - PMC - PubMed
    1. Bondeson DP, et al. Catalytic in vivo protein knockdown by small-molecule PROTACs. Nat. Chem. Biol. 2015;11:611–617. doi: 10.1038/nchembio.1858. - DOI - PMC - PubMed
    1. Winter GE, et al. Phthalimide conjugation as a strategy for in vivo target protein degradation. Science. 2015;348:1376–1381. doi: 10.1126/science.aab1433. - DOI - PMC - PubMed