. 2022 Sep;609(7929):1021-1028.
doi: 10.1038/s41586-022-05215-w. Epub 2022 Sep 21.

Failure of human rhombic lip differentiation underlies medulloblastoma formation

Liam D Hendrikse #  1   2   3 Parthiv Haldipur #  4 Olivier Saulnier #  1   2 Jake Millman  4 Alexandria H Sjoboen  4 Anders W Erickson  1   2   5 Winnie Ong  1   2   5 Victor Gordon  6 Ludivine Coudière-Morrison  6 Audrey L Mercier  7 Mohammad Shokouhian  8 Raúl A Suárez  1   2 Michelle Ly  1   2   5 Stephanie Borlase  6 David S Scott  1   2 Maria C Vladoiu  1   2   5 Hamza Farooq  1   2   5 Olga Sirbu  1   2   3 Takuma Nakashima  9 Shohei Nambu  9 Yusuke Funakoshi  9 Alec Bahcheli  10   11 J Javier Diaz-Mejia  12 Joseph Golser  4 Kathleen Bach  4 Tram Phuong-Bao  8 Patryk Skowron  1   2   5 Evan Y Wang  1   2   3 Sachin A Kumar  1   2   5 Polina Balin  1   2   5 Abhirami Visvanathan  1   2 John J Y Lee  1   2   5 Ramy Ayoub  3 Xin Chen  1   2 Xiaodi Chen  1   2 Karen L Mungall  13 Betty Luu  1   2 Pierre Bérubé  14 Yu C Wang  14 Stefan M Pfister  15   16 Seung-Ki Kim  17 Olivier Delattre  18   19 Franck Bourdeaut  18   19 François Doz  18   20 Julien Masliah-Planchon  21 Wieslawa A Grajkowska  22 James Loukides  1 Peter Dirks  1   2   10   23 Michelle Fèvre-Montange  24   25 Anne Jouvet  25 Pim J French  26 Johan M Kros  27 Karel Zitterbart  28 Swneke D Bailey  29   30 Charles G Eberhart  31 Amulya A N Rao  32 Caterina Giannini  33 James M Olson  34 Miklós Garami  35 Peter Hauser  35 Joanna J Phillips  36   37 Young S Ra  38 Carmen de Torres  39 Jaume Mora  39 Kay K W Li  40 Ho-Keung Ng  40 Wai S Poon  41 Ian F Pollack  42 Enrique López-Aguilar  43 G Yancey Gillespie  44 Timothy E Van Meter  45 Tomoko Shofuda  46 Rajeev Vibhakar  47 Reid C Thompson  48 Michael K Cooper  49 Joshua B Rubin  50 Toshihiro Kumabe  51 Shin Jung  52 Boleslaw Lach  53   54 Achille Iolascon  55   56 Veronica Ferrucci  55   56 Pasqualino de Antonellis  55   56 Massimo Zollo  55   56 Giuseppe Cinalli  57 Shenandoah Robinson  58 Duncan S Stearns  59 Erwin G Van Meir  60 Paola Porrati  61 Gaetano Finocchiaro  61 Maura Massimino  61 Carlos G Carlotti  62 Claudia C Faria  63   64 Martine F Roussel  65 Frederick Boop  65 Jennifer A Chan  66 Kimberly A Aldinger  4   67 Ferechte Razavi  68 Evelina Silvestri  69 Roger E McLendon  70   71 Eric M Thompson  71 Marc Ansari  72   73 Maria L Garre  74 Fernando Chico  75 Pilar Eguía  75 Mario Pérezpeña  76 A Sorana Morrissy  66   77   78 Florence M G Cavalli  79   80   81 Xiaochong Wu  1   2 Craig Daniels  1   2 Jeremy N Rich  82 Steven J M Jones  13   83   84 Richard A Moore  13 Marco A Marra  13   83 Xi Huang  1   2   10 Jüri Reimand  3   10   11 Poul H Sorensen  85   86 Robert J Wechsler-Reya  87 William A Weiss  36   88   89 Trevor J Pugh  3   11   12 Livia Garzia  90 Claudia L Kleinman  91   92 Lincoln D Stein  10   93 Nada Jabado  94   95 David Malkin  3   96 Olivier Ayrault  7 Jeffrey A Golden  97 David W Ellison  98 Brad Doble  8 Vijay Ramaswamy  1   2   3   96 Tamra E Werbowetski-Ogilvie  6   99 Hiromichi Suzuki  9 Kathleen J Millen  4 Michael D Taylor  100   101   102   103   104
Affiliations

Failure of human rhombic lip differentiation underlies medulloblastoma formation

Liam D Hendrikse et al. Nature. 2022 Sep.

Erratum in

  • Author Correction: Failure of human rhombic lip differentiation underlies medulloblastoma formation.
    Hendrikse LD, Haldipur P, Saulnier O, Millman J, Sjoboen AH, Erickson AW, Ong W, Gordon V, Coudière-Morrison L, Mercier AL, Shokouhian M, Suárez RA, Ly M, Borlase S, Scott DS, Vladoiu MC, Farooq H, Sirbu O, Nakashima T, Nambu S, Funakoshi Y, Bahcheli A, Diaz-Mejia JJ, Golser J, Bach K, Phuong-Bao T, Skowron P, Wang EY, Kumar SA, Balin P, Visvanathan A, Lee JJY, Ayoub R, Chen X, Chen X, Mungall KL, Luu B, Bérubé P, Wang YC, Pfister SM, Kim SK, Delattre O, Bourdeaut F, Doz F, Masliah-Planchon J, Grajkowska WA, Loukides J, Dirks P, Fèvre-Montange M, Jouvet A, French PJ, Kros JM, Zitterbart K, Bailey SD, Eberhart CG, Rao AAN, Giannini C, Olson JM, Garami M, Hauser P, Phillips JJ, Ra YS, de Torres C, Mora J, Li KKW, Ng HK, Poon WS, Pollack IF, López-Aguilar E, Gillespie GY, Van Meter TE, Shofuda T, Vibhakar R, Thompson RC, Cooper MK, Rubin JB, Kumabe T, Jung S, Lach B, Iolascon A, Ferrucci V, de Antonellis P, Zollo M, Cinalli G, Robinson S, Stearns DS, Van Meir EG, Porrati P, Finocchiaro G, Massimino M, Carlotti CG, Faria CC, Roussel MF, Boop F, Chan JA, Aldinger KA, Razavi F, Silvestri E, McLendon RE, Thompson EM, Ansari M, Garre ML, Chico F, Eguía P, Pérezpeña M, Morrissy AS, Cavalli… See abstract for full author list ➔ Hendrikse LD, et al. Nature. 2022 Dec;612(7940):E12. doi: 10.1038/s41586-022-05578-0. Nature. 2022. PMID: 36446943 Free PMC article. No abstract available.

Abstract

Medulloblastoma (MB) comprises a group of heterogeneous paediatric embryonal neoplasms of the hindbrain with strong links to early development of the hindbrain1-4. Mutations that activate Sonic hedgehog signalling lead to Sonic hedgehog MB in the upper rhombic lip (RL) granule cell lineage5-8. By contrast, mutations that activate WNT signalling lead to WNT MB in the lower RL9,10. However, little is known about the more commonly occurring group 4 (G4) MB, which is thought to arise in the unipolar brush cell lineage3,4. Here we demonstrate that somatic mutations that cause G4 MB converge on the core binding factor alpha (CBFA) complex and mutually exclusive alterations that affect CBFA2T2, CBFA2T3, PRDM6, UTX and OTX2. CBFA2T2 is expressed early in the progenitor cells of the cerebellar RL subventricular zone in Homo sapiens, and G4 MB transcriptionally resembles these progenitors but are stalled in developmental time. Knockdown of OTX2 in model systems relieves this differentiation blockade, which allows MB cells to spontaneously proceed along normal developmental differentiation trajectories. The specific nature of the split human RL, which is destined to generate most of the neurons in the human brain, and its high level of susceptible EOMES+KI67+ unipolar brush cell progenitor cells probably predisposes our species to the development of G4 MB.


Conflict of interest statement

COMPETING INTERESTS: The authors declare no competing interests.

Figures

Extended Data Fig.1 |
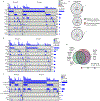
Extended Data Fig.1 |. Mutations and copy number losses targeting the same genes are mutually exclusive in G3 and G4 MB.
a, b, c, Oncoprint summarizing gene mutations and copy number losses in their corresponding genomic loci (chromosome arm) for CHD (a), FANC (b) and ELP (c) driver families. Mutations are less frequent than copy number losses but tend to occur independently suggesting they are targets of the deletions. d, Mutual exclusivity of mutation and copy number loss events targeting genes in the CHD, FANC, and ELP families. e, Overlap between events targeting CHD, FANC, or ELP genes. Most G4 MB tumors are haploinsufficient for genes in at least two families through a single deletion event.
Extended Data Fig.2 |
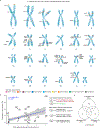
Extended Data Fig.2 |. Clustering of G4 MB driver genes in the human genome predisposes humans to develop MB.
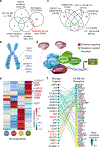
a, Cartoon of the Homo sapiens genome with the locations of known and newly identified G3 and G4 MB candidate driver genes demonstrating clustering of genes at locations known to be deleted in G3 and G4 MB. b, Frequency of whole chromosome arm loss is significantly correlated with the number of driver gene families—as detailed in (a)—contained on the arm. Significance was assessed by a two-sided linear regression model; grey shaded area denotes the 95% confidence interval. c, Mutual exclusivity of copy number losses of chromosome arms 17p, 16q, and 8q. Significance was assessed using the impurity test for mutual exclusivity, implemented in the R package DISCOVER.
Extended Data Fig.3 |
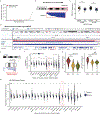
Extended Data Fig.3 |. CBFA2T3 is a G4 MB tumor suppressor gene.
a, PRDM6 expression in CBFA2T2 mutant (red) and CBFA2T2 WT (grey) G3 and G4 MB samples demonstrates that enhancer hijacking mediated PRDM6 expression is largely limited to CBFA2T2 WT cases. b, Density of regions of chromosomal gain and loss along human chromosome 16q in G3 and G4 MB cases, demonstrating that deletions are biased towards the telomeric end of 16q, the location of known drivers, particularly CBFA2T3. c, CBFA2T3 expression differences between samples with and without CBFA2T3 deletions, split by subgroup. Statistical significance was assessed using Kruskal-Wallis rank-sum test (FDR < 0.05), *** p < 0.0005, G3, p = 2.88e−05; G4, p = 2.60e-09. G3, n = 112; G4, n = 206. CBFA2T3 is a copy-number responsive tumor suppressor gene in G4 MB. d, IGV analysis showing focal deleted region in two G4 MB samples MB-0364 and MB-0559. MB-0364, which is the minimal common deleted region (MCDR) on 16q in G3 and G4 MB, though does not quite achieve statistical significance in the GISTIC analysis. MB-0559 is the MCDR achieving statistical significance in GISTIC analysis. CBFA2T3 is identified with a red box. e, Cartoon illustrating the MCDR concept. f, Expression differences between copy neutral or hemizygously deleted G3 and G4 MB samples for genes within the MB-0364 MCDR on chr16q24.3. Statistical significance was assessed using two-sided Mann-Whitney U tests with FDR adjustment, * p < 0.05, *** p < 0.0005. Deletion, n = 86; Neutral, n = 232. e, Expression differences between copy neutral or hemizygously deleted G3 and G4 MB samples for genes within the MB-0559 MCDR on chr16q24.3. Statistical significance was assessed using two-sided Mann-Whitney U tests with FDR adjustment, * p < 0.05, *** p < 0.0005. Deletion, n = 86; Neutral, n = 232. A full list of p values for genes presented in (f) and (g) can be found in Supplementary Data Table 1. h, CBFA2T2 (left) and CBFA2T3 (right) expression in SHH, G3, and G4 MB by bulk RNAseq. Statistical significance was assessed by Kruskal-Wallis rank-sum test (FDR < 0.05), * p < 0.05, *** p < 0.0005. For CBFA2T2: SHH-G3, p = 2.29e−47; SHH-G4, p = 4.42e−73; G3-G4, p = 0.035. For CBFA2T3: SHH-G3, p = 7.10e−42; SHH-G4, p = 1.13e−46; G3-G4, p = 0.61. G3, n = 219; G4, n = 326; SHH, n = 250. While CBFA2T2 and CBFA2T3 are recurrently targeted and have low expression in G3 and G4 MB, high expression of both genes and an absence of alterations are observed in SHH MB. CBFA2T2 and CBFA2T3 likely have different roles in SHH MB compared to G3 and G4 MB. For c, f, g, and h box plots show the median and interquartile range, and whiskers show the data range. Points outside this range are outliers and are plotted individually.
Extended Data Fig.4 |
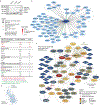
Extended Data Fig.4 |. The CBFA polyprotein complex contains multiple known and novel G4 MB driver genes.
a, Western blot showing successful expression of the TurboID-CBFA2T2 fusion protein when the TurboID construct is fused to the N-terminal of CBFA2T2, but not to the C-terminal. b, Protein-protein interaction (PPI) network of novel CBFA2T2 interacting proteins. Each node represents a protein and edges between the proteins represent known or novel PPIs. Edges in red represent known interactions between CBFA2T2 interacting proteins, and edges in green represent known interactions with CBFA2T2 that were recapitulated in our TurboID screen. Proteins are grouped with dashed lines if they contain known interactions between each other. c, Significant CBFA2T2 prey proteins enriched in each indicated biological process. GLI2 is a SHH oncogene and has been recently shown to maintain GCP proliferation and identity, implicating the CBFA complex. d, Enrichment map of biological processes (GO:BP) enriched in CBFA2T2 prey proteins by TurboID. Each node represents a significantly enriched pathway and edges represent shared genes between nodes. Nodes are grouped and labelled with a common biological theme. Significance was assessed using G:Profiler with FDR correction. e, Protein-protein interaction (PPI) network of CBFA2T2 TurboID proteins and G3/G4 MB driver genes (Fig. 1a) using STRING. Edges between CBFA2T2 and diamond-shaped nodes are not drawn for simplicity. Connectivity significance was assessed by STRING, p < 0.1e-16.
Extended Data Fig.5 |
Extended Data Fig.5 |. Disruption to the CBFA complex explains most G4 MB tumors.
a, Percent of G3 and G4 MB in our cohort (n = 545) explained by alterations in genes connected to CBFA2T2 with a known or novel PPI (one step in the network presented in Extended Data Fig. 4e). Significance assessed using the impurity test for mutual exclusivity implemented in the R package DISCOVER. b, Ranked expression of HBEGF (left) and EREG (right) in G4 MB (n = 326). Points are coloured by the presence (red) or absence (grey) of known CBFA complex alterations. Samples with the highest expression of HBEGF and EREG typically do not have CBFA complex alterations, suggesting an alternate mechanism of CBFA complex inhibition. Data presented in a were not performed in replicates. c, Summary of disrupted pathways in G3 and G4 MB. Altered genes are grouped by pathway and labelled with alteration frequency. d, (Left) H&E–stained midsagittal section from 17 PCW human cerebellum. (Right) Fluorescence immunohistochemistry (IHC) showing KI67 and SOX2 expression in the human RL compartments. Data presented in d were not performed in replicates. RLVZ and RLSVZ are denoted by red and yellow asterisks, respectively. Scale bars: 100 μm.
Extended Data Fig.6 |
Extended Data Fig.6 |. LMX1A expression distinguishes the two downstream lineages of the RLSVZ.
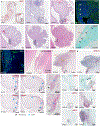
a, (Top left) In situ hybridization (ISH) showing MKI67 expression. In-set highlights the developing cerebellum, and the RL is indicated by the black box. (Other images) Hematoxylin and eosin (H&E)–stained midsagittal sections of the developing human cerebellum. In each, the rhombic lip is indicated by the black box. Scale bars: 500 μm. b, GFAP expression in the developing human RL at 17 PCW. Scale bar: 100 μm. The RLVZ and RLSVZ are physically divided by a vascular plexus, as indicated with white asterisks. c, ISH showing spatially resolved RNA expression of HBEGF in the developing human cerebellum at 17 PCW. Scale bar: 50 μm. HBEGF foci are enriched along the RL vascular plexus. d, KI67 expression in the developing human RL at 19 PCW. Scale bar: 100 μm. e, H&E–stained midsagittal sections of the 9-month postnatal human cerebellum. Scale bar: 500 μm. The RL is only present during gestation and disappears around birth. f, g, ISH showing spatially resolved RNA expression of CBFA2T2 (f) and CBFA2T3 (g) in the developing human cerebellum at 14 PCW. Scale bars: 100 μm. h, i, ISH showing spatially resolved RNA expression of Cbfa2t2 (h) and Cbfa2t3 (i) in the developing mouse cerebellum at E15.5 (Left) and E16.5 (Right). Scale bars: 100 μm. We do not observe a similar expression pattern of either gene in the mouse RL as we do in the human RL, and note an enrichment of expression in the EGL, similar to humans. j, ISH showing spatially resolved RNA expression of LMX1A in the developing human cerebellum at 11, 14, and 17 PCW. LMX1A is highly expressed in both the RLVZ and RLSVZ, but LMX1A expression is only retained in UBCs migrating away from the RL and is completely absent in GCPs that migrate to the EGL. Data presented in d is a representative image from three independent experiments with similar results, data in remaining panels were not performed in replicates.
Extended Data Fig.7 |
Extended Data Fig.7 |. Characterization of single cells used in transcriptional mapping between MB and human cerebellum development.
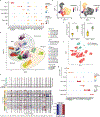
a, Dot plot showing expression of characteristic marker genes across RL glutamatergic cell types in the developing human cerebellum. b, UMAP embeddings coloured by pseudotime inferred from Slingshot, where the direction of pseudotime is from dark to light colours, for the granule cell lineage (Left) and the UBC lineage (Right). c, Expression of CBFA2T2 (Left) and CBFA2T3 (Right) in each zone of the developing human RL by bulk RNAseq. Statistical significance was assessed using a two-sided Mann-Whitney U test, * p < 0.05; CBFA2T2, p = 0.0078; CBFA2T3, p = 0.0056. n = 9 biological samples, per zone, acquired between 9 and 19 PCW. Box plots show the median and interquartile range, and whiskers show the data range. Points outside this range are outliers and are plotted individually. d, UMAP embedding of 63,296 single cells derived from G3 (n = 6), G4 (n = 11), and SHH (n = 3) MB scRNAseq samples. Clusters of transcriptionally similar cells are colored and labeled by tumor sample or annotated cell type for non-tumor cells. e, Copy number variations detected in single cells inferred using inferCNV. (Top) Reference non-tumor cells are devoid of copy number variations. (Bottom) Tumor cell clusters were enriched for copy number variations characteristic of the sample subgroup. Cells containing CNVs were assigned as tumor cells for downstream analysis. f, UMAP embedding as in (d) coloured by the detection of copy number variations. g, Dot plot showing expression of characteristic marker genes of SHH, G3, G4 MB, and the non-tumor cell types identified. For a, g, colour indicates average expression and size of each dot indicates the percent of cells in that cluster that express the genes.
Extended Data Fig.8 |
Extended Data Fig.8 |. G3 and G4 MB resemble specific components of the human RL, whose differentiation is stalled in time.
a, SingleR classification of tumor cells from G3 (n = 6), G4 (n = 11), and SHH (n = 3) MB scRNAseq samples, by comparison to the entire developing human cerebellum. As expected, MB cells are most similar to glutamatergic cells. b, SingleR classification of tumor cells from (a) by comparison to glutamatergic cell types. c, Kaplan-Meier plot showing overall survival of G3 and G4 MB subtypes in the current dataset. Significance assessed using a log-rank test. Censored cases, +. d, Relative confidence of per cell classifications, calculated as the average similarity score per subgroup (b), minus median similarity scores from other subgroups per cell type. e, UMAP embedding of n = 545 G3 and G4 MB bulk RNAseq samples, coloured by presence of KBTBD4 mutations. G4ɣ which are impoverished for CBFA complex mutations, and display high OTX2 expression, are also enriched for KBTBD4 mutations. f, Expression of super enhancer (SE) genes in the developing human cerebellum snRNAseq data. These gene promoters have been demonstrated to promote transcription of PRDM6 (SNCAIP) and GFI1B (DDX31/BARHL1 and PRRC2B) in G3 and G4 MB secondary to enhancer hijacking events,. Significance was assessed using a two-sided Wilcoxon Rank Sum test with FDR correction, *** p < 0.0005. SNCAIP, p = 3.39e−261; DDX31, p = 4.27e−71; BARHL1, p = 4.91e-40. n = 9,208 cells. g, Expression of DDX31, BARHL1, and PRRC2B across all cell types in the developing human cerebellum. DDX31 and BARHL1 exhibit correlated expression specific to the RLSVZ, while PRRC2B is non-specifically expressed. Significance was assessed using a two-sided Wilcoxon Rank Sum test with FDR correction, *** p < 0.0005. DDX31, p = 3.66e−113; BARHL1, p = 6.26e-191. n = 59,608 cells. h, Expression of G3 and G4 MB driver genes (from Fig.1a) in the developing human cerebellum snRNAseq data. i, j, k, Average expression of all G3 and G4 MB driver genes (i), CBFA complex genes (j), and gain of function (GOF) driver genes (k) in the developing human cerebellum snRNAseq data. Significance was assessed using a two-sided Wilcoxon Rank Sum test, * p < 0.05, *** p < 0.0005. n = 9,208 cells. (i), p = 1.5e−13; (j) GCP, p = 0.0085; Early GN, p = 0.047; (k) RLSVZ, p = 1.9e−05; GCP, p = 3.2e-13. For i, j, and k, box plots show the median and interquartile range, and whiskers show the data range. Points outside this range are outliers and are plotted individually.
Extended Data Fig.9 |
Extended Data Fig.9 |. Human EOMES+ve RL cells are mitotically active UBC progenitors.
a, EOMES and PAX6 expression in the developing human RL at 17 (i) and 19 (ii) PCW. Scale bars: 100 μm. b, EOMES and KI67 expression in the developing human RL at 17 (i) and 19 (ii) PCW. Scale bars as in a. Proliferating EOMES+ve UBC progenitors are common across all developmental timepoints assessed. c, EOMES+ cells in the human RL zones. The RLSVZ contains significantly more EOMES+ cells that the RLVZ. Significance was assessed using an unpaired two-tailed t-test, *** p = 1.048e-18. n = 3 biological repeats, per N = 4 time points; error bars, SEM. d, EOMES and KI67 expression in the developing human RL at the late timepoint 30 PCW. Scale bar as in (a). Proliferating EOMES+ve UBC progenitors can be found across fetal development, though at reduced frequency at later time points as KI67 expression is reduced (Fig.3c). e, Quantification of the number of EOMES+/KI67+ cells in the human RL across various developmental timepoints. All comparisons to 11 PCW were non-significant using two-tailed unpaired t-tests; 14PCW, p = 0.43; 17PCW, p = 0.65; 19PCW, p = 0.33. n = 3 biological repeats per timepoint; error bars, SEM. EOMES+/KI67+ UBC progenitors are a long-lived and dominant population of the RL, rather than a transient state preceding differentiation. f, Quantification of the number of Eomes+/Ki67+ cells in the mouse RL across various developmental timepoints. Significance was assessed using an unpaired two-tailed t-test, *** p = 0.00015. n = 3 biological repeats per timepoint; error bars, SEM. Eomes+/Ki67+ UBC progenitor cells are a rare population in the mouse RL. g, h, Eomes and Ki67 expression in the mouse RL at E15.5 (g) and E16.5 (h). The RL boundaries are indicated with white dashed lines. Scale bars: 50μm. Eomes+ UBCs are rarely Ki67+. Data presented in a, b, g, h are representative images from three independent experiments with similar results, data in d were not performed in replicates. i, Oncogenic divergence of RLSVZ progenitors from normal initiate G4 MB.
Extended Data Fig.10 |
Extended Data Fig.10 |. The location of G3 and G4 MB tumors coincides with OTX2 expression and supports an RL cell of origin.
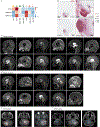
a, Scaled OTX2, CBFA2T2, and CBFA2T3 expression by scRNAseq. b, Expression of OTX2 at 14 and 17 PCW by ISH in the developing human cerebellum. c, T1 enhanced or T2 mid-sagittal MRI images of G4 MB (n = 12) tumors at initial diagnosis. d, T1 enhanced or T2 mid-sagittal MRI images of G3 MB (n = 10) tumors at initial diagnosis. Both G3 and G4 MB tumors present exclusively in the OTX2+ inferior cerebellum. e, Axial T1 enhanced, T2 or FLAIR images of SHH MB (n = 3) at initial diagnosis. SHH tumors occur in the cerebellar hemispheres, consistent with an EGL cell of origin. f, Axial T1 enhanced, T2 or FLAIR images of WNT MB (n = 3) at initial diagnosis. Data presented in b were not performed in replicates.
Extended Data Fig.11 |
Extended Data Fig.11 |. OTX2 knockdown promotes G3 MB differentiation through intermediate upregulation of CBFA2T2 and CBFA2T3.
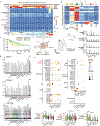
a, OTX2 ChIP-seq peaks are enriched at CBFA2T2 gene locus, but not CBFA2T3. b, OTX2 protein expression is reduced following OTX2-KD. Samples were used for bulk RNA sequencing. Beta actin used as a loading control. c, OTX2 protein expression is reduced following OTX2-KD. Samples were used for single-nucleus RNA sequencing. Beta actin used as a loading control. d, Representative images of primary tumorspheres in OTX2-KD and scramble conditions for both HDMB03 and MB3W1 cultures. Scale bar: 300 μm. e, f, Unbiased clustering of single nuclei following OTX2-KD in HDMB03 and MB3W1 G3 MB cells lines (c). g, Average expression of gene signatures derived from bulk RNAseq on OTX2-KD from HDMB03 and MB3W1 (b). Cells that are more orange than green indicate cells with higher expression of genes characteristic of the unchanged G3 MB cell lines, and vice-versa. Orange cells are likely cells where OTX2-KD was inefficient. h, Differentiation score as determined by CytoTRACE. Less differentiated cells are indicated in red and more differentiated cells are indicated in blue. The results support a model where cluster 6 in HDMB03 and cluster 3 in MB3W1 represent inefficient OTX2-KD cells that retain the most similarity to WT tumor cells. i, RBFOX3 (NeuN) protein expression is increased following OTX2-KD in both HDMB03 and MB3W1, validating GN differentiation following OTX2-KD. j, Expression of genes significantly correlated with granule neuron differentiation along pseudotime in normal human RL development. (Top) Density of cell along pseudotime in the granule neuron lineage (Extended Data Fig.6b, left). (Bottom) Binned gene expression of markers derived from the developing human cerebellum snRNAseq dataset (Fig.4a). The stepwise expression of granule neuron genes observed when OTX2 is knocked down in G3 MB (Fig.5i) strikingly mirrors that of normal granule neuron differentiation, suggesting that G3 and G4 MB arise from failed normal differentiation rather than alternate hypotheses, such as trans- or de-differentiation. k, CBFA2T2 and CBFA2T3 expression in HDMB03 (Left) and MB3W1 (Right). CBFA2T2 expression is strongly upregulated in cells where the CytoTRACE score drops below 0.8, and CBFA2T3 follows. The results suggest CBFA2T2 and then CBFA2T3 are upregulated early in response to efficient OTX2-KD. l, CBFA2T2 expression change in response to CBFA2T2 overexpression (CBFA2T2-OE) in HDMB03 by qPCR. m, CBFA2T2 protein expression is increased following CBFA2T2-OE. β-actin used as a loading control. n, Representative images of primary tumorspheres in CBFA2T2-OE GFP and Control RFP conditions. Scale bar: 600 μm. o, p, Live cell number (o) and viability (p) in response to CBFA2T2-OE. Live cell number is significantly reduced in response to CBFA2T2-OE, while viability is unchanged. Data are normalized to their respective controls and presented showing points from n = 3 technical replicates per N = 8 or N = 5 biological replicates, for live cell number and viability, respectively. Error bars indicate SEM. Significance assessed using a two-tailed paired t-test on biological replicates, ** p = 0.0047. q, OTX2 restrains differentiation of RL progenitors through CBFA complex inhibition. Data presented in d, n are representative images from 4 and 8 independent experiments, respectively, with similar results, data in b, c, i, m were not performed in replicates. For gel source data, see Supplementary Figure 1.
Fig.1 |
Fig.1 |. The landscape of oncogenic drivers in G3 and G4 MB.
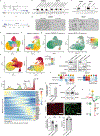
a, Oncoprint summary of mutations, copy number variations, gene expression, and gene fusions in G3 and G4 MB (n = 545 tumors). 173 samples without recurrent alterations detected are not shown. b, Gene-level summary of CBFA2T2 mutations in G4 MB. c, Structural model of CBFA2T2 protein NHR1 domain, highlighting positions affected by missense mutations. The structure of the NHR1 domain has been previously determined (Bottom), while the full protein structure was inferred using iTasser (Top). d, Comparison of significant focal deletions in n = 206 G4 MB, either with CBFA2T2 mutations, or PRDM6 overexpression, versus tumors without CBFA2T2 or PRDM6 abnormalities. Significance assessed using GISTIC 2.0 (FDR < 0.25).
Fig.2 |
Fig.2 |. CBFA complex members are recurrently somatically mutated in G4 MB.
a, Mutual exclusivity (ME) of somatic SNVs in 16q genes FANCA, ZFHX3, and CHD9. Deletions of 16q do not typically co-occur with mutations in these genes. G3 and G4 MB prefer deletions to simultaneously disrupt several tumor suppressor genes (TSGs). b, Locations of G4 MB TSGs on chr16 and percentage of samples where TSGs are deleted to haploinsufficiency in G3 and G4 MB samples with 16q deletions. c, ME of PRDM6 overexpression, CBFA2T2 mutations, CBFA2T3 deletions, KDM6A mutations, and GFI1 or GFI1B enhancer hijacking in G4 MB. Significance assessed using the impurity test for ME implemented by DISCOVER. d, Cartoon of known or suspected CBFA complex members. e, Expression of significant differentially expressed genes (DEGs) between microglia from each subgroup using scRNAseq (MAST, FDR < 0.05). f, Predicted receptor-ligand interactions between microglia and tumor cells in G4 MB (CCInx). Node colours represent mean normalized gene expression in each cell type, and edge colour represents the average of the node expression levels. Only significant DEGs from g were included, demonstrating the microenvironment specificity of G4 MB.
Fig.3 |
Fig.3 |. CBFA2T2 and CBFA2T3 define the RL VZ / SVZ boundary in the developing human cerebellum.
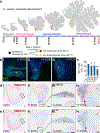
a, Schematic summarizing Homo sapiens cerebellar development. Prior to 11 PCW, the RL resembles that of Mus musculus. Around 11 PCW the human RL splits into a ventricular and subventricular zone leading to human-specific cerebellar expansion. b, KI67 expression in the developing human RL at 11, 14 and 17 PCW. c, Percent of human RL cells expressing KI67 across several developmental timepoints. Significance assessed using a paired two-tailed t-test compared to 11 PCW, ** p < 0.005, * p < 0.05. 14PCW, p = 0.0072; 17PCW, p = 0.012; 19PCW, p = 0.0024. n = 3 biological repeats per time point; error bars, SEM. d, e, In situ hybridization (ISH) showing spatially resolved RNA expression of CBFA2T2 (d) and CBFA2T3 (e) in the developing human cerebellum at CS23, 11, and 17 PCW. CBFA2T2 and CBFA2T3 expression is first observed at 11 PCW in the RLSVZ but not the RLVZ. Data presented in b are representative images from three independent experiments with similar results, data in d and e were not performed in replicates. RLVZ, RLSVZ, and EGL are denoted by red, yellow, and black asterisks, respectively. Scale bars: 100 μm.
Fig.4 |
Fig.4 |. The expanded human RL is uniquely predisposed to G3 and G4 MB.
a, (Left) UMAP embedding of 9,208 single cells from the developing human cerebellum. (Right) Midsagittal H&E section from 11PCW human cerebellum highlighting expected distribution of indicated cell types. b, Deconvolution of RNAseq expression profiles from G3 (n = 219), G4 (n = 326), and SHH (n = 250) MB by cell types in a. c, Deconvolution proportions along the RL to UBC lineage in G3 and G4 MB subtypes. d, UMAP embedding of G3 and G4 MB RNAseq samples (of n = 545), showing subtype, OTX2 expression, and CBFA complex alterations. e, EOMES and PAX6 expression in human RL at 11 and 14 PCW. f, g, Percent of RL cells expressing PAX6 only (f), *p = 0.036 or both PAX6 and EOMES (g), *p = 0.017. Significance assessed using unpaired two-tailed t-tests; n = 3 biological repeats per time point; error bars, SEM. h, EOMES and KI67 expression at 11, 14, and 26 PCW. i, EOMES+/KI67+ population in humans and mice across timepoints. Significance assessed by two-sided Mann-Whitney U test, ***p = 0.000108. n = 3 biological repeats per time point; error bars, SEM. Data presented in e, h (11 and 14 PCW) are representative images from three independent experiments with similar results, data in a, h (26 PCW) were not performed in replicates. The RLVZ, inner subventricular (RLiSVZ), and outer subventricular (RLoSVZ) zones indicated with red, yellow, and white asterisks, respectively. Scale bars: 100 μm.
Fig.5 |
Fig.5 |. OTX2 restrains RL differentiation through inhibition of the CBFA complex.
a, Percentage of cells in normal cell types and MB cells which exhibit predicted TF activity (SCENIC). b, OTX2 expression in the developing human RL at 11 and 18 PCW. Scale bars: 100 μm. c, OTX2 expression at 18 PCW. High expression is observed in the RL (black box) and the posterior lobes. Scale bar: 500 μm. d, Representative T1 enhanced or T2 MRI scans showing typical locations of each MB subgroup at initial diagnosis. Mid-sagittal scans are shown for G3 and G4 MB, axial scans for SHH and WNT MB tumors. e, OTX2 expression in G3 and G4 MB samples by CBFA complex alterations (Fig. 4d). Significance assessed using two-sided Mann-Whitney U test, *** p = 0.0000162, n = 545 MBs. Box plots show the median and interquartile range, and whiskers show the data range. Points outside this range are outliers and are plotted individually. f, CBFA2T2 and CBFA2T3 expression following OTX2 knockdown in G3 MB tumorspheres. Data shown as mean fold change ± SEM compared to scramble, with n = 3 biological replicates. Significance assessed using DESeq245 (FDR < 0.05), *** p < 0.0005, ** p < 0.005. CBFA2T2: HDMB03, p = 1.20e−30; MB3W1, p = 4.45e-15. CBFA2T3: HDMB03, p = 2.90e−91; MB3W1, p = 0.0055. g, Single-cells show increased similarity to normal differentiated cell types upon OTX2-KD in G3 MB tumorspheres. h, Expression of granule neuron (GN) lineage marker genes along pseudotime following OTX2-KD in MB3W1. (Top) Density of most similar developmental cell type (g) along pseudotime. (Bottom) Binned expression of GN differentiation genes (Fig.4a). Data presented in b, c were not performed in replicates.
Fig.6 |
Fig.6 |. G3 and G4 MB initiate in utero from failed differentiation of components of the human RL.
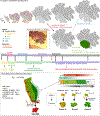
Proposed model of the initiation of SHH, G3, and G4 MB. (Top) Normal human cerebellum development is marked by changing roles and shrinking of the RL until it dissipates within the nodulus around or shortly after birth. Rarely, this process can be disrupted, leaving residual disorganized RL termed PeRL, which appears as a non-neoplastic malformation (dyplasia) in the nodulus. (Bottom) Following the split of the human RL around 11 PCW, EOMES+ KI67+ RLSVZ progenitors are born, which in the presence of chromosomal instability and/or driver alterations, fail to differentiate properly and give rise to PeRLs which in the presence of further genetic insult give rise to G3 and G4 MB in the inferior cerebellum. PN, postnatal.

Comment in

References

    1. Northcott PA et al. Medulloblastoma Comprises Four Distinct Molecular Variants. J. Clin. Oncol 29, 1408–1414 (2011). - PMC - PubMed
    1. Cavalli FMG et al. Intertumoral Heterogeneity within Medulloblastoma Subgroups. Cancer Cell 31, 737–754.e6 (2017). - PMC - PubMed
    1. Vladoiu MC et al. Childhood cerebellar tumors mirror conserved fetal transcriptional programs. Nature 350280 (2019). - PMC - PubMed
    1. Hovestadt V. et al. Resolving medulloblastoma cellular architecture by single-cell genomics. Nature 572, 74–79 (2019). - PMC - PubMed
    1. Wechsler-Reya RJ & Scott MP Control of Neuronal Precursor Proliferation in the Cerebellum by Sonic Hedgehog. Neuron 22, 103–114 (1999). - PubMed

ONLINE-ONLY REFERENCES

    1. Milde T. et al. HD-MB03 is a novel Group 3 medulloblastoma model demonstrating sensitivity to histone deacetylase inhibitor treatment. J. Neurooncol 110, 335–348 (2012). - PubMed
    1. Dietl S. et al. MB3W1 is an orthotopic xenograft model for anaplastic medulloblastoma displaying cancer stem cell- and Group 3-properties. BMC Cancer 16, 115 (2016). - PMC - PubMed
    1. Choi H. et al. SAINT: probabilistic scoring of affinity purification–mass spectrometry data. Nat. Methods 8, 70–73 (2011). - PMC - PubMed
    1. Teo G. et al. SAINTexpress: Improvements and additional features in Significance Analysis of INTeractome software. J. Proteomics 100, 37–43 (2014). - PMC - PubMed
    1. Chen S, Zhou Y, Chen Y. & Gu J. fastp: an ultra-fast all-in-one FASTQ preprocessor. Bioinformatics 34, i884–i890 (2018). - PMC - PubMed

Publication types

MeSH terms