. 2022 Sep;609(7929):1005-1011.
doi: 10.1038/s41586-022-05221-y. Epub 2022 Sep 21.

CLN3 is required for the clearance of glycerophosphodiesters from lysosomes

Affiliations

CLN3 is required for the clearance of glycerophosphodiesters from lysosomes

Nouf N Laqtom et al. Nature. 2022 Sep.

Abstract

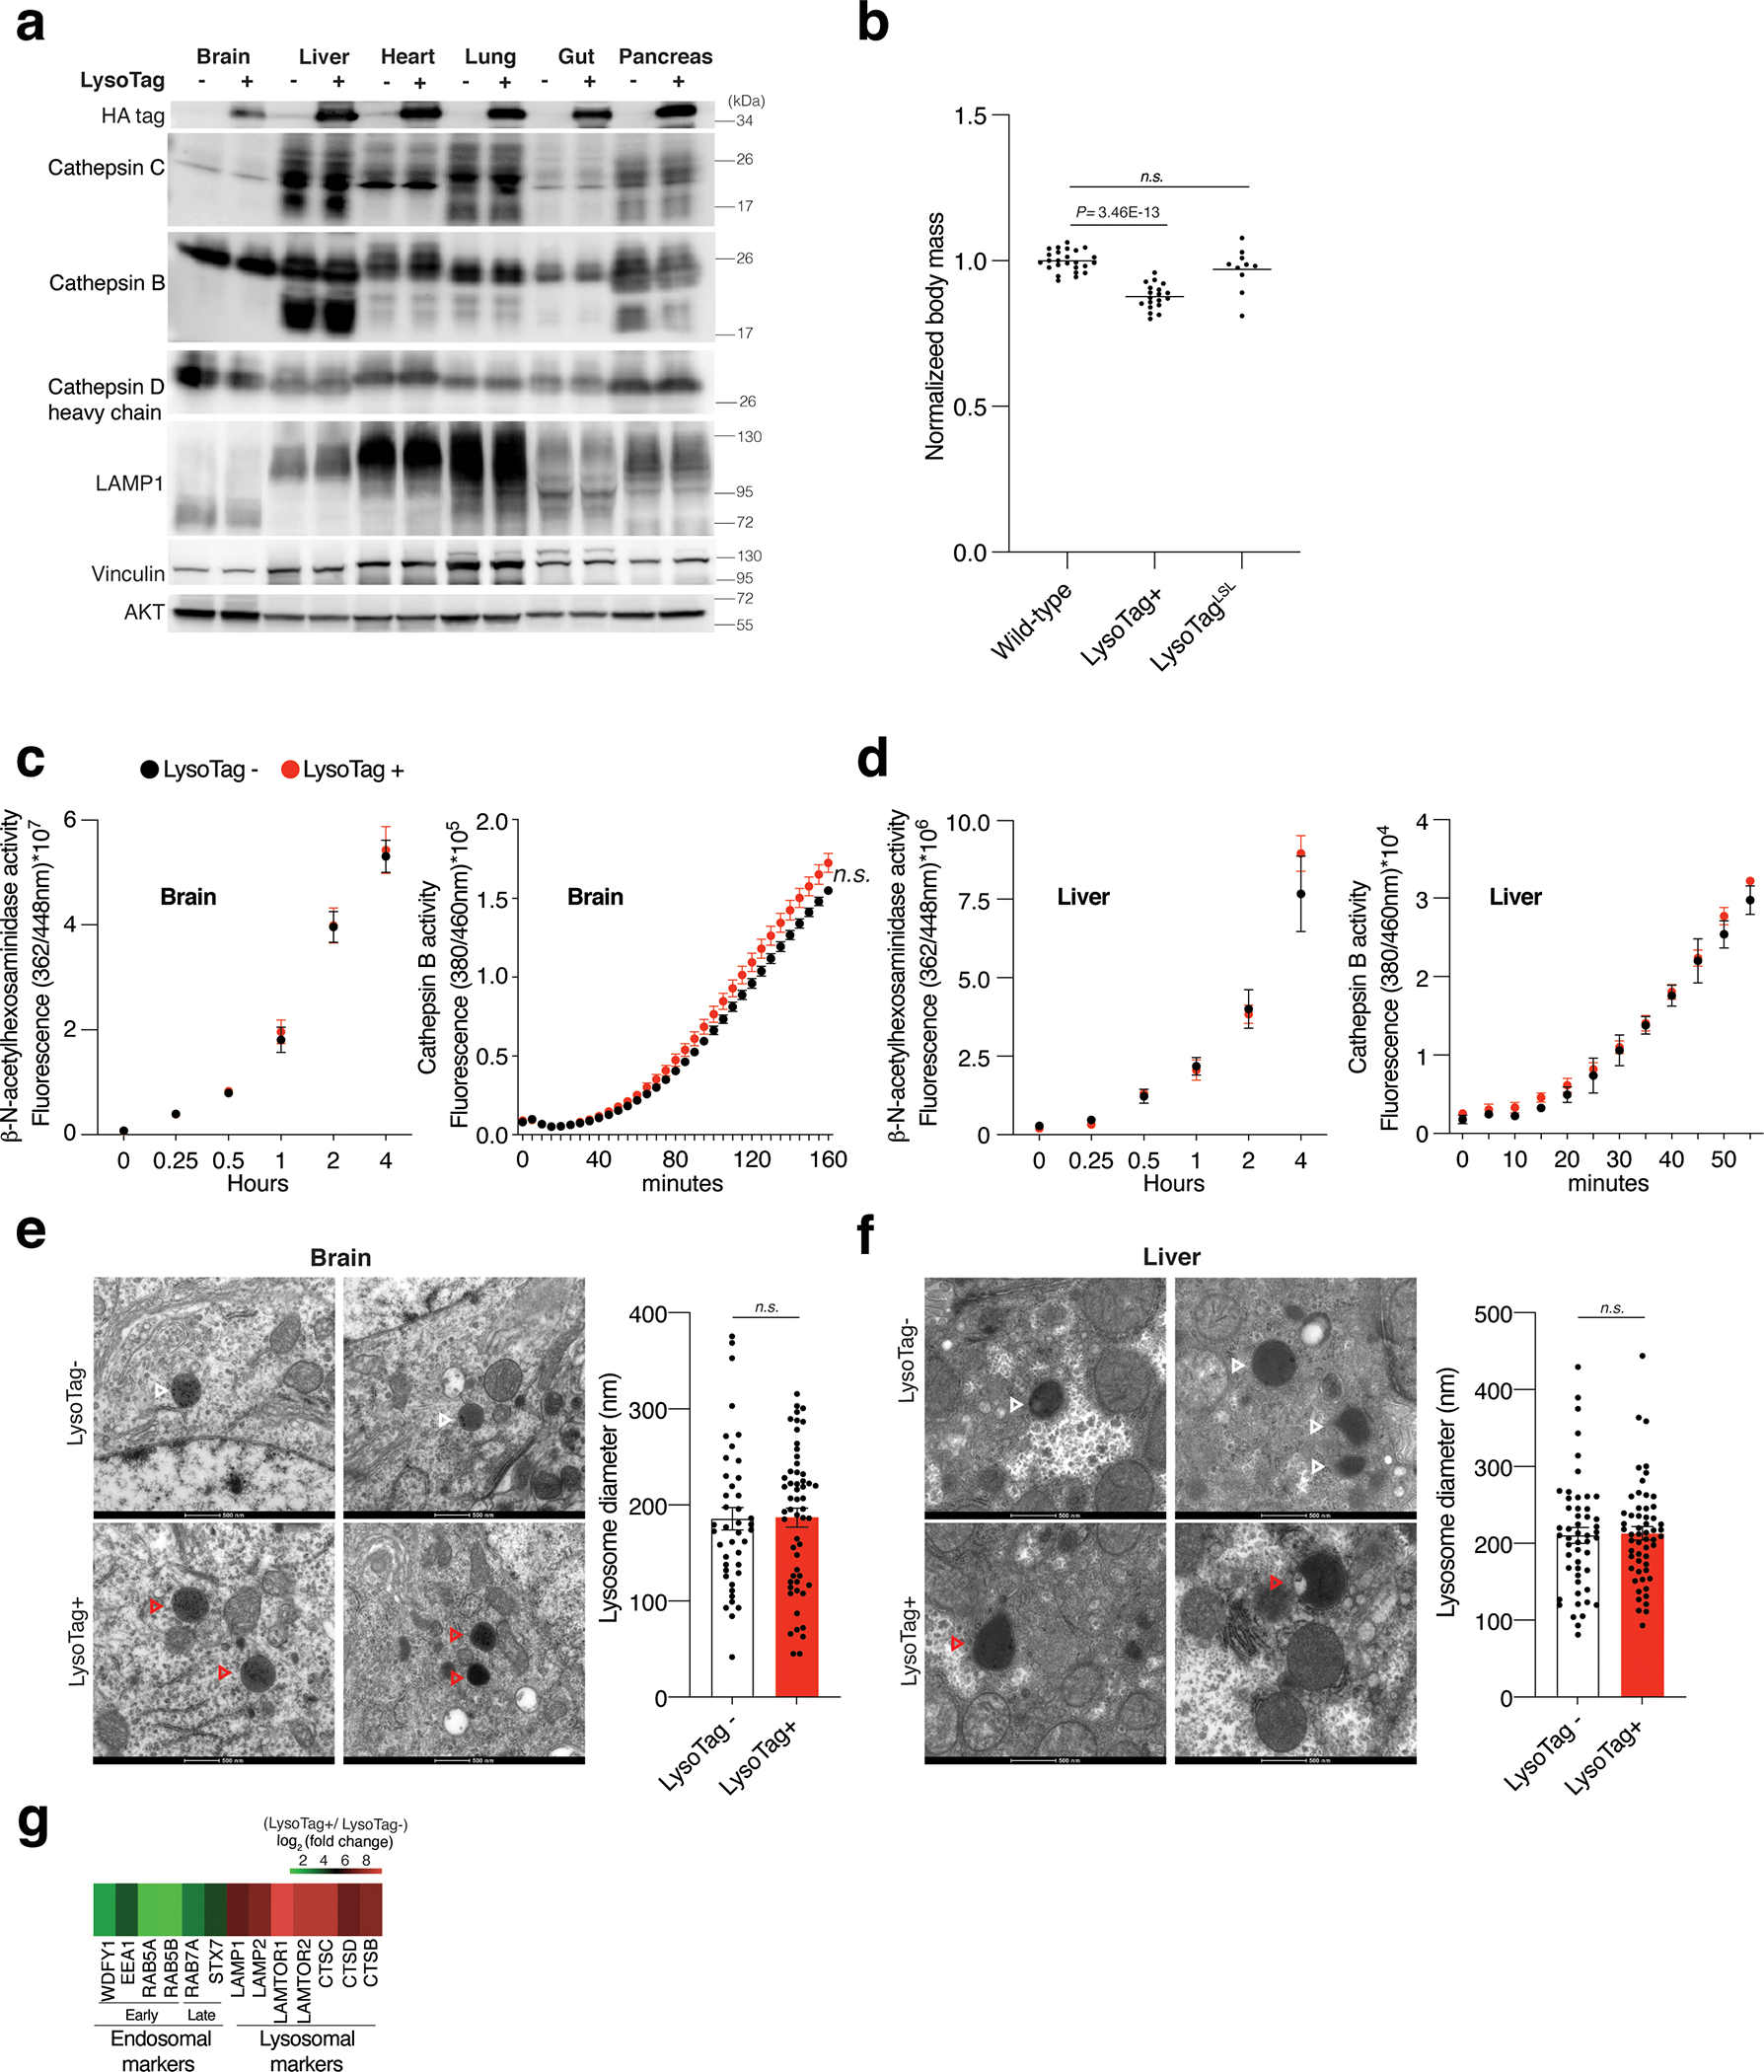
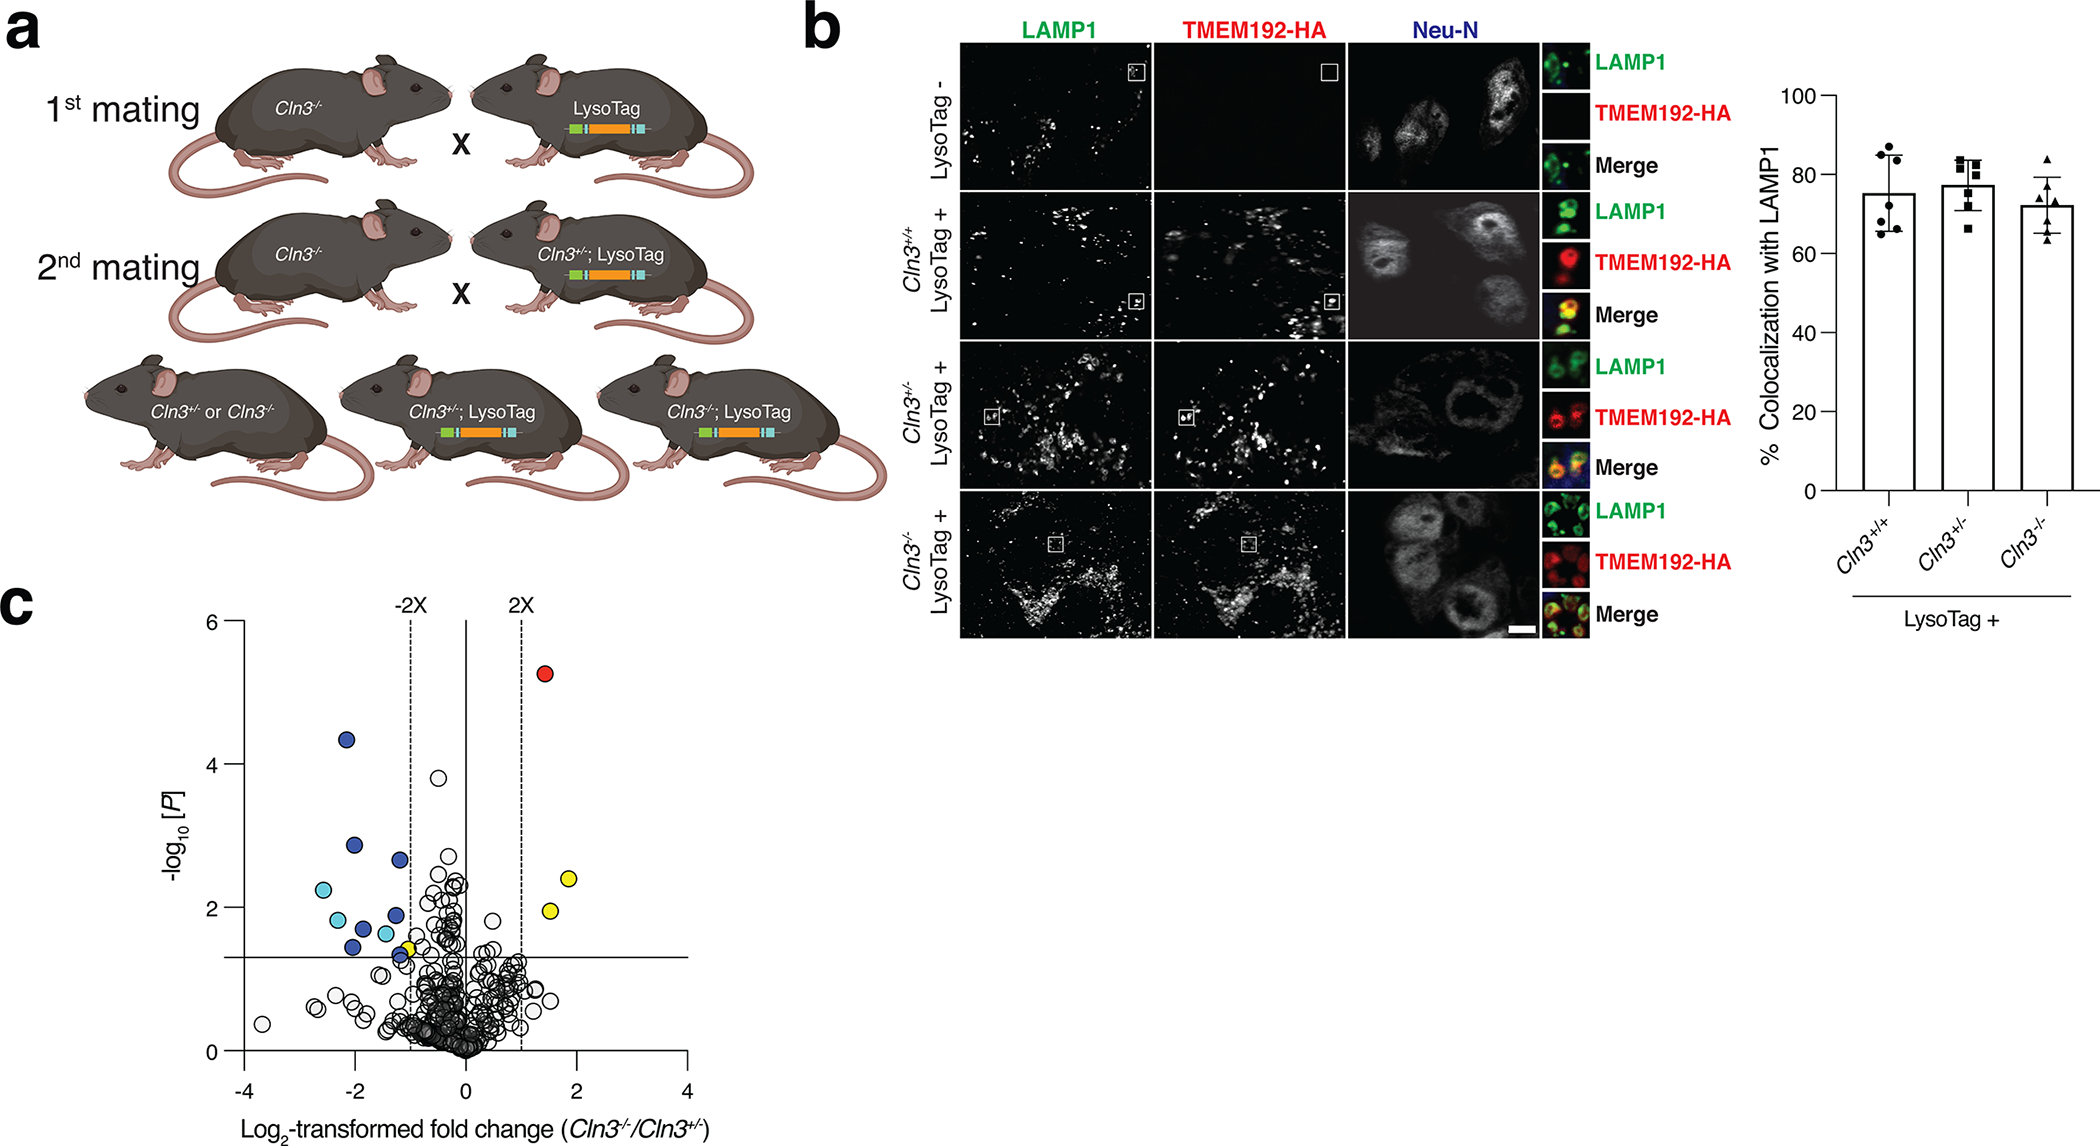
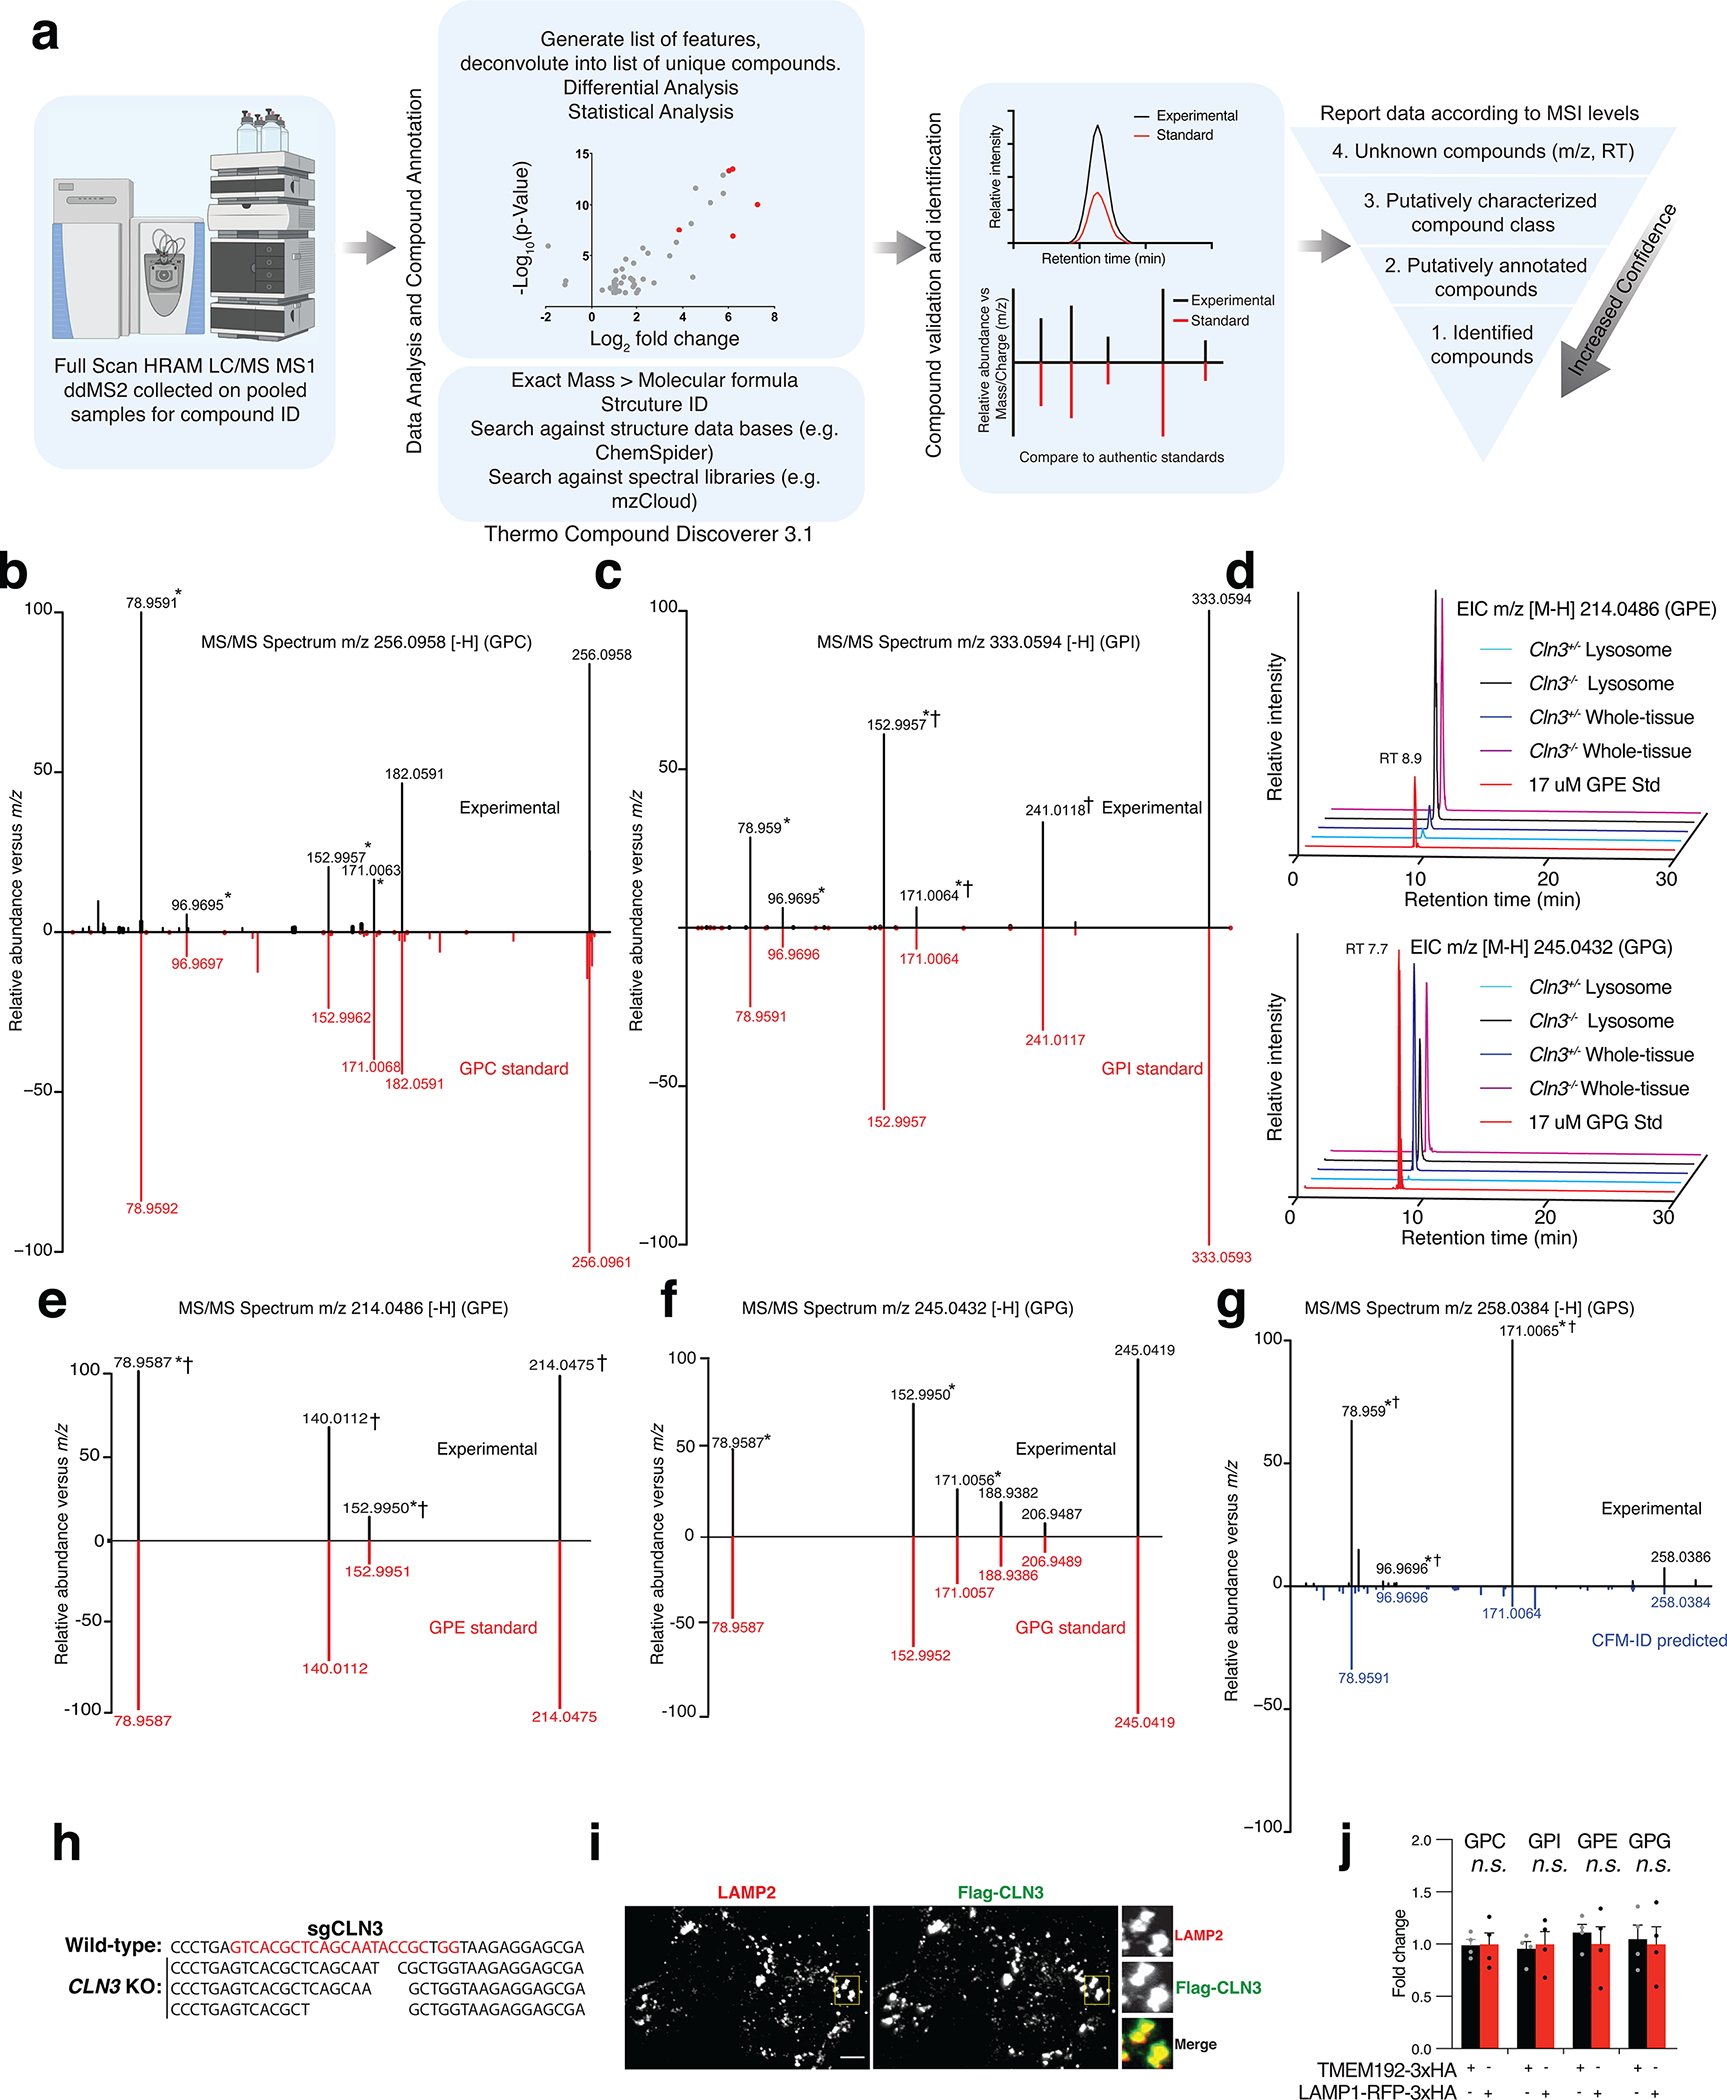
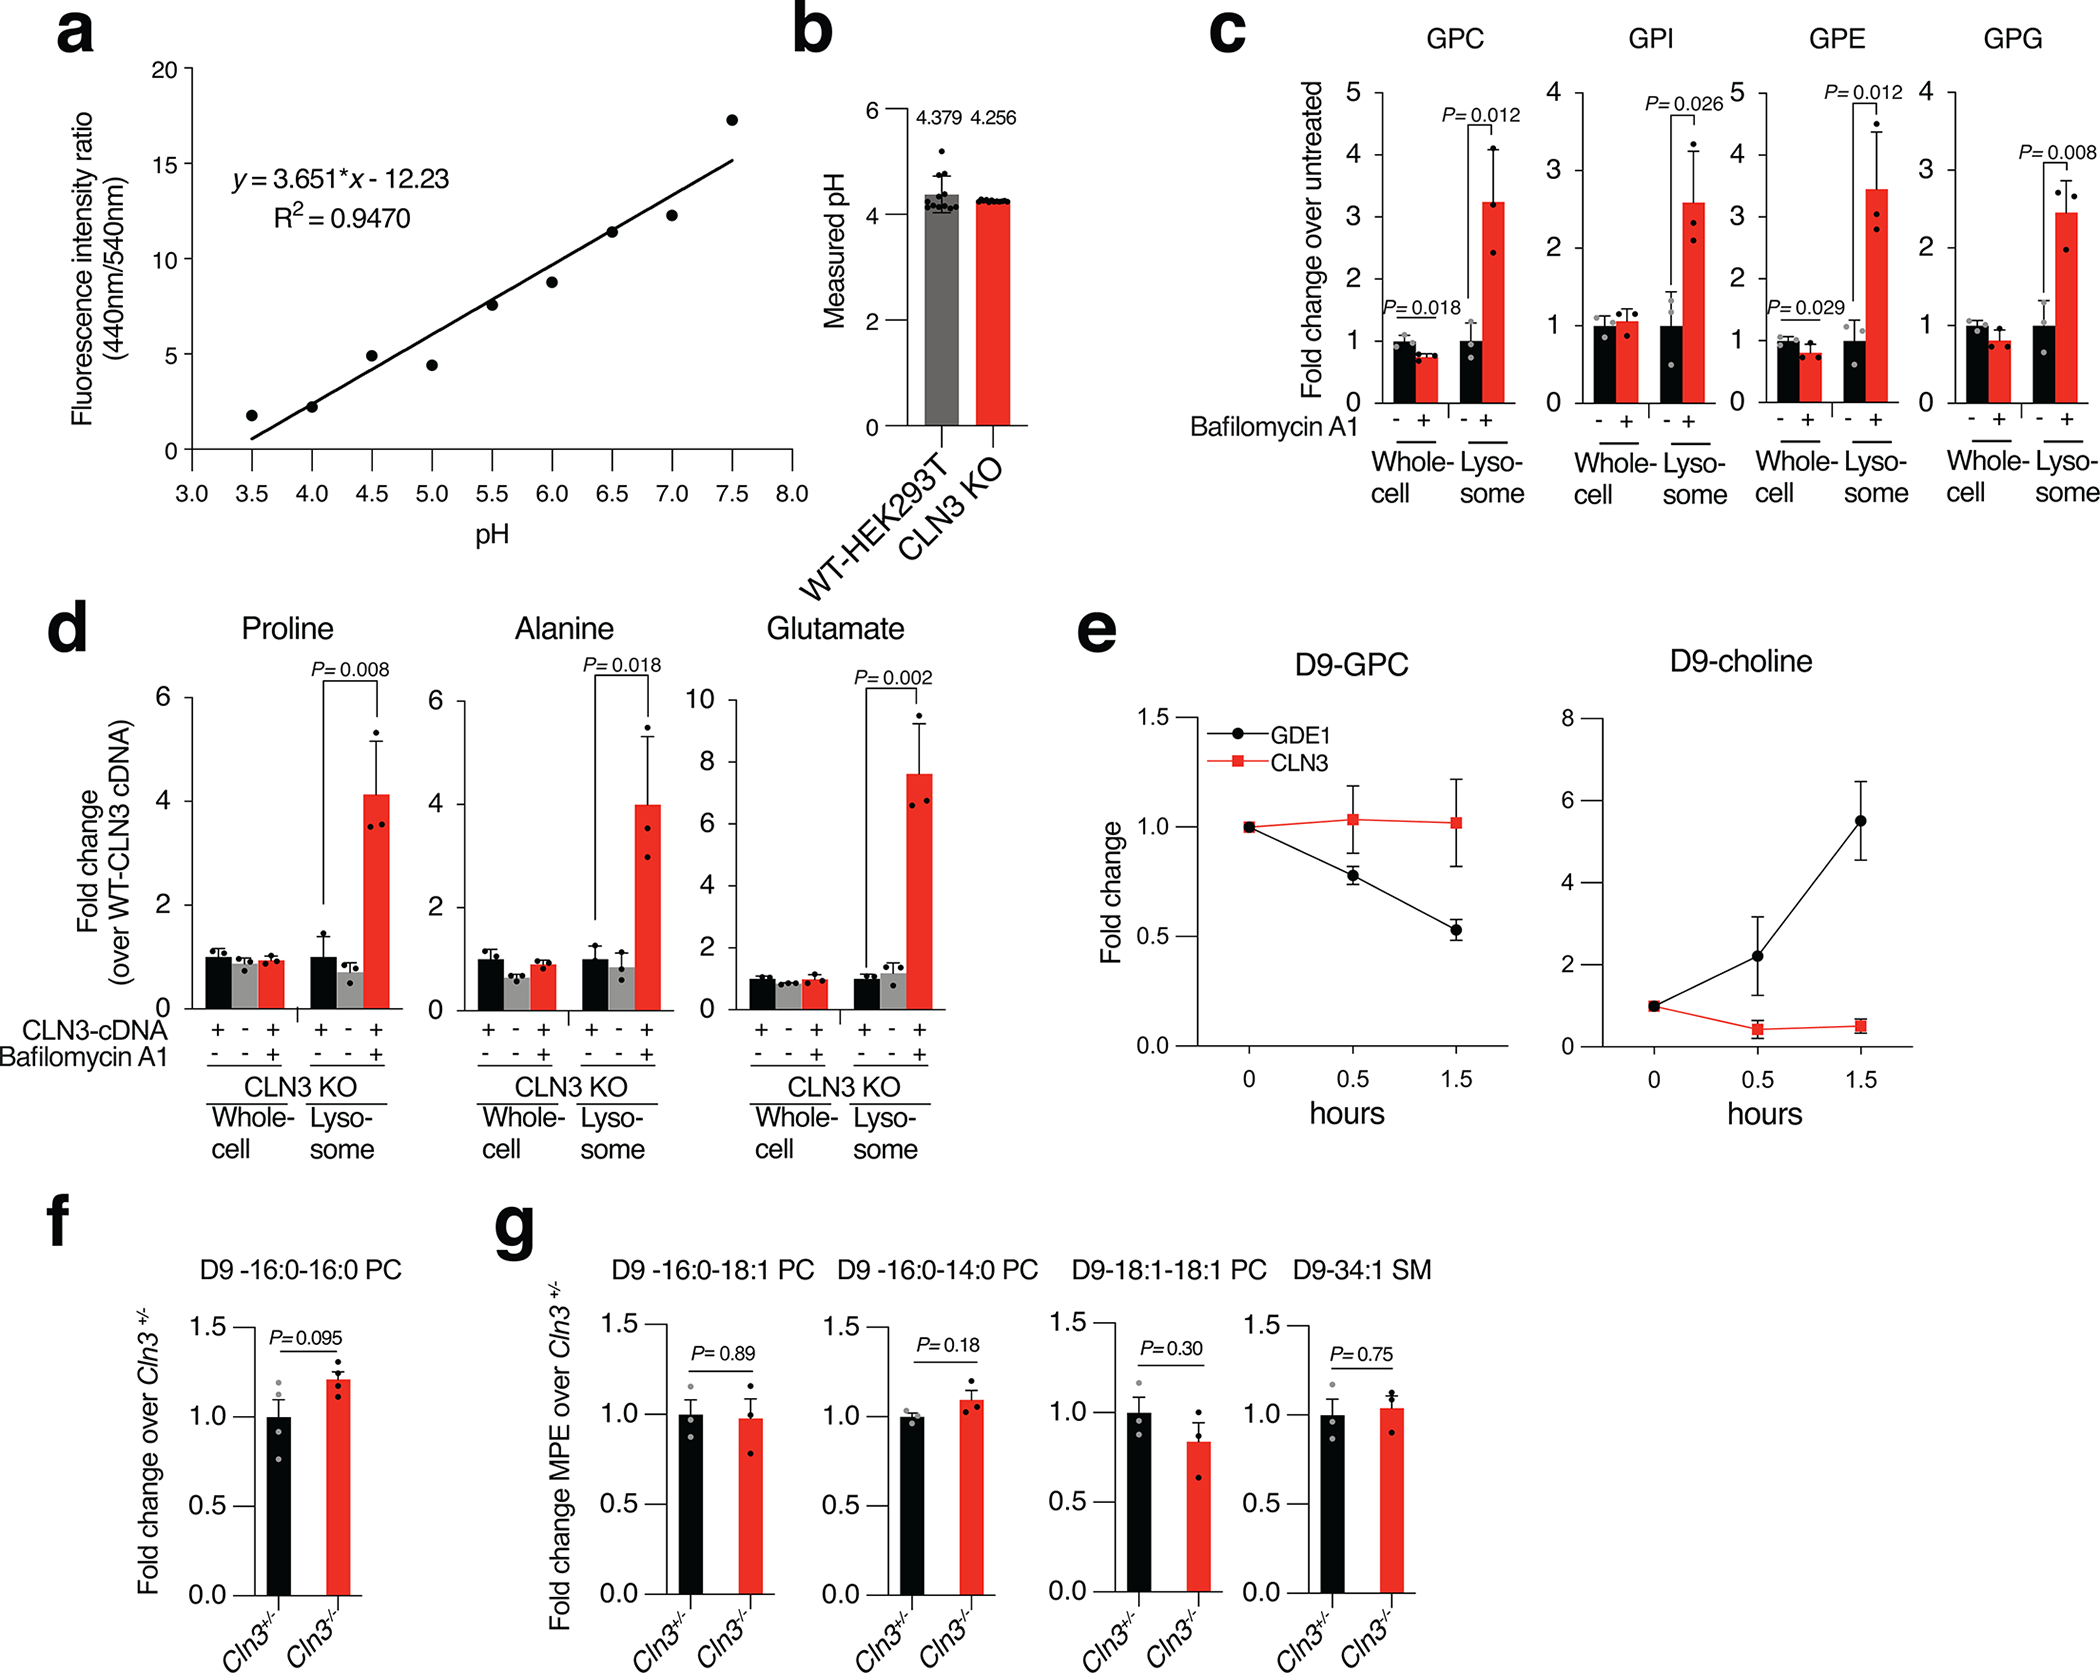
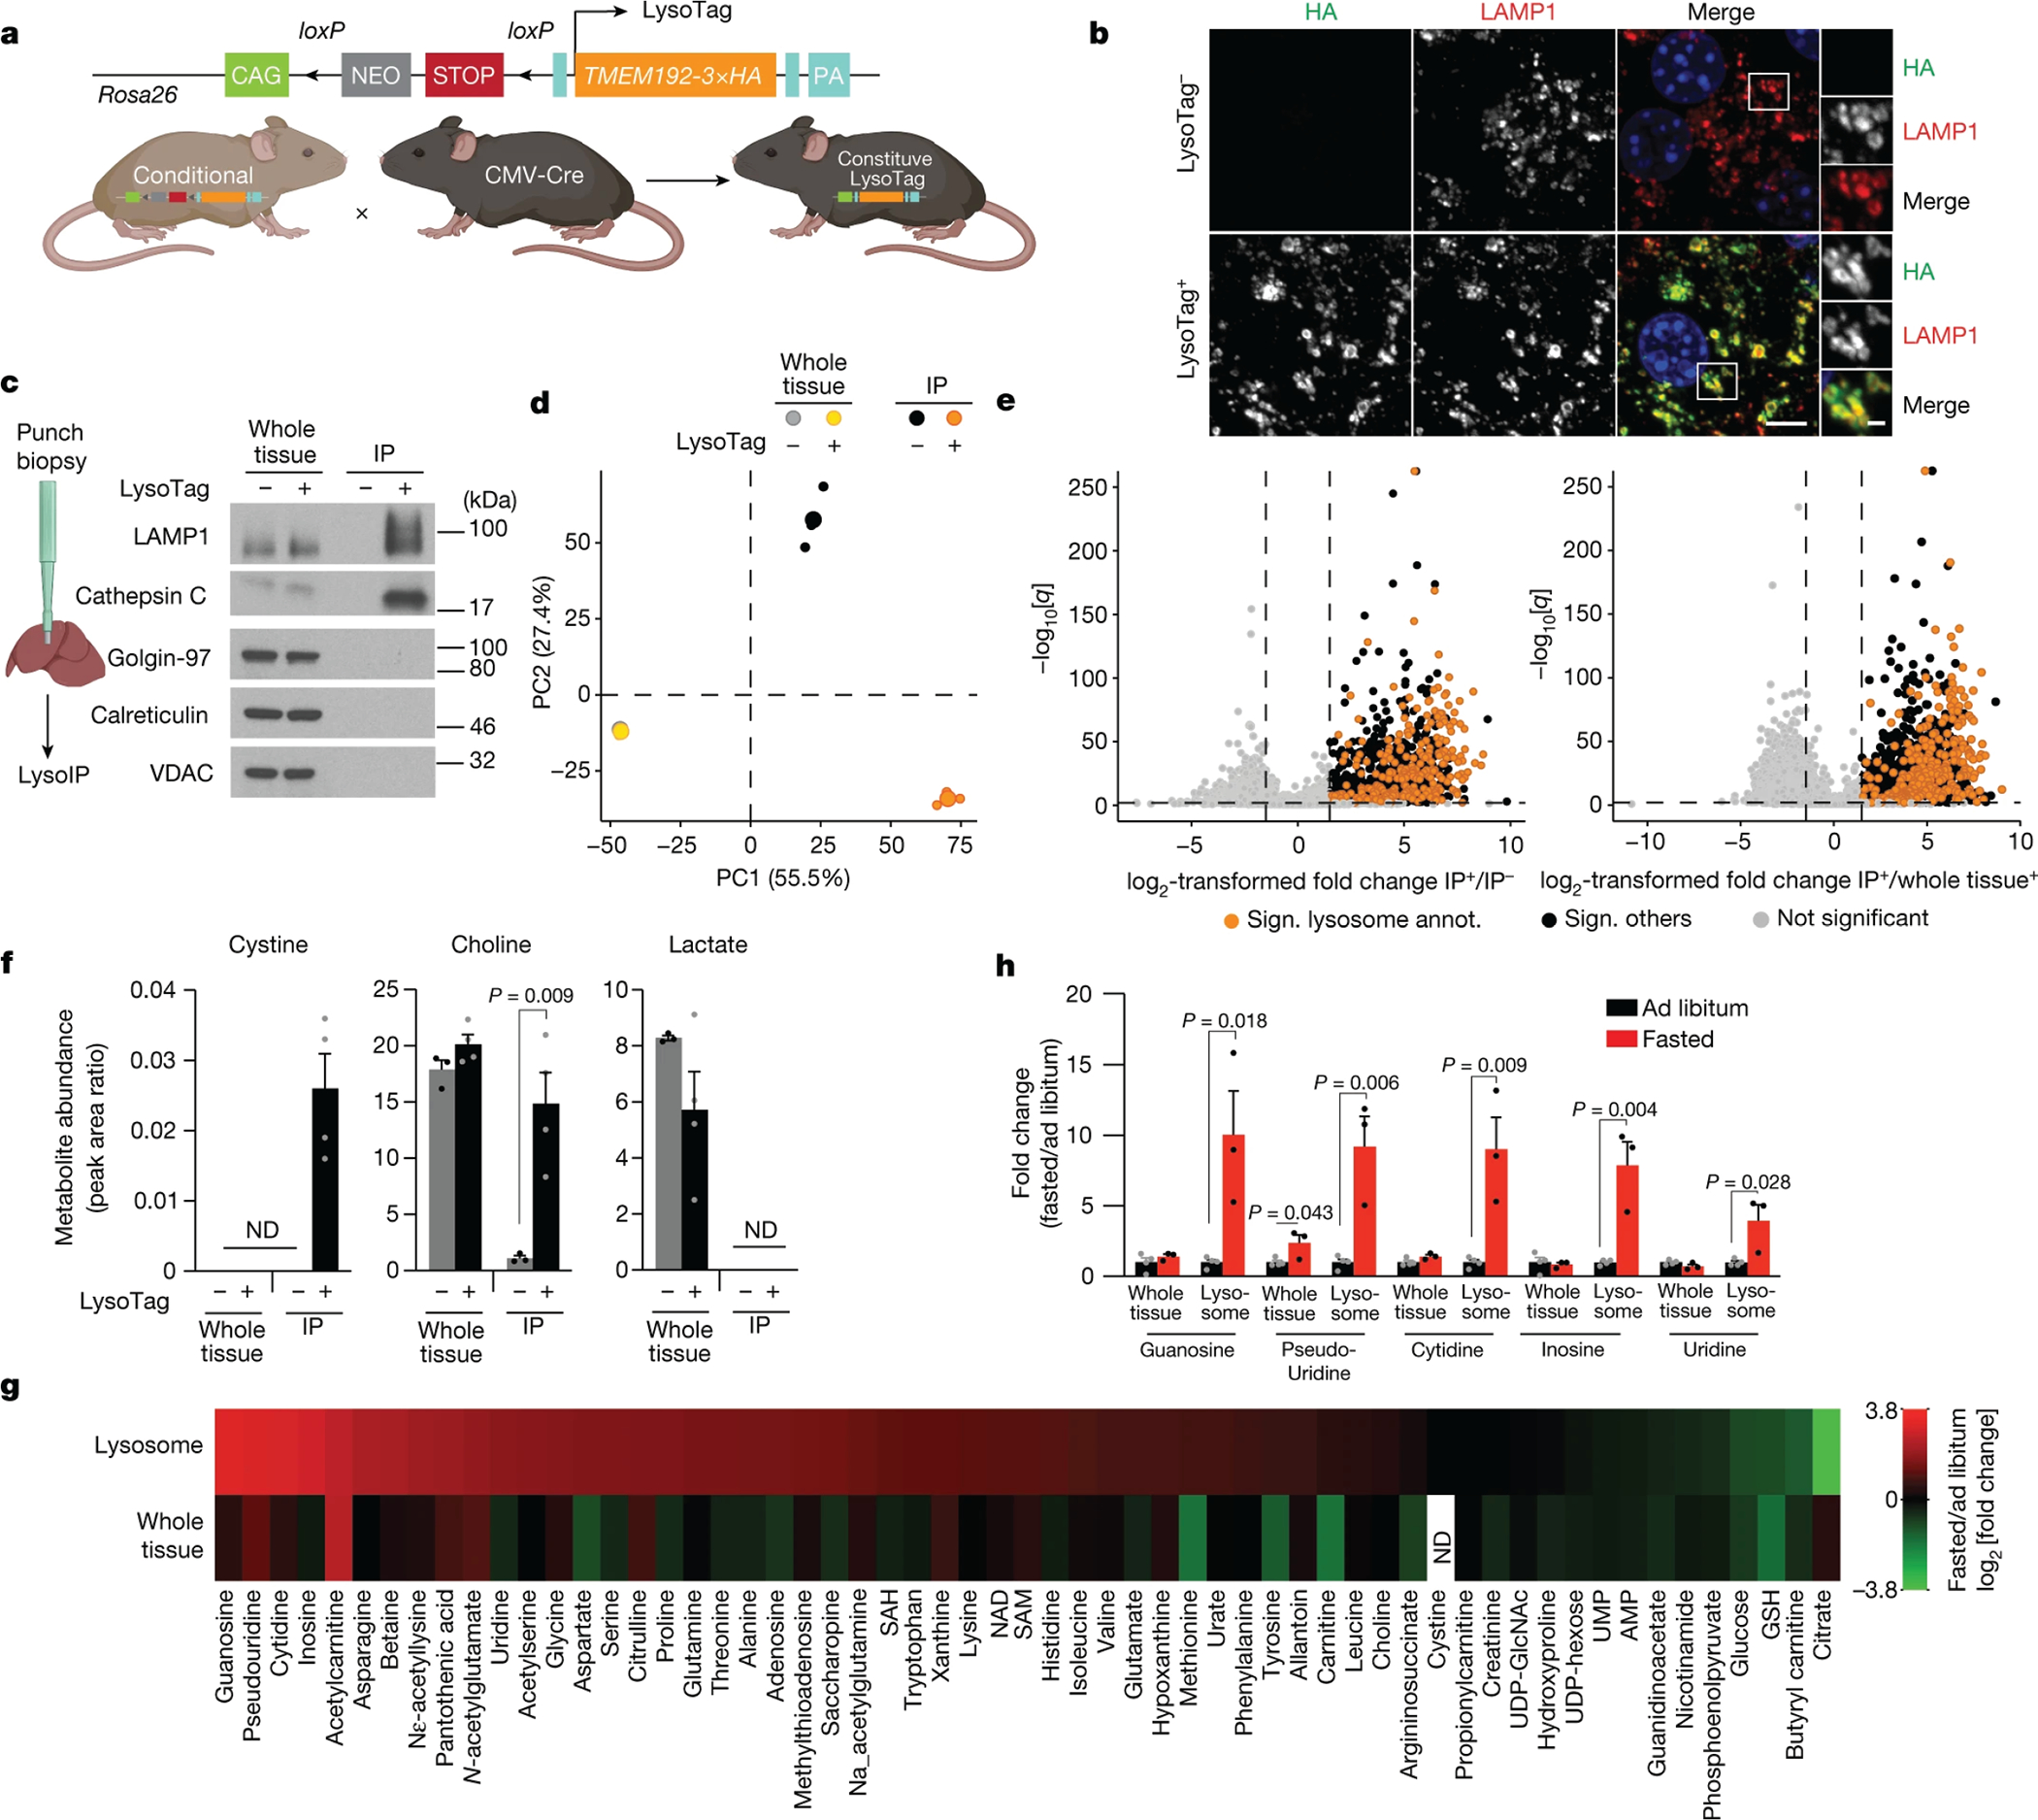
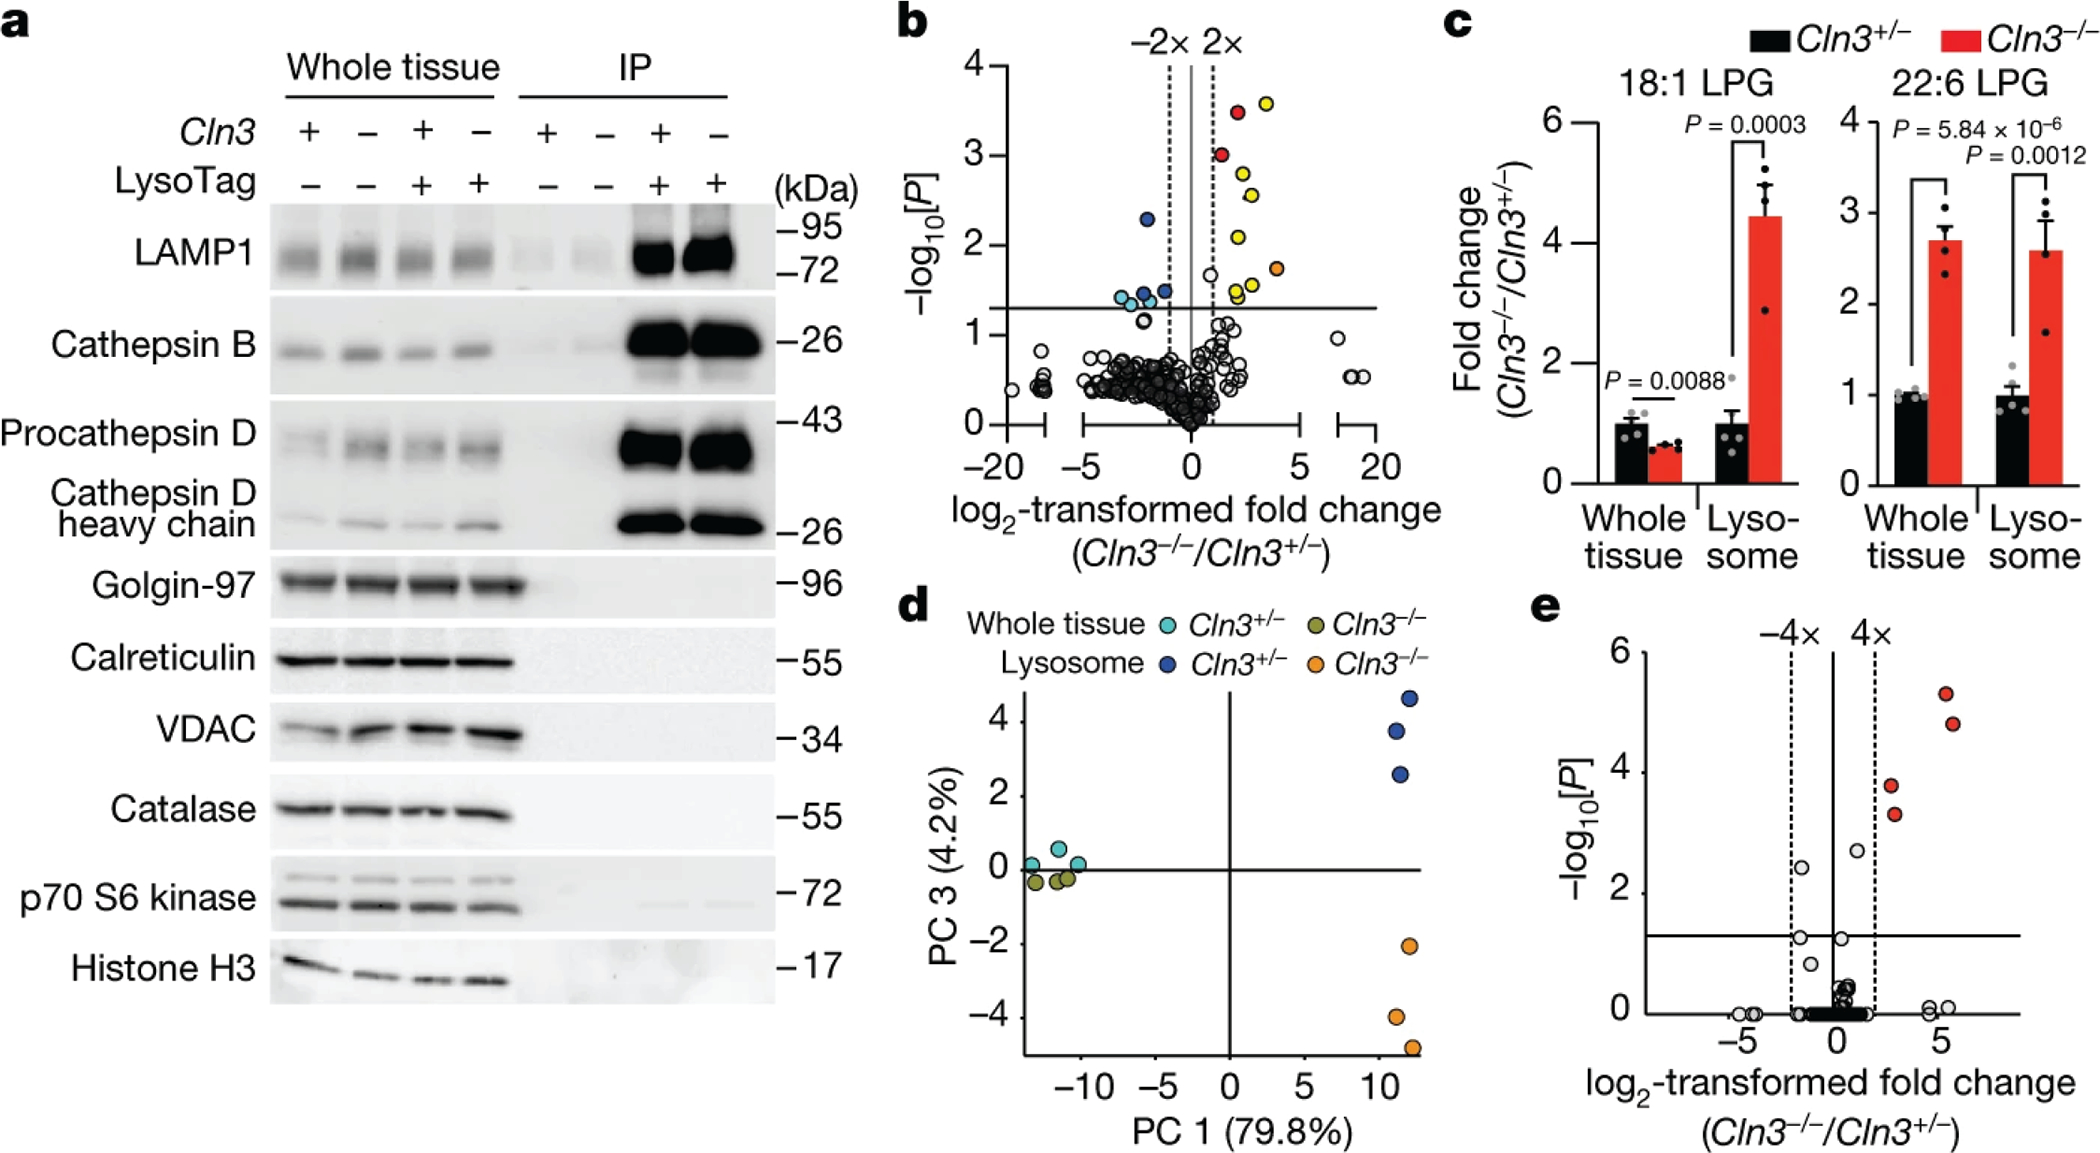
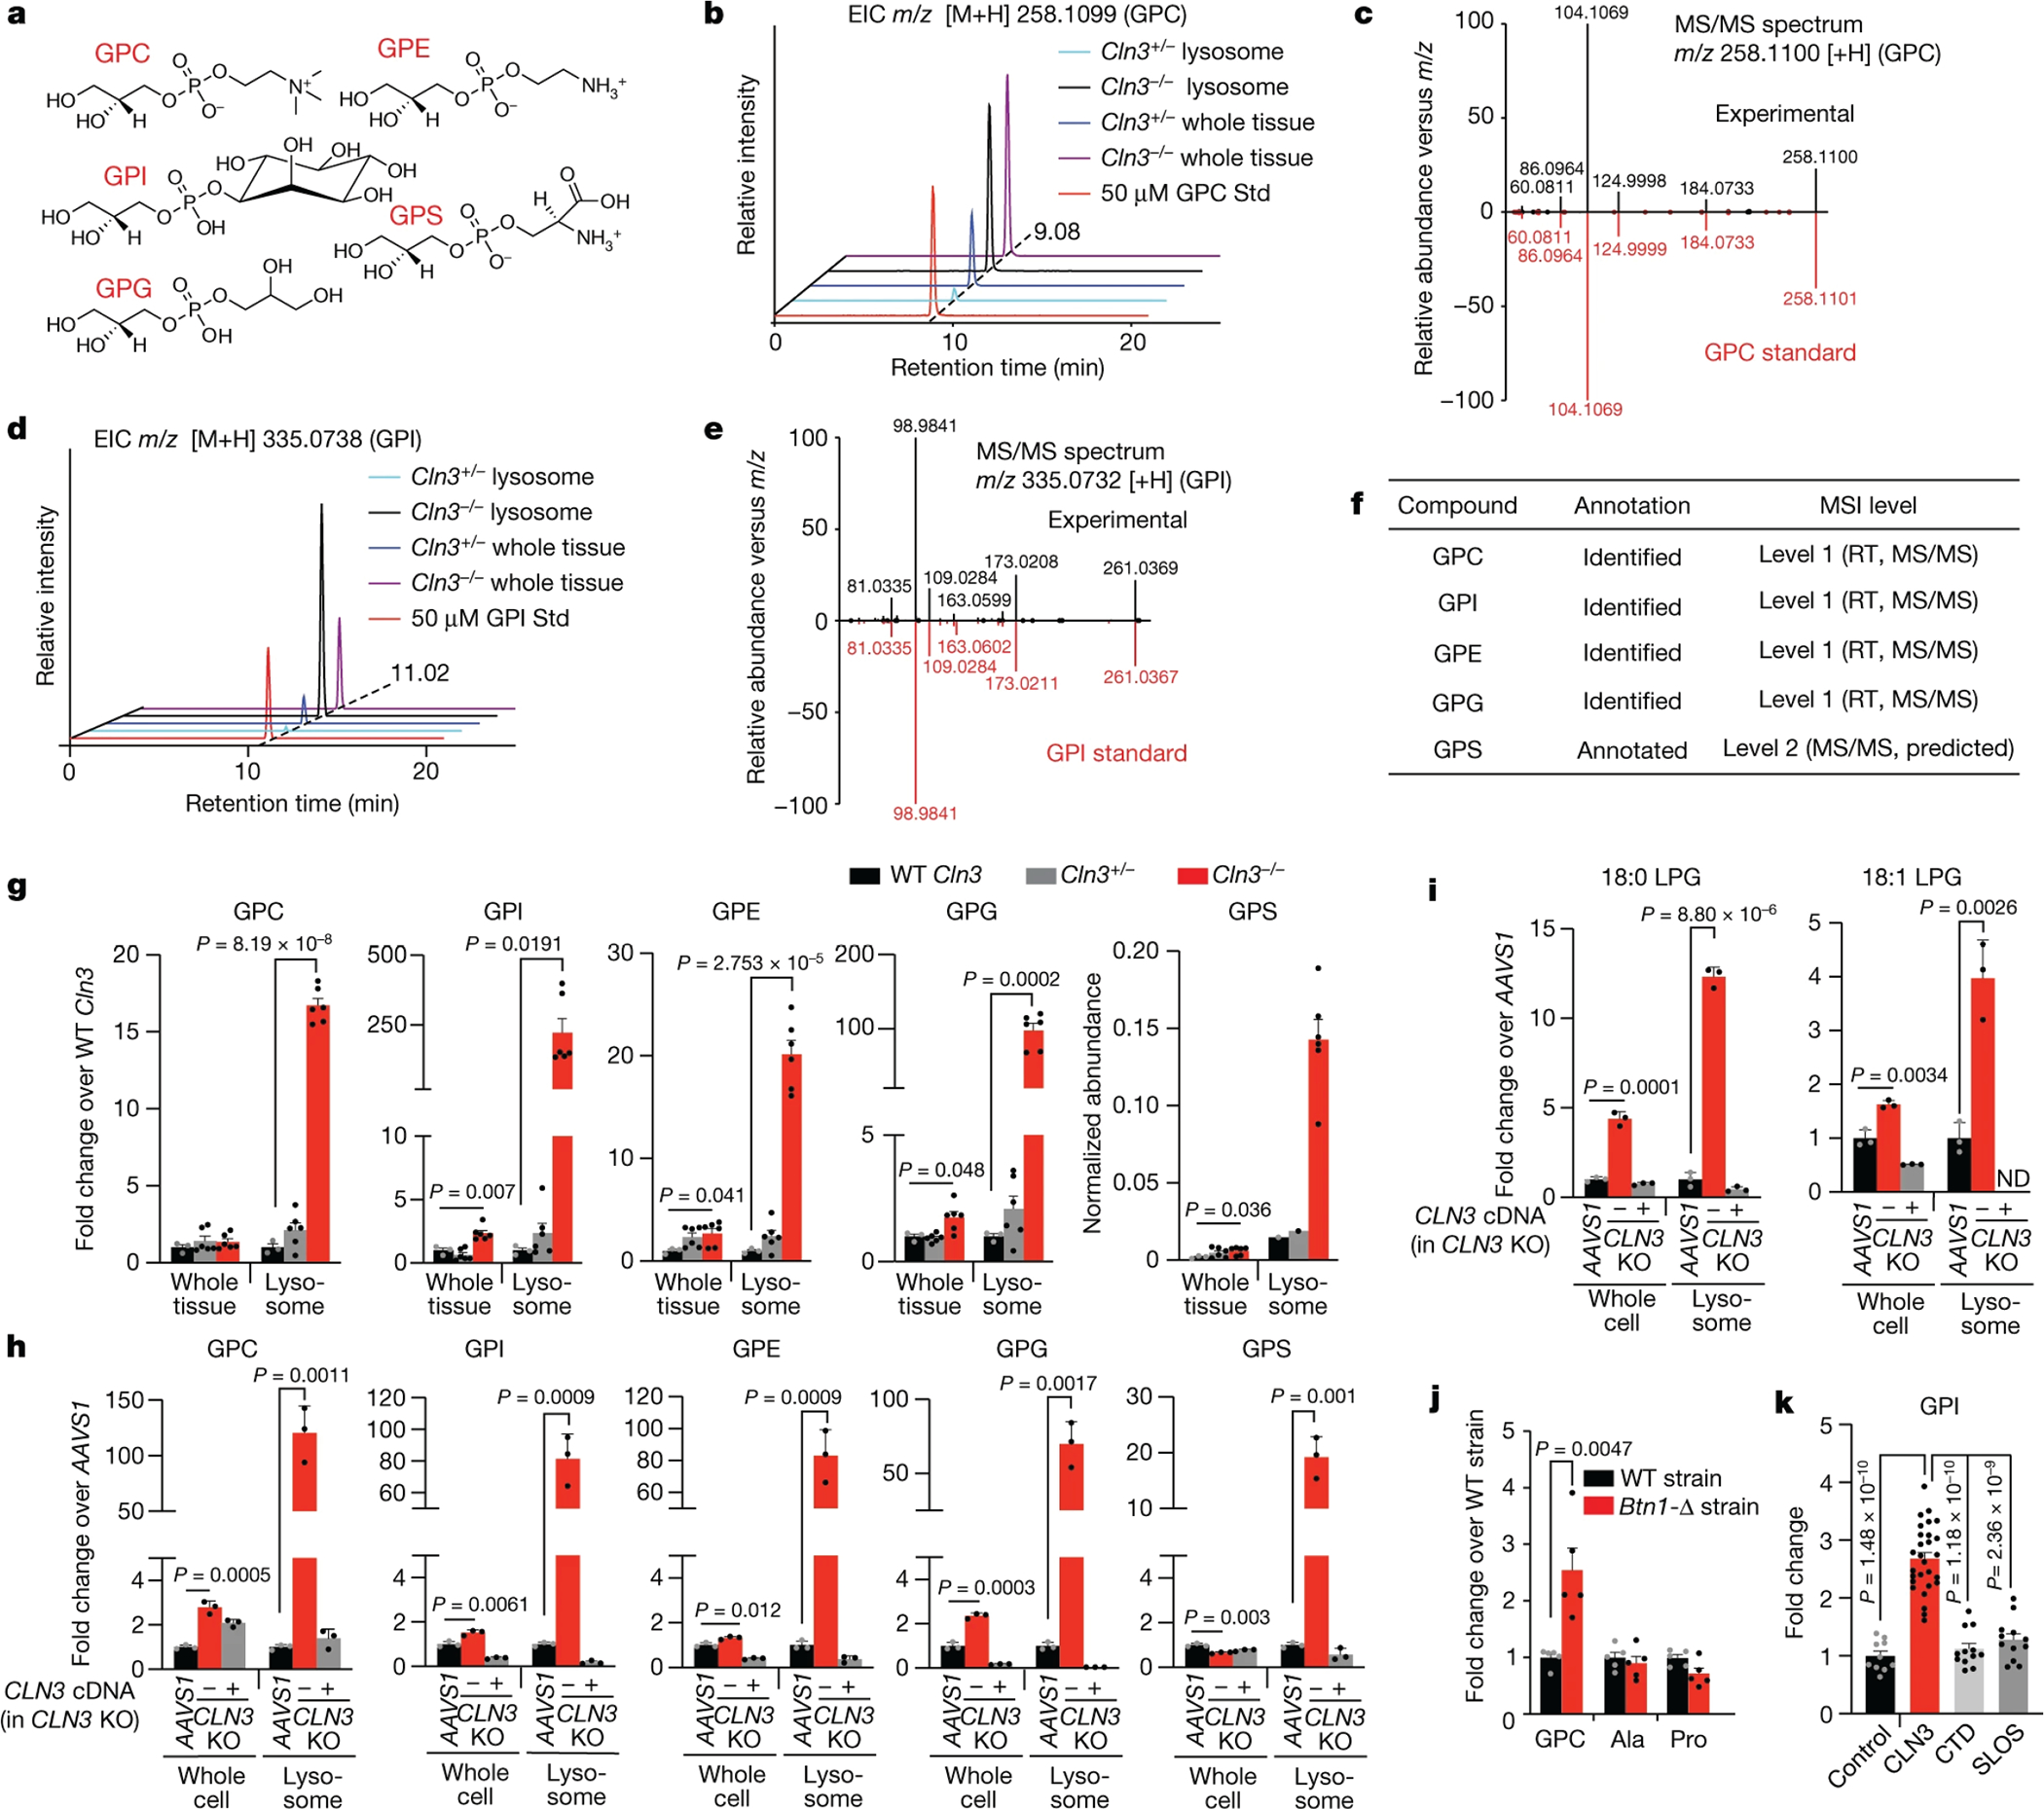
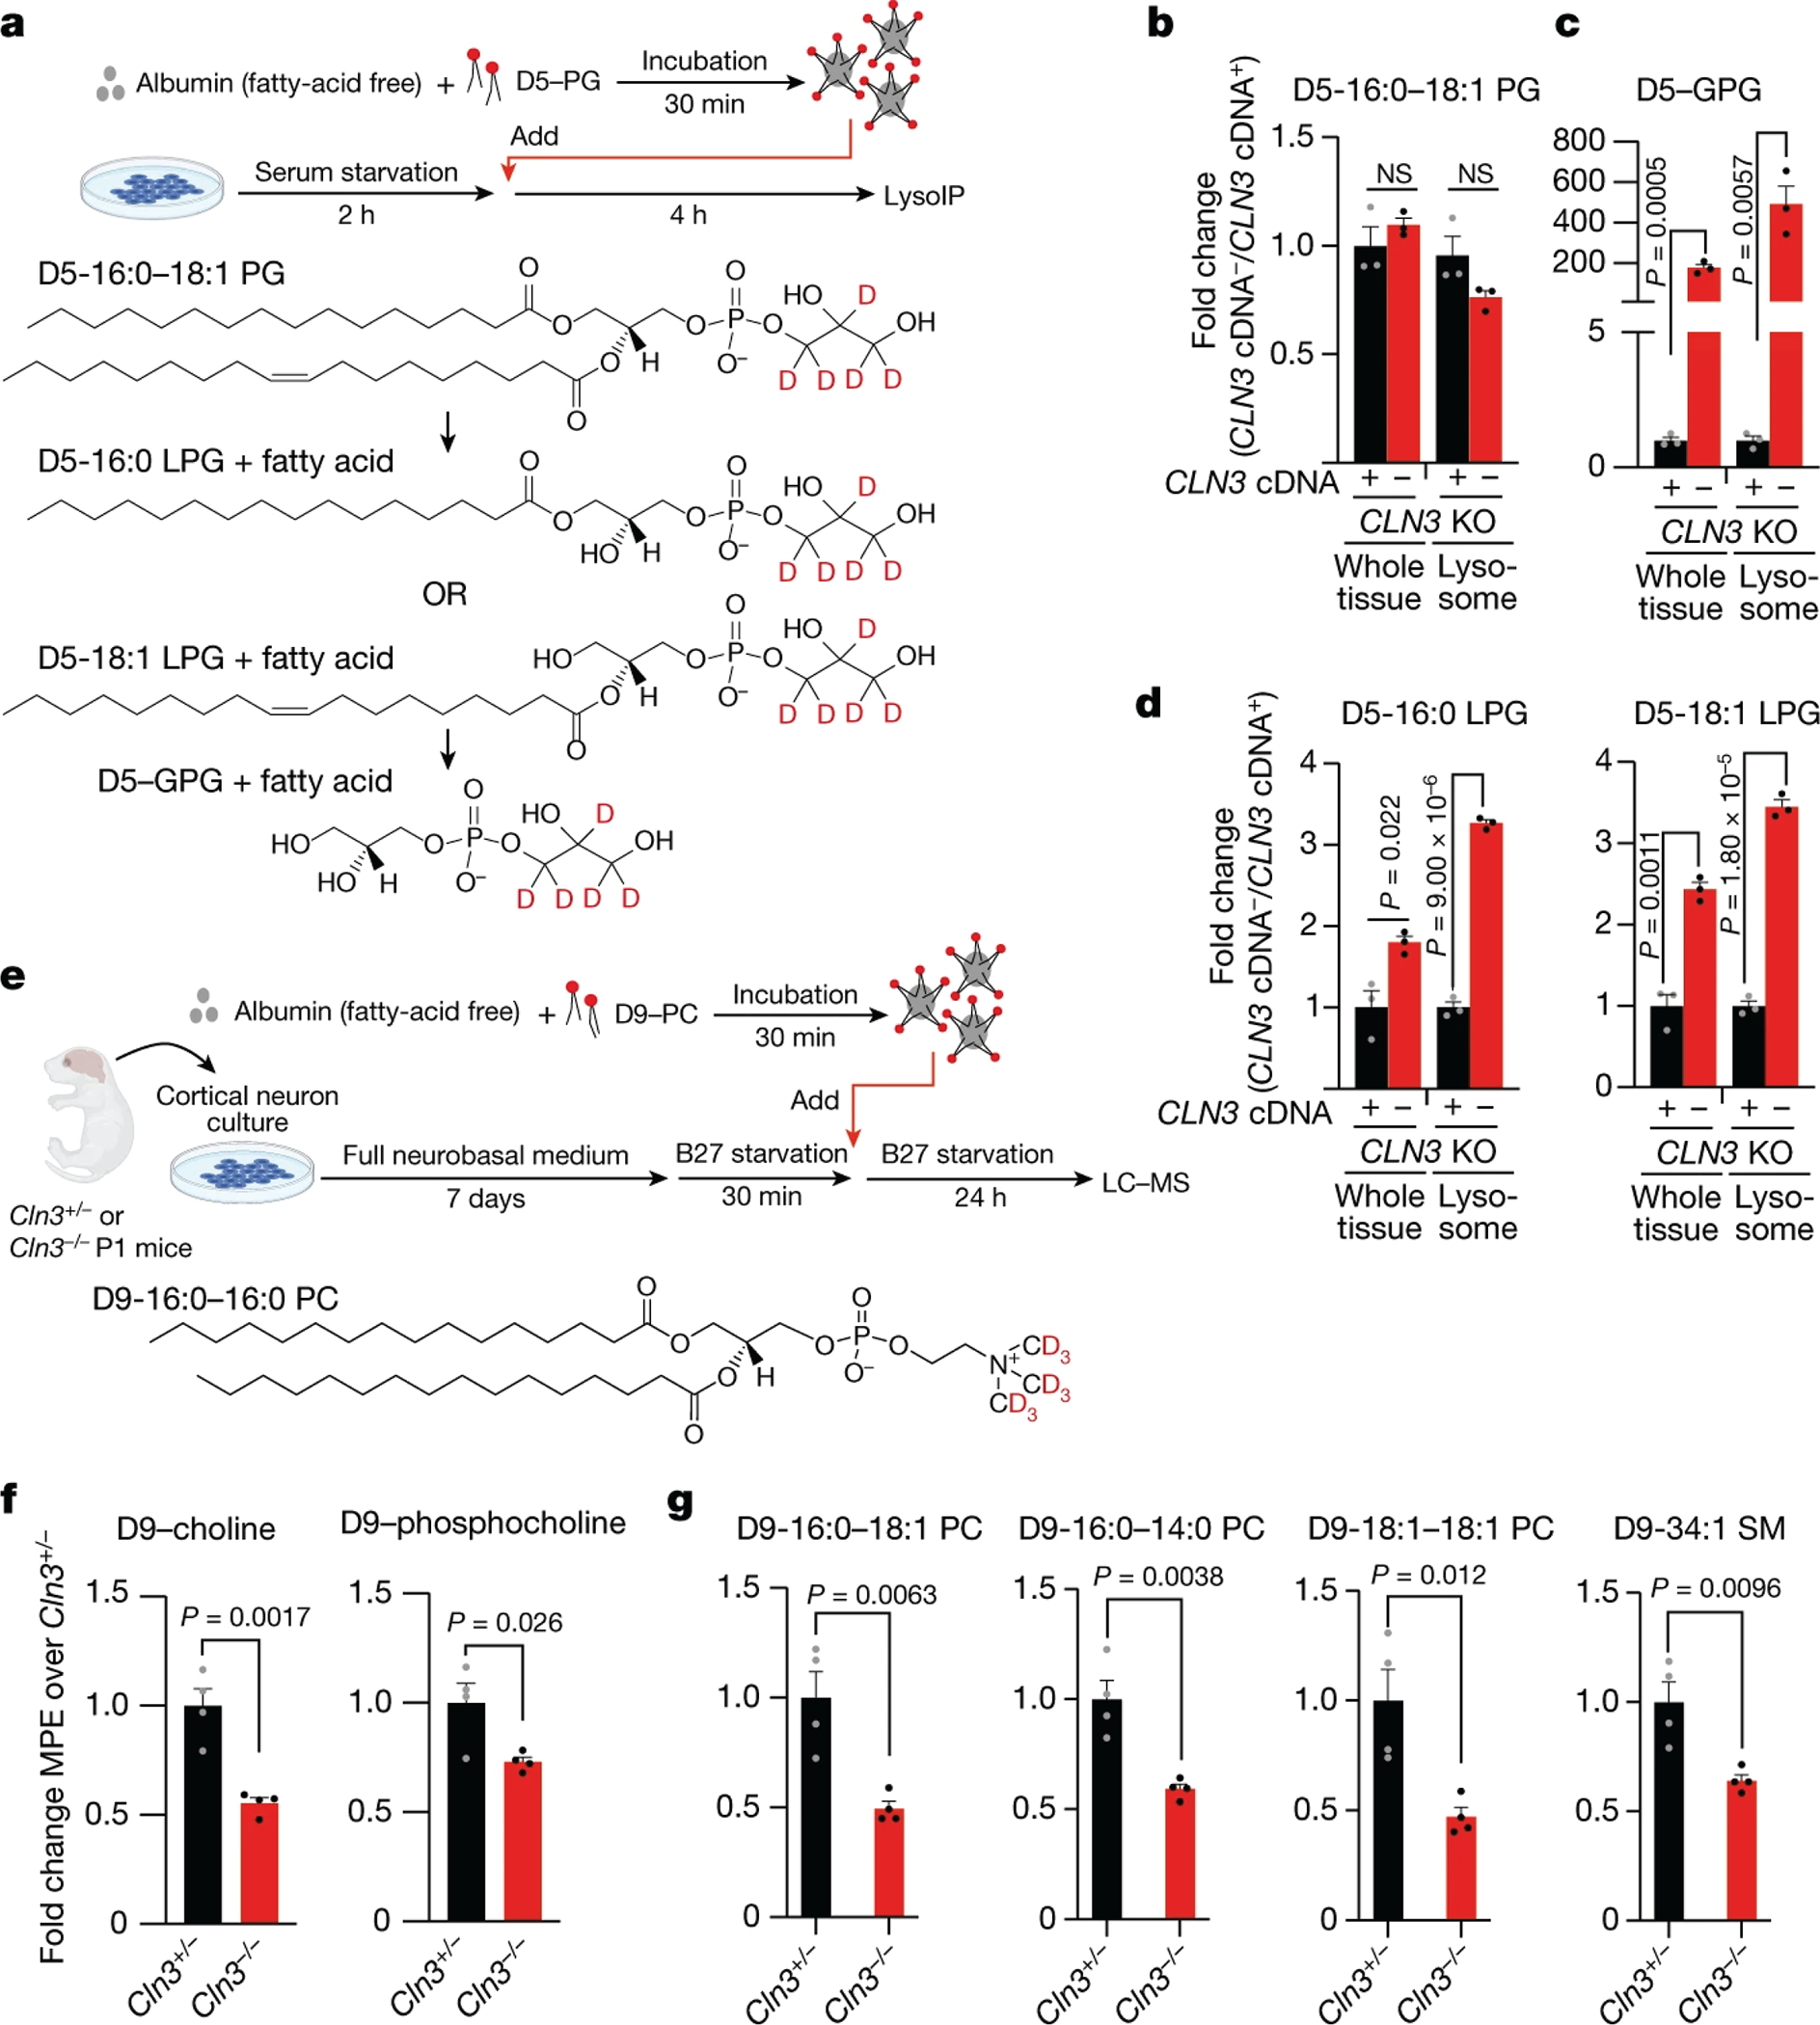
Lysosomes have many roles, including degrading macromolecules and signalling to the nucleus1. Lysosomal dysfunction occurs in various human conditions, such as common neurodegenerative diseases and monogenic lysosomal storage disorders (LSDs)2-4. For most LSDs, the causal genes have been identified but, in some, the function of the implicated gene is unknown, in part because lysosomes occupy a small fraction of the cellular volume so that changes in lysosomal contents are difficult to detect. Here we develop the LysoTag mouse for the tissue-specific isolation of intact lysosomes that are compatible with the multimodal profiling of their contents. We used the LysoTag mouse to study CLN3, a lysosomal transmembrane protein with an unknown function. In children, the loss of CLN3 causes juvenile neuronal ceroid lipofuscinosis (Batten disease), a lethal neurodegenerative LSD. Untargeted metabolite profiling of lysosomes from the brains of mice lacking CLN3 revealed a massive accumulation of glycerophosphodiesters (GPDs)-the end products of glycerophospholipid catabolism. GPDs also accumulate in the lysosomes of CLN3-deficient cultured cells and we show that CLN3 is required for their lysosomal egress. Loss of CLN3 also disrupts glycerophospholipid catabolism in the lysosome. Finally, we found elevated levels of glycerophosphoinositol in the cerebrospinal fluid of patients with Batten disease, suggesting the potential use of glycerophosphoinositol as a disease biomarker. Our results show that CLN3 is required for the lysosomal clearance of GPDs and reveal Batten disease as a neurodegenerative LSD with a defect in glycerophospholipid metabolism.


Conflict of interest statement

Competing Interests

M.A-R. is a scientific advisory board member of Lycia Therapeutics. A.D.D. and F.D.P. have a collaborative research agreement with Amicus Therapeutics, Inc. All other authors declare no competing interests.

Figures

Extended Data Fig. 1:
Extended Data Fig. 1:. The effects of LysoTag expression on lysosomes in vivo
(A) In the constitutive LysoTag mice, TMEM192–3xHA is expressed across all tissues examined as determined by immunoblotting using antibodies to the HA epitope. No difference in the expression of lysosomal markers Lamp-1, Cathepsin B, C, and D is observed upon the expression of TMEM192–3xHA. Vinculin and AKT were used as loading controls. Numbers indicate molecular weights in kDa according to protein standards run on the same gel. Immunoblot is representative of two independent experiments. (B) Normalized body weights of mice with the indicated genotypes at 5–9 weeks of age. Mice were weighed individually. The body mass of each mouse was normalized to the mean mass of sex-matched wild-type littermates before pooling by genotype for statistical analyses using a two-tailed unpaired t-test. (n=25, 19, and 10 for Wild type, LysoTag+, and LysoTagLSL mice, respectively.). (C) and (D) Measurement of lysosomal hydrolase activity in brain and liver tissues of the constitutive LysoTag mice shows no effect of TMEM192–3xHA expression on lysosomal function. For measuring Cathepsin B activity, its fluorogenic substrate was incubated with homogenates of the corresponding tissues (see methods). For determining β-hexosaminidase activity, fluorogenic 4-methylumbelliferyl (MUF)- N-acetyl-β-Glucosaminide was used as a substrate (see methods). Fluorescence was measured at 37°C and data were shown following the subtraction of background fluorescence observed in the absence of homogenate (mean ± SEM; n=4). (E) and (F) Representative transmission electron micrographs showing lysosomes from brain and liver tissues of LysoTag− (control) and LysoTag+ mice. Lysosomes were identified by the presence of a single membrane and granular, electron-dense appearance. White and Red arrowheads indicate lysosomes in cells from LysoTag− and LysoTag+ mice, respectively. n=2 mice per group and scale bar, 500 nm. The graph showing the mean diameter of lysosomes in multiple quantified cells. The diameter of lysosome in each group was generated by measuring lysosomes using ImageJ v1.52. (For brain, n=42 and n=55 measured lysosomes from LysoTag− and LysoTag+ mice, respectively. For liver, n=51 and n=56 measured lysosomes LysoTag− and LysoTag+ mice, respectively​. Data presented as mean ± SEM. n.s: non-significant; Two-tailed unpaired t-test (E, F). (G) Heatmap presentation of the enrichment of early- and late-endosomal markers as well as those for lysosome in the LysoIP performed from mouse liver tissue. Enrichment values are derived from Supplementary Table 1.
Extended Data Fig. 2:
Extended Data Fig. 2:. Generation and validation of LysoTag mouse model for Batten disease studies
(A) Schematic depicting the breeding strategy to generate LysoTag models for Batten disease studies. Cln3−/− mice were crossed with heterozygous constitutive LysoTag mice and their progeny were then crossed back to Cln3−/− animals to generate the indicated experimental mouse genotypes. Mouse drawing was created with BioRender. (B) Expression and localization of the TMEM192–3xHA fusion protein to lysosomes in brain neurons of Cln3+/+, Cln3+/− and Cln3−/− LysoTag mice. TMEM192–3xHA, lysosomes and neurons were detected in an immunofluorescence assay using antibodies to the HA epitope the lysosomal marker, Lamp-1 and the neuronal marker Neu-N, respectively. Scale bar = 5 μm, and magnified insets are labeled with white boxes in the main image. Percentage of colocalization between TMEM192–3xHA and Lamp1 shown in the right panel was measured in n=7 cells per genotype. Data are shown as mean ± SEM. Micrographs are representative of at least three independent experiments. (C) Volcano plot comparing the lipidomic data from whole brain homogenates of Cln3+/− and Cln3−/− mice shows that only few lipids change significantly and they belong to phospholipids (yellow) and lysophosphatidylglycerol (LPG) in red. Loss of CLN3 also led to a decrease in the brain of bis(monoacylglycero)phosphate (BMP), a class of lysosomal lipids (blue). BMP/PG (cyan) annotation was used when MS/MS fragmentation was not acquired (see Supplementary Table 3 and methods for details). Horizontal line indicates a p-value of 0.05, and vertical dotted lines a fold change of 2. Each dot represents a lipid species. Data were acquired in negative ion mode and normalized to internal lipid standards for the best-matched lipid class (n = 5 and 4 for Cln3+/− and Cln3−/− mice, respectively). Female mice with an average age of 7 months were used. Data are in Supplementary Table 3. Two-tailed unpaired t-test was used.
Extended Data Fig. 3:
Extended Data Fig. 3:. Validation of glycerophosphodiesters (GPDs) as the metabolites that accumulate in lysosomes upon CLN3 loss
(A) Identification and annotation of metabolites using untargeted metabolomics analyses. Overview of our untargeted metabolomics experimental workflow. MS1 data were collected for every sample using full scan mode on a high-resolution accurate-mass instrument. MS/MS data were collected from pooled samples only to aid with compound identification. Data were then analyzed using Thermo Compound Discoverer v3.1 to generate a list of unique features which were deconvoluted into a list of unique compounds. Differential and statistical analyses were performed. Compounds which were statistically significant in the differential analyses were validated and identified using authentic standards, when available. If no authentic standard was available, compounds were annotated by comparing MS/MS data to a database, or in silico fragmentation prediction (competitive fragmentation modelling-ID, CFM-ID). Data were then reported according to the Metabolomics Standards Initiative (MSI) guidelines. (B) and (C) Mirror plots for GPC and GPI in negative ion mode, respectively. Fragments common to the glycerol-phosphate group are indicated with an asterisk*. Fragments common to those found in the MS/MS spectra reported by Kopp et al. are indicated with †. (D) EICs for GPE and GPG across a range of samples were analyzed alongside in-house generated standards (Std) and showed a matching retention time (RT). (E) and (F) Mirror plots for GPE and GPG, respectively. Fragments common to the glycerol-phosphate group are indicated with an asterisk*. Fragments common to those found in the MS/MS spectra reported by Kopp et al. are indicated with †. (G) Mirror plots showing MS/MS spectra for GPS from experimental samples compared to MS/MS spectra generated in silico using CFM-ID. Fragments common to the glycerol-phosphate group are indicated with an asterisk*. Fragments common to those found in the MS/MS spectra reported in Kopp et al. are indicated with †. (H) Amplicon sequencing was used to validate CLN3 knock out cells generated using CRISPR-Cas9. Three mutant alleles were identified and all were found to generate frameshift deletions in the CLN3 coding sequence as compared to the wild-type sequence. (I) Localization of Flag-CLN3 protein to lysosomes. Flag-CLN3 and lysosomes were detected in an immunofluorescence assay using antibodies to the Flag epitope and the lysosomal marker Lamp-2, respectively. Scale bar = 5 μm. Micrographs are representative images of three experiments. (J) Changes in GPD levels in CLN3-deficient cells expressing TMEM192–3xHA tag or Lamp1–3xHA tag. Data presented as a comparison between the increase in the lysosomal abundance of GPDs upon CLN3 loss in Lamp1–3xHA tagged lysosomes relative to that in TMEM192–3xHA tagged lysosomes (mean ± SEM; n=4 biologically independent samples). n.s: non-significant; Two-tailed unpaired t-test.
Extended Data Fig. 4:
Extended Data Fig. 4:. Testing the effects of CLN3 loss on lysosomal pH and cellular lipid metabolism
(A) to (D) CLN3 loss does not increase lysosomal pH. (A) A standard calibration curve of the ratiometric dye LysoSensor Yellow/Blue DND-160. See methods for experimental details. (B) Lysosomal pH in wild-type and CLN3-KO HEK293T cells as calculated using the standard curve in A. Data are presented as mean ± SD, n=12 biologically independent samples. (C) Targeted analyses of the fold changes in whole-cell and lysosomal levels of GPDs upon treatment with 500 nM Bafilomycin A1 for 6 hours in CLN3 expressing HEK-293T cells. Data are presented as mean ± SD, n=3 biologically independent samples, (Two-tailed unpaired t-test). (D) The levels of several amino acids whose egress from lysosomes is sensitive to the proton gradient across the lysosomal membrane are not affected by CLN3 loss. The levels of proline, alanine, and glutamate in whole cells and lysosomes were compared between CLN3-KO cells with and without CLN3 cDNA addback and upon treatment with 500 nM Bafilomycin A1 (BafA1) for 6 hours. Data are presented as mean ± SD, n=3 biologically independent samples, (Two-tailed unpaired t-test). (E) The recombinant CLN3 protein does not have glycerophosphodiesterase activity. GPC-d9 was incubated with recombinant 3xFLAG-CLN3 or the positive control glycerophosphodiesterase1 (3x-FLAG-GDE-1) for the indicated time points. The extent of GPC-d9 hydrolysis was determined by measuring the decline in its level and the increase in the levels of the product D9-choline. Data presented as mean ± SEM of n=3 biologically independent samples. (F) CLN3 loss does not decrease tracer uptake. Fold change in tracer levels (D9–16:0–16:0 PC) normalized to total protein for samples measured in Figures 4F and G. Data presented as mean ± SEM of n=4 biologically independent samples. (G) CLN3 loss does not affect the biosynthesis or turnover of PC and sphingomyelin (SM) in cells. Free D9-choline was used as a tracer. Data are presented as fold changes in the whole-cell molar percent enrichment (MPE) of D9-choline-containing lipids in cortical neuron cultures prepared from Cln3−/− mice relative to those from Cln3+/− animals (mean ± SEM, n=3 biologically independent samples, (Two-tailed unpaired t-test)).
Fig. 1:
Fig. 1:. LysoTag mouse for proteomic and metabolite profiling of tissue lysosomes
(A) Schematic of the TMEM192–3xHA fusion gene (LysoTag) in Rosa26 locus and the generation of the constitutive LysoTag line. (B) Immunofluorescence analyses of TMEM192–3xHA (HA, green) and lysosomes (Lamp-1, red) in the liver. Blue marks nuclei. Scale bar = 5 μm and 1 μm in insets. Micrographs are representative of three independent experiments. (C) Immunoblot analyses for protein markers of subcellular compartments in whole tissues, purified lysosomes (IP: LysoTag+), and control immunoprecipitates (IP: LysoTag−). Golgin-97, VDAC and Calreticulin were used for the Golgi, mitochondria and ER, respectively, and Lamp-1 and Cathepsin C for lysosomes. Immunoblots are representative of three independent experiments. (D, E) Proteomic analyses of liver LysoIPs. Principal component analysis comparing levels of detected proteins (D). (E) Volcano plot showing that previously annotated lysosomal proteins (orange dots) are enriched in lysosomes. Enriched unannotated proteins are in black. Vertical dashed lines indicate log2 fold change > 1.5 in LysoTag+ IPs either over control IP (left) or whole tissue (right). Horizontal dashed lines indicate a q value < 0.01. n=3 male mice with average age of 6.5 weeks. Paired t-test performed at the peptide precursor level. P values were corrected for multiple testing as described by Storey. (F) Relative abundance of indicated metabolites in whole tissue and IPs. Not detected (N.D.). Values are mean ± SEM. LysoTag+ (n=4) and LysoTag− (n=3). (G) Heat map of the mean of log2-transformed fold changes in metabolite levels after a 16-hour fast. See Supplementary Table 2. (H) Fold changes in the levels of nucleosides upon fasting (mean ± SEM, ad libitum (n=4) or fasted (n=3) for G and H. Two-tailed unpaired t-test (F, H). Male mice with an average age of 5.5 weeks were used (F-H).
Fig. 2:
Fig. 2:. Loss of CLN3 leads to significant alterations in metabolite levels in brain lysosomes
(A) Immunoblot analyses of organellar protein markers in whole-tissue fractions, purified lysosomes, and control IP. Lamp-1, Cathepsin B and D were used for lysosomes. Golgin-97, Calreticulin, VDAC, Catalase, S6 Kinase and Histone H3 were used for the Golgi, ER, mitochondria, peroxisomes, the cytosol and the nucleus, respectively. Immunoblots are representative of three independent experiments. (B) Volcano plot comparing untargeted LysoIP lipidomic data from lysosomes derived from brains of Cln3+/− and Cln3−/− mice. Significantly changing lipids belong to phospholipids (yellow), lysophosphatidylglycerol (LPG) (red), lysophosphatidylcholine (orange), bis(monoacylglycero)phosphate (BMP) (blue). BMP/PG (cyan) annotation was used when MS/MS fragmentation was not acquired. Data in Supplementary Table 3. Horizontal line indicates a p-value of 0.05, and vertical dotted lines a fold change of 2. Two-tailed unpaired t-test was used. (C) Targeted analyses of LPGs. Fold changes in LPGs in lysosomes from Cln3+/− and Cln3−/− mice were calculated after subtracting background from control IP. Values represent mean ± SEM (Two-tailed unpaired t-test). For B and C, n=5 and 4 female mice (7 months of age) for Cln3+/− and Cln3−/− mice, respectively. (D, E) Untargeted polar metabolite analyses of brain lysosomes and tissues upon CLN3 loss (Supplementary Table 4 and methods). Principal component (PC) analysis comparing the levels of the 189 unique compounds (see text) between whole-tissue or lysosome samples from brains of Cln3+/− and Cln3−/− mice in (D). (E) Volcano plot of lysosomal changes in these compounds. Horizontal line indicates a p-value of 0.05, and vertical ones represent fold changes of 4. n=3 male mice (7 months of age) per genotype. P-values were calculated by ANOVA with Tukey HSD test. The p-values were corrected by the Benjamini-Hochberg method, FDR= 5%.
Fig. 3:
Fig. 3:. Glycerophosphodiesters (GPDs) accumulate in lysosomes upon CLN3 loss
(A) The chemical structure of GPDs in this study. (B) Extracted ion chromatogram (EIC) for GPC across a range of samples alongside an authentic standard (Std) showing a matching retention time. (C) Mirror plot for MS/MS spectrum of GPC in a representative sample (lysosomes from Cln3−/− mouse brain) and an authentic standard. (D) As in B for GPI. (E) As in C for GPI. (F) The level of confidence in the identification of GPDs in this study according to MSI guidelines. (G) Targeted analyses of GPDs in brain lysosomes. Fold changes between lysosomes were calculated after subtracting the background signal in control IPs and normalizing to methionine. GPS was only detected in one WT and Cln3+/− lysosomal sample, thus its abundance was reported instead. Data are mean ± SEM; WT Cln3 (n=3), Cln3+/− (n=6) and Cln3−/− (n=6). Male mice from two independent experiments including that in Fig. 2E. (H) Fold change in the levels of GPDs between HEK-293T cells and their lysosomes upon CLN3 knockout and rescue. sgRNA targeting the AAVS locus was used as control. (I) Targeted analyses of LPGs from cells as in (H). Data are mean ± SD (H, I); n=3 biologically independent samples (H, I). (J) Fold change in the levels of GPC, alanine (Ala), and proline (Pro) between wild-type (WT) and Btn1-Δ yeast strains. Data are mean ± SEM (n=5 biologically independent samples). (K) Fold change in GPI levels in CSF from patients with CLN3 Batten disease (CLN3, n=28), creatine transporter deficiency (CTD, n=12), and Smith-Lemli-Opitz Syndrome (SLOS, n=12) compared to anonymized pediatric controls (Control, n=10). Data are mean ± SEM. See Supplementary Table 5 for the characteristics of study participants. Two-tailed unpaired t-test (G-K).
Fig. 4:
Fig. 4:. CLN3 is required for the efflux of GPDs out of lysosomes
(A) Depiction of an approach to deliver exogenously added deuterated phospholipids to lysosomes. D5-PG: phosphatidylglycerol with 5 deuterium atoms (D) in its headgroup. (B) CLN3 loss does not affect the cellular uptake of exogenous D5-PG. Fold changes in the whole-cell and lysosomal abundances of D5-PG in CLN3 KO cells relative to those in the CLN3 KO cells rescued with the CLN3 cDNA. (C) Loss of CLN3 blocks the efflux of GPG from lysosomes. Data are presented as in (B) but for D5-GPG. (D) LPGs generated in lysosomes accumulate upon CLN3 loss. Data are presented as in (B) but for the two possible D5-LPGs that are generated from the degradation of the exogenously added D5-PG. Data are mean ± SD, n=3 (B-D). (E) to (G) GPC-derived choline contributes to lipid biosynthesis in a CLN3-dependent manner in primary cortical neurons (E) Depiction of the approach to trace the metabolic fate of the choline moiety of GPC, which is generated from Phosphatidylcholine (PC) degradation in the lysosome. Phosphatidylcholine having 9 deuterium atoms in its choline headgroup (D9–16:0–16:0 PC) was delivered to lysosomes in primary cultured neurons isolated from the cerebral cortex of Cln3+/− (control) or Cln3−/− mice. Mouse drawing from BioRender. (F) CLN3 loss significantly reduces the cellular levels of deuterated phosphocholine and its precursor choline. (G) CLN3 loss leads to a reduced contribution of choline derived from lysosomal GPC to the biosynthesis of PC and sphingomyelin (SM) in the cell. Data are presented as fold changes in the whole-cell molar percent enrichment (MPE) of D9-choline-containing metabolites in cortical neuron cultures prepared from Cln3−/− mice relative to those from Cln3+/− animals. Data are mean ± SEM, n=4 (F, G). Two-tailed unpaired t-test (B-D, F-G). n represents biologically independent samples (B-D, F-G).

References

    1. Ballabio A & Bonifacino JS Lysosomes as dynamic regulators of cell and organismal homeostasis. Nature reviews. Molecular cell biology 21, 101–118, doi:10.1038/s41580-019-0185-4 (2020). - DOI - PubMed
    1. Medoh UN, Chen JY & Abu-Remaileh M Lessons from metabolic perturbations in lysosomal storage disorders for neurodegeneration. Current Opinion in Systems Biology 29, 100408, doi:10.1016/j.coisb.2021.100408 (2022). - DOI
    1. Platt FM, d’Azzo A, Davidson BL, Neufeld EF & Tifft CJ Lysosomal storage diseases. Nat Rev Dis Primers 4, 27, doi:10.1038/s41572-018-0025-4 (2018). - DOI - PubMed
    1. Ferguson SM Neuronal lysosomes. Neurosci Lett 697, 1–9, doi:10.1016/j.neulet.2018.04.005 (2019). - DOI - PMC - PubMed
    1. Perera RM & Zoncu R The Lysosome as a Regulatory Hub. Annual review of cell and developmental biology 32, 223–253, doi:10.1146/annurev-cellbio-111315-125125 (2016). - DOI - PMC - PubMed

MeSH terms