. 2022 Oct;610(7930):190-198.
doi: 10.1038/s41586-022-05242-7. Epub 2022 Sep 21.

A cellular hierarchy in melanoma uncouples growth and metastasis

Affiliations

A cellular hierarchy in melanoma uncouples growth and metastasis

Panagiotis Karras et al. Nature. 2022 Oct.

Erratum in

  • Author Correction: A cellular hierarchy in melanoma uncouples growth and metastasis.
    Karras P, Bordeu I, Pozniak J, Nowosad A, Pazzi C, Van Raemdonck N, Landeloos E, Van Herck Y, Pedri D, Bervoets G, Makhzami S, Khoo JH, Pavie B, Lamote J, Marin-Bejar O, Dewaele M, Liang H, Zhang X, Hua Y, Wouters J, Browaeys R, Bergers G, Saeys Y, Bosisio F, van den Oord J, Lambrechts D, Rustgi AK, Bechter O, Blanpain C, Simons BD, Rambow F, Marine JC. Karras P, et al. Nature. 2022 Nov;611(7934):E4. doi: 10.1038/s41586-022-05415-4. Nature. 2022. PMID: 36261534 No abstract available.

Abstract

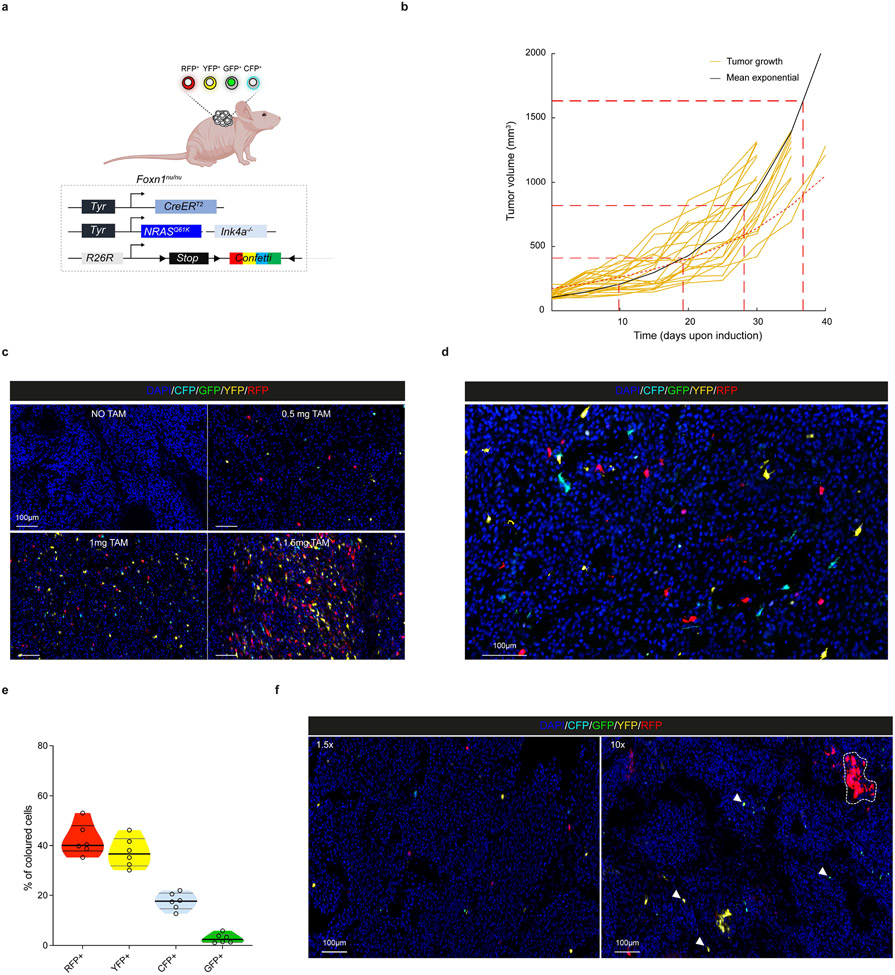
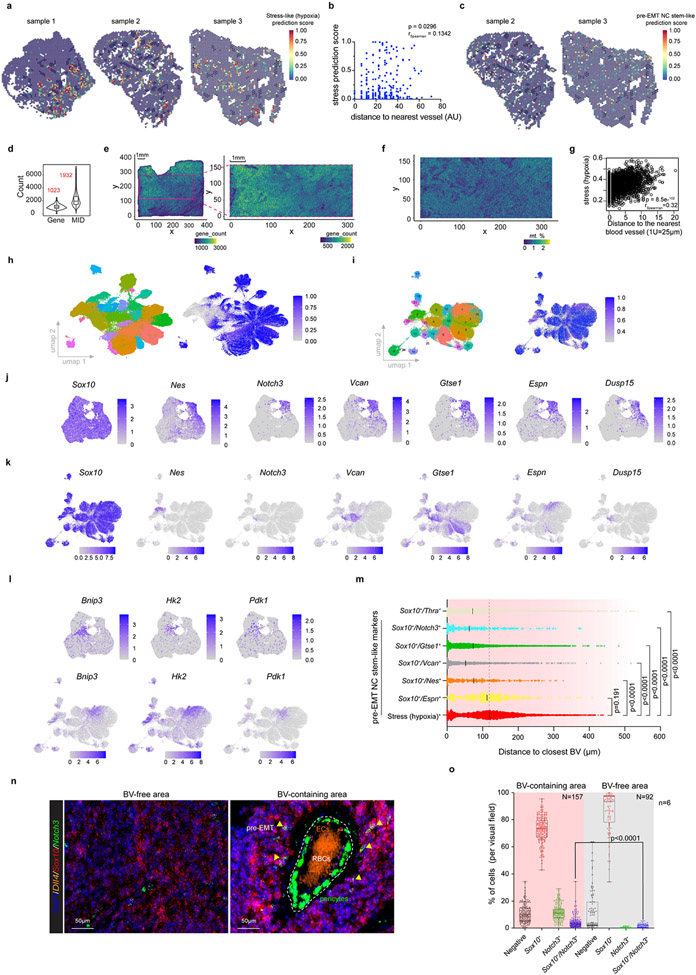
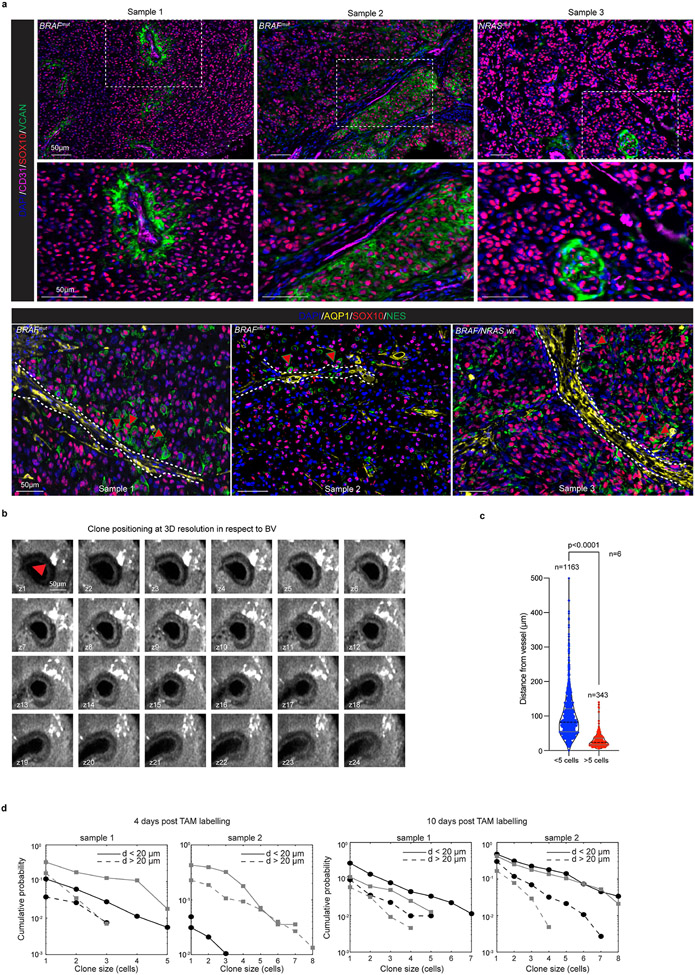
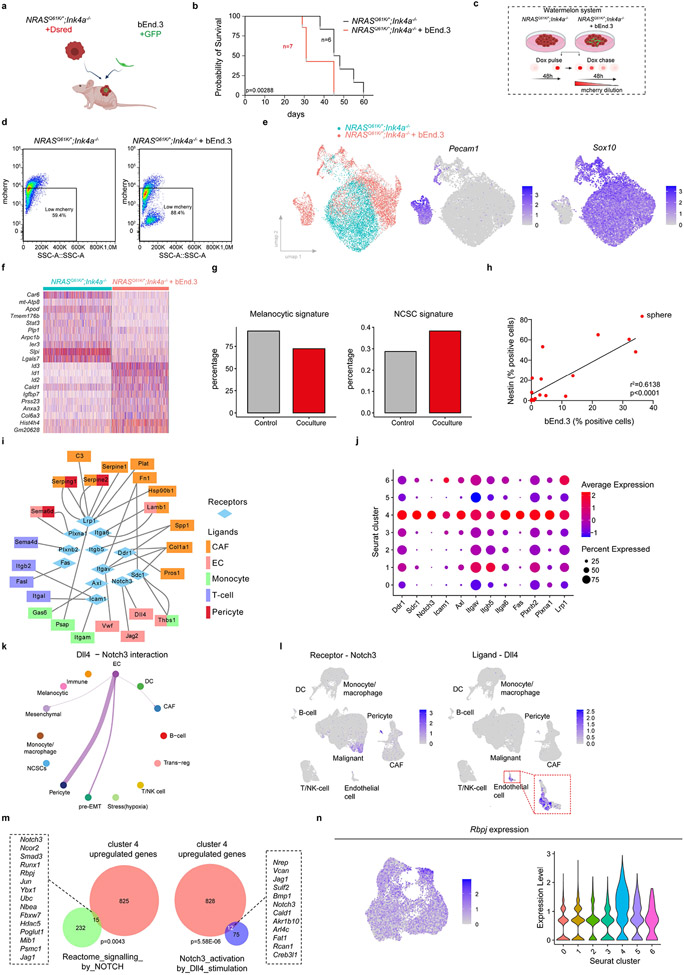
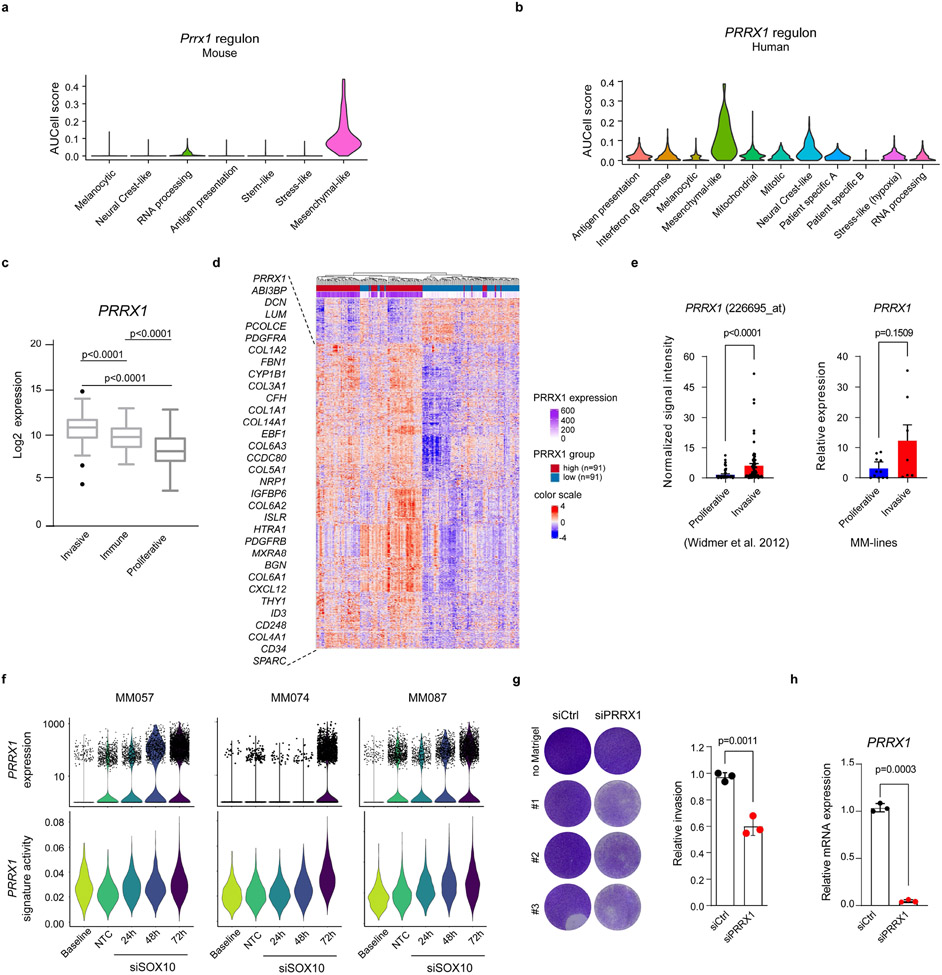
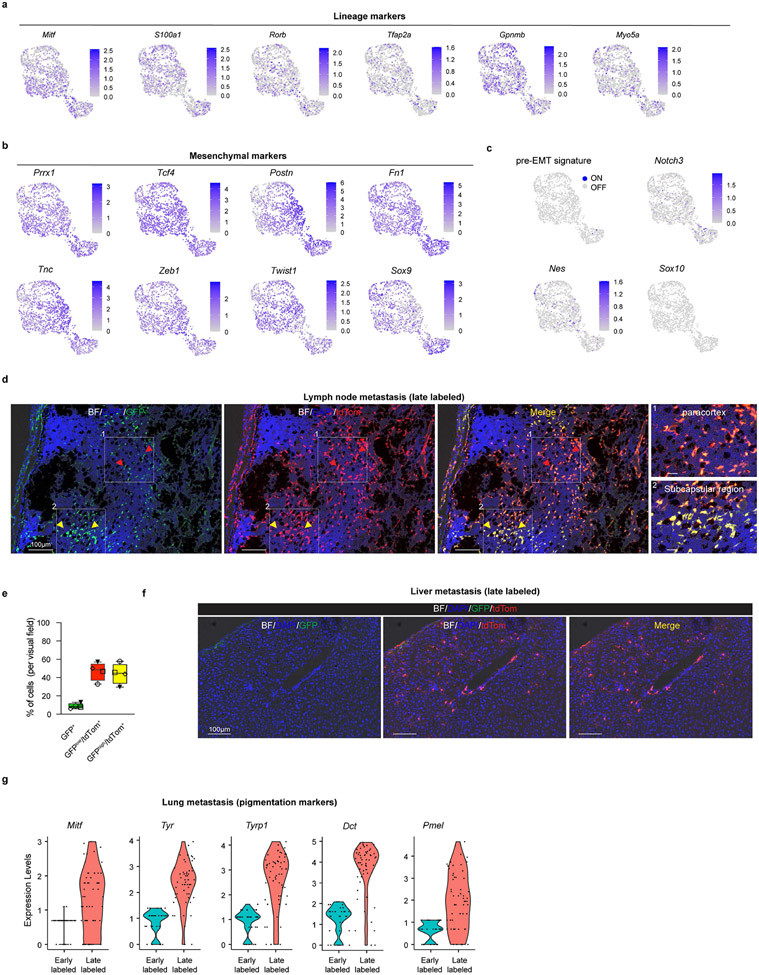
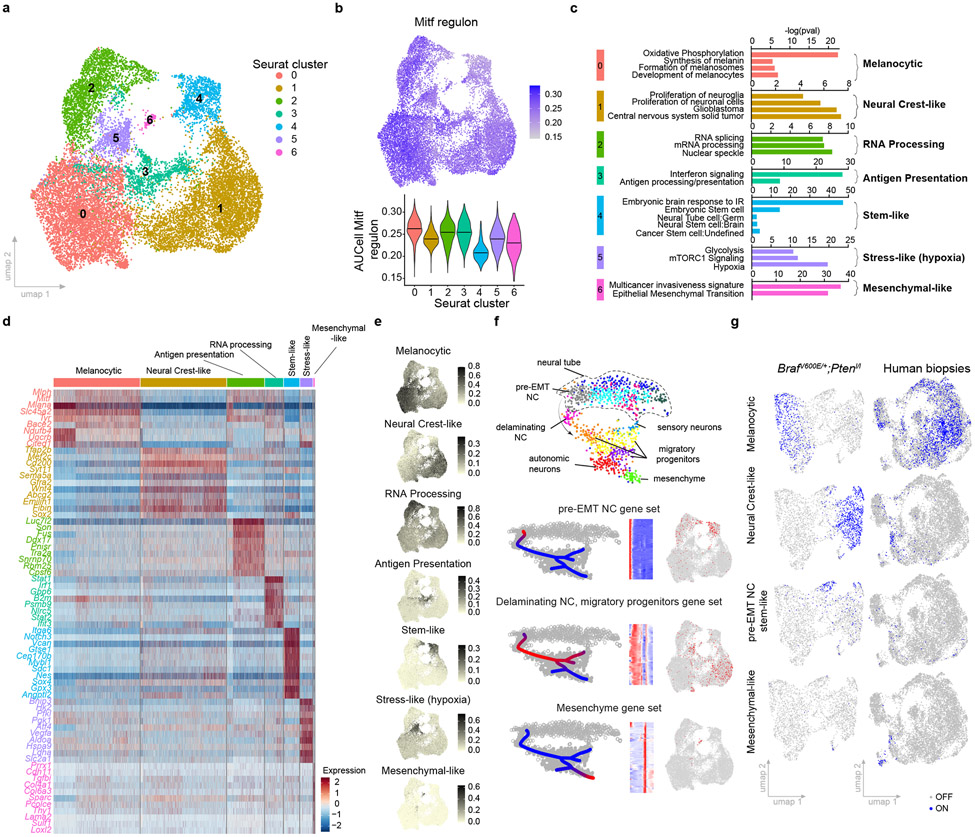
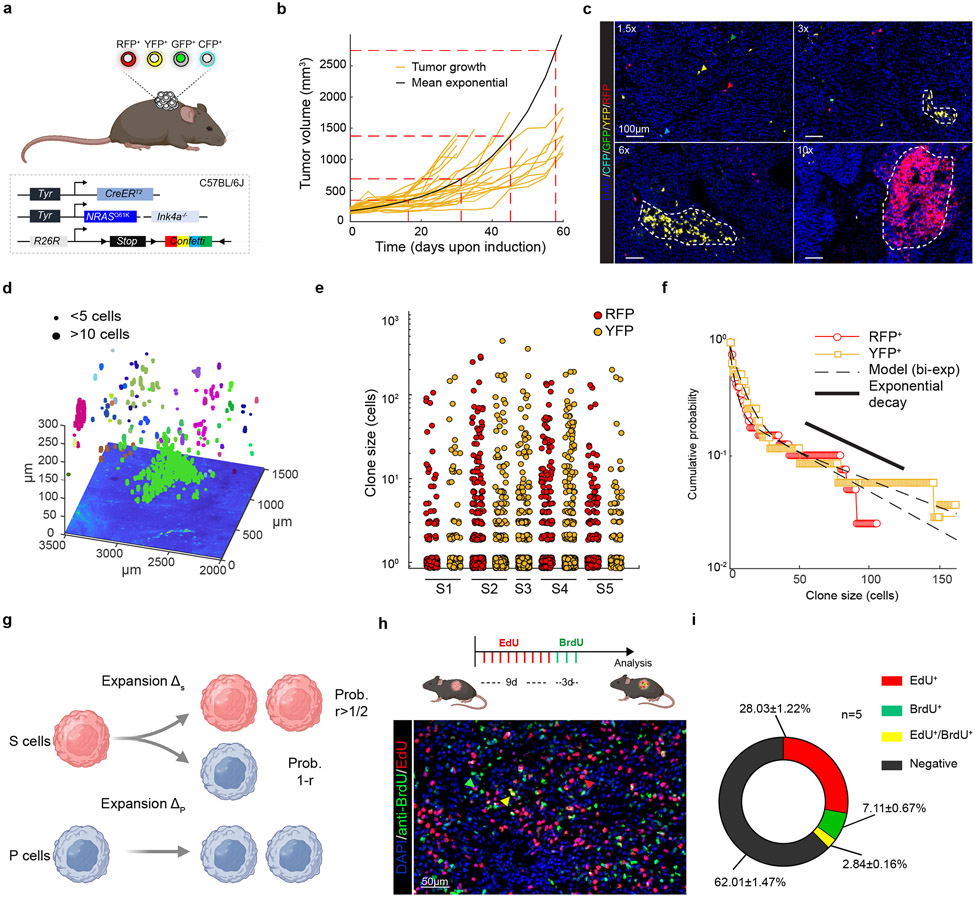
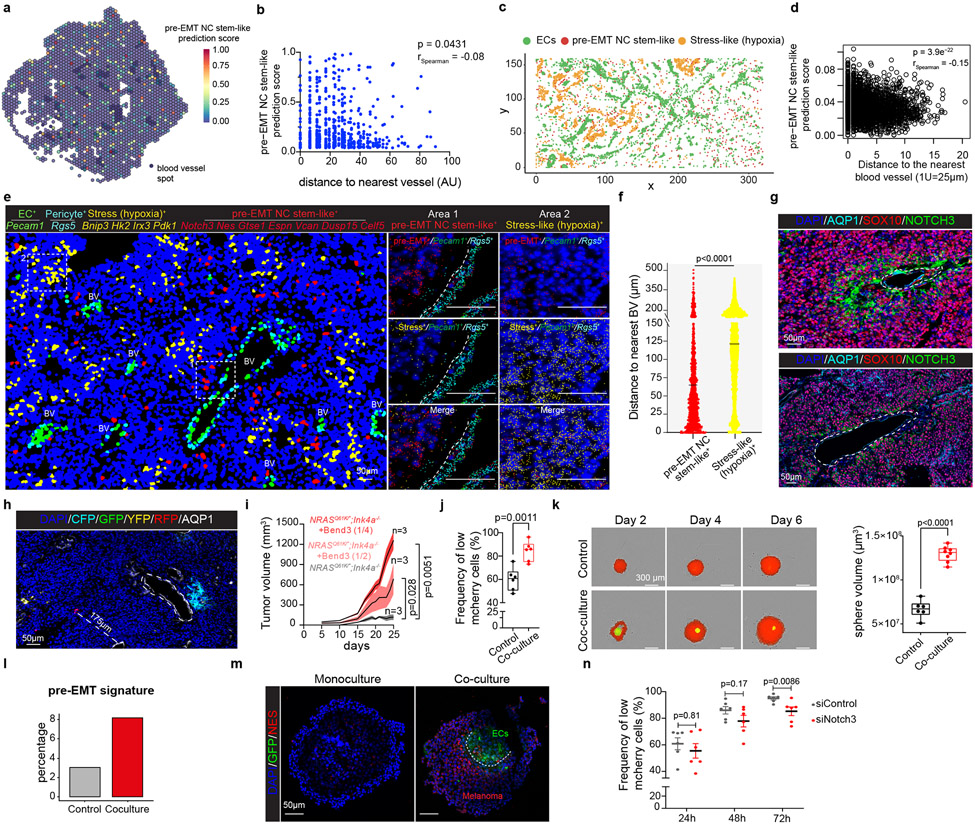
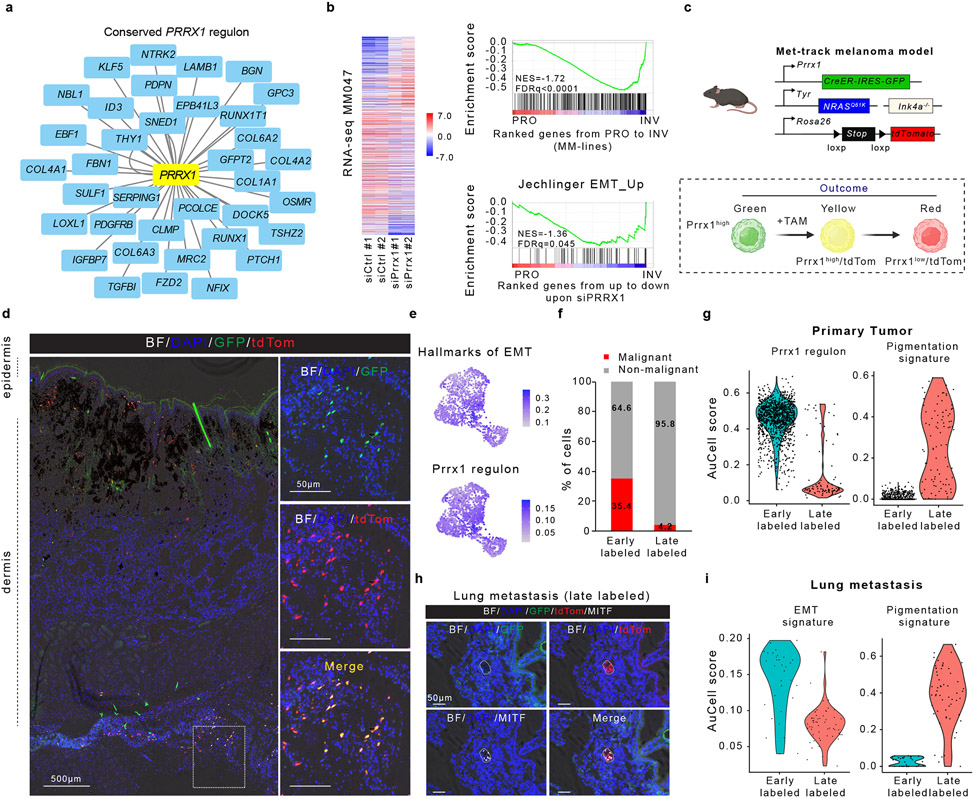
Although melanoma is notorious for its high degree of heterogeneity and plasticity1,2, the origin and magnitude of cell-state diversity remains poorly understood. Equally, it is unclear whether growth and metastatic dissemination are supported by overlapping or distinct melanoma subpopulations. Here, by combining mouse genetics, single-cell and spatial transcriptomics, lineage tracing and quantitative modelling, we provide evidence of a hierarchical model of tumour growth that mirrors the cellular and molecular logic underlying the cell-fate specification and differentiation of the embryonic neural crest. We show that tumorigenic competence is associated with a spatially localized perivascular niche, a phenotype acquired through an intercellular communication pathway established by endothelial cells. Consistent with a model in which only a fraction of cells are fated to fuel growth, temporal single-cell tracing of a population of melanoma cells with a mesenchymal-like state revealed that these cells do not contribute to primary tumour growth but, instead, constitute a pool of metastatic initiating cells that switch cell identity while disseminating to secondary organs. Our data provide a spatially and temporally resolved map of the diversity and trajectories of melanoma cell states and suggest that the ability to support growth and metastasis are limited to distinct pools of cells. The observation that these phenotypic competencies can be dynamically acquired after exposure to specific niche signals warrant the development of therapeutic strategies that interfere with the cancer cell reprogramming activity of such microenvironmental cues.


Figures

Extended Data Fig. 1:
Extended Data Fig. 1:. Cellular composition and discriminative regulons of NRAS-driven mouse melanoma
a, UMAP illustrating cell type diversity in NRASQ61K/°;Ink4a−/− lesions (43k cells). b, Activity (AUCell score) of a melanoma specific gene set in NRASQ61K/°;Ink4a−/− lesions. c, Violin plot depicting mean Copy Number Variation (CNV) scores for the different cell types, including the malignant compartment, identified in NRASQ61K/°;Ink4a−/− lesions. d, Relative proportions of the melanoma transcriptional cell states highlighting a strong representation across all 5 NRASQ61K/°;Ink4a−/− tumors, illustrated as stacked bar (left panel) and as UMAP (right panel). e, Proliferative (PRO or melanocytic) and invasive (INV or mesenchymal-like) gene sets activity (AUCell score) in all mouse malignant cells (umap plots, left panel) or per transcriptional state (violin plots, right panel). f, Heatmap depicts changes in regulon activities for seurat clusters described in NRASQ61K/°;Ink4a−/− lesions g, Heatmap depicting average expression of selected Neural Crest Stem Cell (NCSC) and pre-migratory (pre-EMT) Neural Crest markers.
Extended Data Fig. 2:
Extended Data Fig. 2:. Single-cell transcriptomic landscape in BRAF-mutant mouse and human melanoma lesions.
a, UMAP visualisation of >2.600 malignant cells analysed by scRNA-seq and integrated across 2 different BRAFV600E;Ptenl/l lesions. The Seurat clusters were annotated using signature-based annotation (left panel). Mitf expression and Proliferative (PRO or Melanocytic) and invasive (INV or mesenchymal-like) gene sets activity (AUCell score) across all malignant cells (right panels). b, Stacked bar chart illustrating the distribution of malignant cell states (binary cut-offs) extracted from NRASQ61K/°;Ink4a−/− and projected onto scRNAseq data of drug naive human melanoma lesions. Each graph is categorized based on the main genetic driver mutations identified. WT indicates lesions that do not carry BRAF neither NRAS mutations; N/A indicates lesions for which genetic information is lacking. c, Stacked bar chart illustrating the distribution of malignant cell states (binary cut-offs) extracted from NRASQ61K/°;Ink4a−/− lesions and projected onto a publicly available scRNA-seq dataset (malignant treatment-naïve cells) of human melanoma biopsies. The patient IDs and main genetic driver mutations are indicated. WT indicates lesions that do not carry BRAF neither NRAS mutations; N/A indicates lesions for which genetic information is lacking; met. stands for metastatic and prim. for primary lesions.
Extended Data Fig. 3:
Extended Data Fig. 3:. Characterization of the Confetti melanoma mouse model.
a, H&E staining of melanoma model Tyr::NRASQ61K/°;Ink4a−/−;Tyr::CreERT2/°;Rosa26-LSL-Confetti+/+. Representative image from n=3 independent tumors. b, Confocal images of labeled melanoma subclones acquired by confocal imaging upon TAM administration and immunostained for melanocytic lineage markers MITF, gp100 and MLANA (magenta) exhibiting heterogeneous expression. Images from n=4 independent tumors. c, Representative confocal images showing Confetti labelling efficiency in melanoma tumours 3 days after the administration of different doses of TAM in order to achieve the optimal dose to perform clonal analyses. Images from n=4 independent experiments. d, Representative confocal images showing Confetti labelling of melanoma cells 5 days after TAM administration (0.5 mg). Images from n=6 independent tumors. e, Violin plot depicting the proportion of labelled melanoma cells expressing each Confetti fluorophore 5 days after TAM administration (0.5 mg). Six melanoma tumours (two sectional areas of each) were analysed. Black line represents median and grey lines the 25th to 75th percentile. f, Representative confocal image at low magnification illustrating the clone size heterogeneity in tumours that have expanded 10-fold from the initial size after TAM administration (0.5 mg). Arrowheads show several single and/or oligoclones that exhibit minor expansion over time. Images from n=8 independent tumors.
Extended Data Fig. 4:
Extended Data Fig. 4:. Clone size distributions are consistent with the hierarchical model.
a, Cluster-cluster distance correlation indicating a high likelihood that clusters of a given colour are found near clusters of the same colour for distances below 100 μm. This threshold, indicated by a dashed line, was then used in the association of clones. Solid line and shaded area correspond to mean and ±SEM for n=5 biological repeats. b-e, Cumulative distribution (CDF) of clone sizes for YFP+ and RPF+ cells in samples 2-5 (for number of clones per sample see Supplementary Table 5) Sample 1 is presented in Fig. 2f. The dashed black lines correspond to the bi-exponential fits of the data, as predicted by the hierarchical model, for each dataset we show the R-squared (R2) and standard error of the fit (S) of the theoretical CDFs to the data. f, Sensitivity of the stem cell expansion rate, cycling rate and stem cell fraction to different choices of the stem cell symmetric division probability, r. The vertical dotted line indicates the value r=0.75 used here to estimating the model parameters (see Supplementary Table 5). g-k, Comparison of the empirical CDFs of clone sizes for each of the n=5 biological repeats and the corresponding distributions and SD obtained from performing 10.000 stochastic simulations of the two-compartment stem-progenitor cell model using the parameters in Supplementary Table 5. The p-values from two-sample Kolmogorov-Smirnov tests comparing the empirical and numerical distribution of clone sizes are shown. In f and i, the RFP channel of sample 3 is not shown as it was considered to be below the threshold of clonality. For Extended Data Fig.5 see Supplementary Note in Supplementary Information).
Extended Data Fig. 5:
Extended Data Fig. 5:. Hierarchical melanoma growth is independent of the adaptive immune system.
a, Schematic representation of the generated melanoma mouse model transplanted in immunocompromised mice (Foxn1nu). Schematic made with Biorender.com. b, Tumour growth kinetics (mm3) of individual tumours in immunodeficient mice (yellow), and corrected mean obtained from fitting an exponential growth to each individual sample (black curve). Dashed lines indicate tumour duplication times. Dotted red curve refers to the mean growth kinetics extracted from Fig. 2b. c, Confocal images showing Confetti labelling efficiency in melanoma tumours 3 days after the administration of different doses of TAM in order to achieve the optimal dose to perform clonal analyses. Representative images from n=3 independent tumors. d, Confocal image showing Confetti labelling of melanoma cells 5 days after TAM administration (0.5 mg) in immunodeficient background. Representative image from n=5 independent tumors. e, Violin plot depicting the proportion of labelled melanoma cells expressing each Confetti fluorophore 5 days after TAM administration (0.5 mg). Six melanoma tumours (two sectional area of each) were analysed. Black line represents median and grey lines the 25th to 75th percentile. f, Confocal images of melanoma tumours in immunodeficient background exhibiting Confetti labelling 5 days after initial induction (1.5-fold tumour increase) and at relative growth of 10-fold upon single low dose intraperitoneal Tamoxifen administration (0.5 mg). Representative images from n=3 independent tumors.
Extended Data Fig. 6:
Extended Data Fig. 6:. Spatially mapping melanoma heterogeneity.
a, Spatially resolved quantification of stress (hypoxia) state (prediction score) by label transfer of scRNA-seq data onto Visium spots (sample 1,2,3). b, Scatter plot shows a positive correlation (Spearman) between the stress (hypoxia) activity score and the distance to the nearest BV (Fisher exact test, two-tailed p value). c, Spatially resolved quantification of pre-EMT NC stem-like state (prediction score) by label transfer of scRNA-seq data onto Visium spots (sample 2,3). d, Violin plots and box plots showed the number of Stereo-seq detected genes (left) and Molecular Identifier (MID) (right) per bin50 (25 μm diameter). The middle horizontal line of the boxplot represents the median. e, Gene count visualization of Stereo-seq data. f, ROI colored by percentage of mitochondrial gene count (bin50). g, Scatter plot shows correlation (Spearman) of stress (hypoxia) activity (AUCell score) and distance to closest blood vessel per bin based on Stereo-seq bin50 data (Fisher exact test, two-tailed p value). h, UMAP of all segmented cells (170k) from molecular cartography (see Fig. 3f), coloured by Seurat cluster and melanoma (melanocytic state) gene signature activity (AUCell score). i, UMAP of malignant subset (109k) from molecular cartography, coloured by Seurat cluster and melanoma (melanocytic state) gene signature activity (AUCell score). j, Expression of pre-EMT NC stem-like cell markers assessed by scRNA-seq. k, Expression of pre-EMT NC stem-like cell markers assessed by Molecular Cartography. l, Expression of stress (hypoxia) cell markers as assessed by scRNA-seq (upper panels) and Molecular Cartography (lower panels). m, Horizontal histogram showing median distance (black line) to the nearest blood Vessel (BV) for all cells annotated as stress-hypoxia or expressing Sox10 and one of the indicated pre-EMT NC stem-like markers. Exact p values are indicated. n, Representative confocal image showing mRNA expression of the indicated genes, as detected by RNAscope, in blood vessel (BV) free and containing areas. Yellow arrowheads indicate the presence of cells positive for both Sox10 (red) and Notch3 (green). Endothelial Cells (Dll4+) are highlighted in orange. RBCs, Red Blood Cells. o, Quantification of m (n=6; p<0.0001). Boxes extend from the 25th to 75th percentile. The middle line represents the median. Whiskers represent min to max values. In panels m and o significance was assessed by an unpaired nonparametric, two-tailed Mann-Whitney Test (approximate p value, p<0.0001).
Extended Data Fig. 7:
Extended Data Fig. 7:. Mapping the melanoma perivascular niche in human primary melanomas.
a, Confocal image of immunostaining of human primary melanoma lesions for CD31, SOX10, VCAN (upper panel, 3 representative lesions from 5 tumors) or CD31, SOX10, NES (lower panel, 3 representative lesions from 7 tumors). The main driver mutations are indicated. b, Spatial distribution of Confetti clones in respect to vessels. Panel of xy images of a clone (indicated with the red arrowhead) in close proximity to the vessel at indicated z-stack positions (z1-z24). V corresponds to the vessel. c, Violin plot depicting 2D quantification of subclones categorized in two groups based on their size and their spatial distance (μm) from the BV (visualized by AQP1 staining, n=6; p<0.0001). Dashed line represents median and grey lines the 25th to 75th percentile. Significance was by an unpaired nonparametric, two-tailed Mann-Whitney Test. d. Cumulative distribution of clone sizes for clones directly in contact with the vasculature (distance < 20 m, solid lines) and clones detached from it (distance ≥ 20 m, dashed lines) for RFP (black circles) and YFP (gray squares) channels, obtained from short-term clonal labelling of (upper) 4 days and (lower) 10 days post TAM, where the vasculature was segmented after staining with CD31 staining in n=2 biological repeats for each time-point (shown separately).
Extended Data Fig. 8:
Extended Data Fig. 8:. Melanoma-Endothelial cell heterotypic interaction promotes growth and induction of the pre-EMT NC stem-like phenotype.
a, Schematic representation of Fig. 3i. b, Kaplan-Meier survival curves from log-rank (Mantel-Cox) test of mice described in a (p=0.00288, n is indicated in the graph). c, Schematic representation of in vitro assays using the Watermelon system. d, Representative FACS profiles from Fig. 3j and experiment described in c. Percentages of low mcherry (mNeon-positive) populations. e, NRASQ61K/°;Ink4a−/− cells cultured either alone or in the presence of Bend3 cells for 48h and processed for scRNA-seq. Left, UMAP by sample identity; middle, expression of the endothelial cell marker Pecam1; and right, panmelanoma marker Sox10. f, Heatmap showing the overall transcriptional reprogramming effect observed following exposure of NRASQ61K/°;Ink4a−/− melanoma cells to Bend3 endothelial cells. g, Percentage of melanoma cells positive for the melanocytic and Neural Crest-like signatures (binary AUCell score). h, Melanospheres of NRASQ61K/°;Ink4a−/− cells grown in the presence of GFP-labeled Bend3 ECs for 10 days and the percentage of Nestin-positive cells was correlated with the amount of Bend3/GFP-positive cells. Linear regression test was used for statistical significance (n=19). i, Predicted cell-to-cell interactions based on known ligand-receptor pairs between TME populations (ligands) and the pre-EMT NC stem-like malignant cells (receptors) in scRNA seq data from mouse tumors as inferred by NicheNet. j, Dotplot showing gene expression intensities of selected receptors over the different Seurat clusters. k, Circos plot illustrating Dll4-Notch3 predicted interaction between cell types in scRNA seq data from mouse tumors and inferred by CellChat. The edge width is proportional to the prediction score. Note the predicted interaction of pre-EMT NC stem-like state with ECs. l, UMAP highlighting the specific expression of the ligand Dll4 in ECs and the receptor Notch3 in subpopulation of malignant cells. m, Left panel shows venn diagram highlighting the overlap of the pre-EMT NC stem-like cell state (cluster 4) upregulated genes with NOTCH signalling signature (Reactome). Right panel shows venn diagram highlighting the significant overlap of the pre-EMT NC stem-like cell state (cluster 4) upregulated genes with a Notch3 activation signature. Hypergeometric distribution test was used for statistical analysis. P values are indicated in each Venn diagram. n, Rbpj expression in the malignant cluster of scRNA data from NRASQ61K/°;Ink4a−/− lesions projected either as UMAP (left panel) or as violin plot (right panel) for each malignant transcriptional state. Schematic in a and c made with Biorender.com.
Extended Data Fig. 9:
Extended Data Fig. 9:. PRRX1 is a master regulator of the mesenchymal-like transcriptional program.
a, Violin plots depict conserved Prrx1 regulon activity scores (AUCell) across mouse Seurat clusters. b, Violin plots depict conserved PRRX1 regulon activity scores (AUCell) across human Seurat clusters. c, PRRX1 expression in n=375 TCGA_SKCM patients stratified as invasive (n=123), immune-related (n=116) and proliferative (n=136) phenotypes based on their gene expression profile described previously. Box plots summarize the values per phenotypic group and show the median. Boxes extend from the 25th to 75th percentiles, whiskers and outliers were plotted according to the Tukey method. Significance was assessed by an unpaired nonparametric, two-tailed Mann-Whitney Test (approximate p value, p<0.0001). d, Heatmap generated using the TCGA database illustrating the gene expression profile of patients with PRRX1 high and low expression (20th percentile cut-off). Genes from the conserved PRRX1 regulon are co-expressed together with PRRX1. e, Left panel, PRRX1 expression (226695_at) in invasive (n=71) and proliferative (n=81) melanoma cell lines as previously described. Error bars represent ±SEM. Significance was assessed by an unpaired nonparametric, two-tailed Mann-Whitney Test (approximate P value, p<0.0001). Right panel, qPCR analysis for PRRX1 in short term melanoma cells lines categorized as proliferative (n=11) and invasive (n=7) based on their gene expression profile). Error bars represent ±SEM. Significance was assessed by unpaired nonparametric two-tailed Student’s t-test. (p = 0.1509). f, PRRX1 expression (upper panel) and signature activity (lower panel) in short term proliferative/melanocytic melanoma cell lines (MM057, MM074 and MM087) transfected with SOX10 siRNA or non-targeting control. Baseline refers to the non-transfected melanoma cell lines. g, Left panel, matrigel-invasion assay upon silencing of PRRX1 in MM099 cells. Right panel, quantification (n=3; p=0.0011). h, Relative mRNA expression of PRRX1 upon siPRRX1 (n=3; p=0.0003). In g and h significance was assessed by unpaired two-tailed Student’s t-test.
Extended Data Fig. 10:
Extended Data Fig. 10:. Reprogramming of Prrx1+ melanoma cells during metastatic spreading.
a, Expression of melanocytic lineage markers in malignant FACS-sorted tdTomato+ cells isolated from a primary melanoma lesion of Met-track mice, 2 days (early labelled) post-TAM. b, Expression of Prrx1 and well-established melanoma mesenchymal-like markers in cells described in a. c, Expression of pre-EMT NC stem-like cell markers and activity (AUCell score) of the pre-EMT NC stem-like cell signature in cells described in a. d, Confocal image of a lymph node metastasis 4 weeks post-TAM. Cells positive for both GFP and tdTomato reporters (subcapsular region) as well as tdTomato+ cells expressing lower to undetectable levels of GFP. Black regions correspond to the pigmented melanoma cells. BF, Bright Field. Representative images from 5 different tumors. e, Box plots showing the percentage of tdTomato+/GFPhigh versus and tdTomato+/GFPlow cells in lymph nodes (n=4 mice). Boxes extend from the 25th to 75th percentile. The middle line represents the median. Whiskers represent min to max values. f, Confocal image of single tdTomato+ (and GFPlow) cells in the liver of a Met-Track mouse 4 weeks post-TAM. Representative image from 2 different tumors. g, Violin plots of Mitf expression and pigmentation genes in FACS-sorted tdTomato+ fraction isolated from lung metastases 2 days (early labelled) and 30-days (late labelled) post-TAM administration.
Fig. 1:
Fig. 1:. Single-cell transcriptomic landscape of NRAS-driven melanoma.
a, Uniform Manifold Approximation and Projection (UMAP) of malignant cells analysed by scRNA-seq and integrated across five different NRASQ61K/°;Ink4a−/− primary lesions. b, Mitf regulon activity in mouse malignant cells projected as UMAP (upper panel) and violin plot (lower panel), respectively. The middle line represents the median. c. Functional enrichment terms of the characteristic Seurat clusters identified in a (Fisher exact test, two-tailed p value). d. Heatmap illustrating discriminative marker genes (n=9) for each functionally enriched state. e. AUCell score of top functionally enriched marker genes per state projected on malignant UMAP (see Supplementary Table 1). f, Mapping of gene expression program activities during murine neural crest development onto transcriptional states of NRASQ61K/°Ink4a−/− melanoma. g, Activity (binary AUCell score) of selected mouse malignant gene signatures from NRASQ61K/°;Ink4a−/− melanoma projected onto scRNAseq datasets from BRAFV600E;Ptenl/l mouse melanoma lesions (left panel) and human clinical Metastatic Melanoma samples (right panel).
Figure 2:
Figure 2:. Multicolour lineage tracing reveals that melanoma growth is hierarchically organized.
a, Schematic representation of mouse model. b, Tumour growth kinetics (mm3) of individual tumours (yellow), and corrected mean obtained from extrapolating the missing time-points using the model prediction (black curve). c, Confocal images of melanomas exhibiting Confetti expression at different relative growths upon TAM administration (0.5 mg). Representative images from at least 8 mice per group. d, Representative reconstruction of 3D clones. Independent clones appear in different colours. A single z-slice of the corresponding dataset is shown at the bottom of the plot. e. Dot plot showing the distribution of clone sizes, by sample and by channel obtained from 5 cleared tumours (see Supplementary Table 5). f. Cumulative distribution, showing the probability of observing a clone larger than a given size. The corresponding bi-exponential fits (dashed line, R2=0.96, standard error of the fit S=0.03) and exponential decay of the tail (black line) are shown. g, Schematics of the minimal hierarchical model. The parameters ΔS and ΔP correspond to the expansion rates of the S and P populations, respectively. Although the data could accommodate a “line” of fit parameters, fixing the relative transition rate of stem cells into the progenitor cell compartment, r=0.75, the model shows an excellent fit to the data with ΔS~0.09 and ΔP~0.04 and a stem fraction fS~0.21 or 21% (see Supplementary Note). h, Upper panel, experimental procedure for dual pulse labelling assay using EdU and BrdU. Lower panel, image of a double BrdU (green) and EdU (red) immunostaining. Representative image from n=5 tumors. i, Pie-chart illustrating the percentage of single and double labelled cells. Quantification was assessed from 5 different mice and 4 technical replicates per mouse. Schematic in a, g and h made with Biorender.com.
Figure 3:
Figure 3:. A perivascular niche promotes melanoma growth.
a, Quantification of pre-EMT NC stem-like activity onto spatial transcriptomics. Dark blue, BVs annotation. b, Inverse correlation (Spearman) between the pre-EMT NC stem-like cell prediction score and distance to nearest BV. c, Spatial scatter plot shows bins of EC, pre-EMT NC stem-like and hypoxia (binary AUCell score). d, Anti-correlation (Spearman) of pre-EMT NC stem-like activity (AUCell score) and distance to closest BV. e, Molecular cartography for the indicated genes. Left, pseudocolored cells based on the type/state identity (n=33 ROIS). Insets, areas enriched either for pre-EMT NC stem-like (Area 1) or stress-hypoxia cells (Area 2). f, Median distance to nearest BV (n=33 ROIs; p<0.0001). g, Immunostaining for indicated proteins. Upper, a capillary; lower, a dilated tumour BV (n=3 tumors). h, Confocal image of Confetti+ tumours (n=6), immunostained for AQP1. i, DsRed-labeled melanoma cells injected into immunocompromised mice alone or with GFP-labeled Bend3 ECs (ratio 1/2; p= 0.0281 and ratio 1/4; p=0.0051). Tumour volume (mean±SEM) in function of time/days (n=3). j, Percentage of mCherry high versus low watermelon+ cells cultured alone or with Bend3 (n=6, p=0.0011). k, Left, melanospheres (DsRed-labeled) grown alone or with (GFP-labeled) Bend3 ECs. Right, melanosphere volume (n=6 monoculture, n=8 co-culture; p<0.0001). l, Melanoma cells cultured alone (Control) or with Bend3 cells and percentage of malignant cells harbouring the pre-EMT NC stem-like state (binary AUCell score) determined by scRNA-seq. m, Representative images of melanospheres (n=2) grown alone or with GFP-labeled Bend3. The presence of NES+ cells was evaluated. n, Doxycycline induced watermelon+ cells transfected with siControl or siNotch3 supplemented with Bend3 cells. b and d, Fisher exact test, two-tailed p value. f, i and n, two-tailed Mann-Whitney Test. In j and k, boxes extend from the 25th to 75th percentile, middle line represents the median. Whiskers represent min to max values (unpaired two-tailed Student’s t test with Welch’s correction).
Figure 4:
Figure 4:. Temporal single-cell tracing identifies a population of melanoma cells that fuels metastasis but not primary tumour growth
a, Conserved (mouse and human) PRRX1 regulon (see Methods). b, Left panel, heatmap of differentially expressed genes upon silencing of PRRX1 in MM047 cells (bulk RNAseq, n=2 biological replicates). Right panel, GSEA shows downregulation of mesenchymal-like signature upon siPRRX1 (MM-lines and Jechlinger_EMT_UP gene sets). c, Schematic representation of the Met-Track mouse model and possible lineage tracing outcomes following Tamoxifen (TAM) exposure. Schematic made with Biorender.com. d, Confocal images of a primary tumour 4 weeks post-TAM. Insets showing the majority of GFP/tdTomato-double positive cells in the deepest dermal part of the lesion. BF, Bright Field (n=4 independent mice). e UMAP shows hallmarks of EMT and PRRX1 regulon activity (AUCell score) in tdTomato+ cells 2 days (early labelled) post-TAM. f, Ratio malignant versus non-malignant (as determined by scRNA-seq) of FACS-sorted tdTomato+ fraction from primary tumours 2 days (early labelled) and 30-days (late labelled) post-TAM. g, Expression of PRRX1 regulon and pigmentation signatures (determined by scRNA-seq) of FACS-sorted tdTomato+ fraction 2 days (early labelled) and 30-days (late labelled) upon last TAM administration. h, Confocal images of a lung micro-metastasis 4 weeks post-TAM, immunostained for MITF (white). Red signal is from tdTomato expression; GFP (green) signal. BF, Bright Field (n=3 independent mice). i, Expression of PRRX1 regulon and pigmentation gene signatures (as determined by scRNA-seq) of FACS-sorted tdTomato+ fraction from lung metastatic lesions 2 days (early labelled) and 30-days (late labelled) post-TAM.

Comment in

  • The hierarchy of melanoma.
    Senft D. Senft D. Nat Rev Cancer. 2022 Dec;22(12):658. doi: 10.1038/s41568-022-00532-8. Nat Rev Cancer. 2022. PMID: 36319698 No abstract available.

References

    1. Rambow F, Marine JC & Goding CR Melanoma plasticity and phenotypic diversity: Therapeutic barriers and opportunities. Genes and Development Preprint at 10.1101/gad.329771.119 (2019). - DOI - PMC - PubMed
    1. Arozarena I & Wellbrock C Phenotype plasticity as enabler of melanoma progression and therapy resistance. Nature Reviews Cancer Preprint at 10.1038/s41568-019-0154-4 (2019). - DOI - PubMed
    1. Gulati GS et al. Single-cell transcriptional diversity is a hallmark of developmental potential. Science (1979) (2020) doi:10.1126/science.aax0249. - DOI - PMC - PubMed
    1. Rambow F et al. Toward Minimal Residual Disease-Directed Therapy in Melanoma. Cell vol. 174 843–855.e19 (2018). - PubMed
    1. Tirosh I et al. Dissecting the multicellular ecosystem of metastatic melanoma by single-cell RNA-seq. Science 352, 189–96 (2016). - PMC - PubMed

Additional references

    1. Bosenberg M et al. Characterization of melanocyte-specific inducible Cre recombinase transgenic mice. Genesis 44, 262–267 (2006). - PubMed
    1. Krimpenfort P, Quon KC, Mooi WJ, Loonstra A & Berns A Loss of p16Ink4a confers susceptibility to metastatic melanoma in mice. Nature (2001) doi:10.1038/35092584. - DOI - PubMed
    1. Dankort D et al. BRAF V600E cooperates with PTEN silencing to elicit metastatic melanoma. Nat Genet 41, 544–552 (2009). - PMC - PubMed
    1. Maria Bosisio F et al. Functional heterogeneity of lymphocytic patterns in primary melanoma dissected through single-cell multiplexing. Elife (2020) doi:10.7554/eLife.53008. - DOI - PMC - PubMed
    1. Susaki EA et al. Whole-brain imaging with single-cell resolution using chemical cocktails and computational analysis. Cell (2014) doi:10.1016/j.cell.2014.03.042. - DOI - PubMed

Publication types