. 2022 Sep 21;12(1):15767.
doi: 10.1038/s41598-022-20147-1.

Internal state affects local neuron function in an early sensory processing center to shape olfactory behavior in Drosophila larvae

Affiliations

Internal state affects local neuron function in an early sensory processing center to shape olfactory behavior in Drosophila larvae

Seth R Odell et al. Sci Rep. .

Abstract

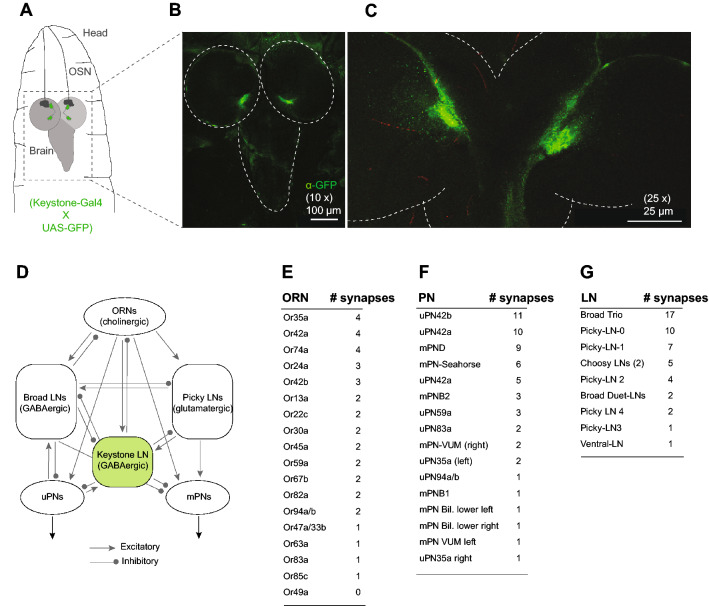
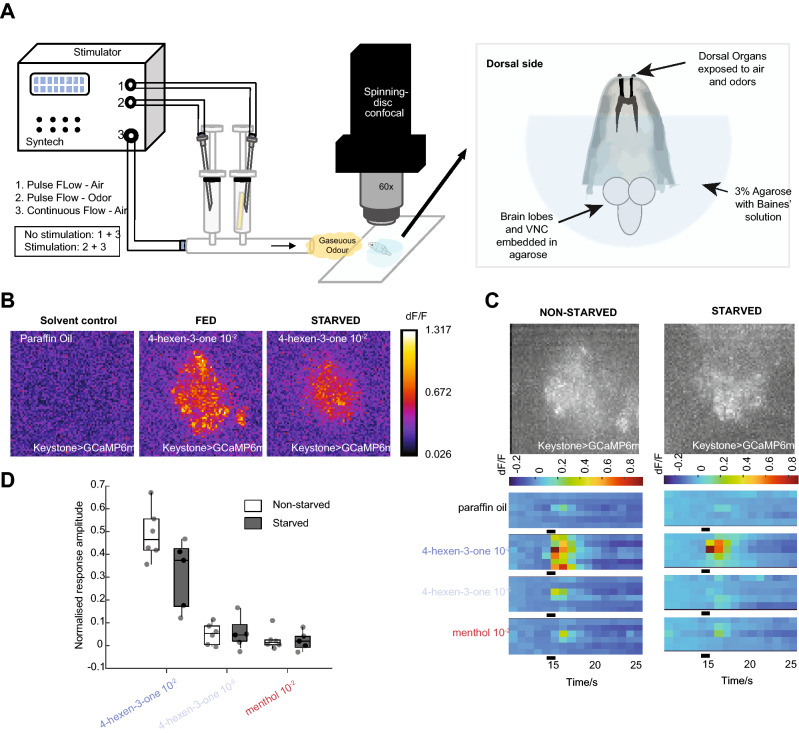
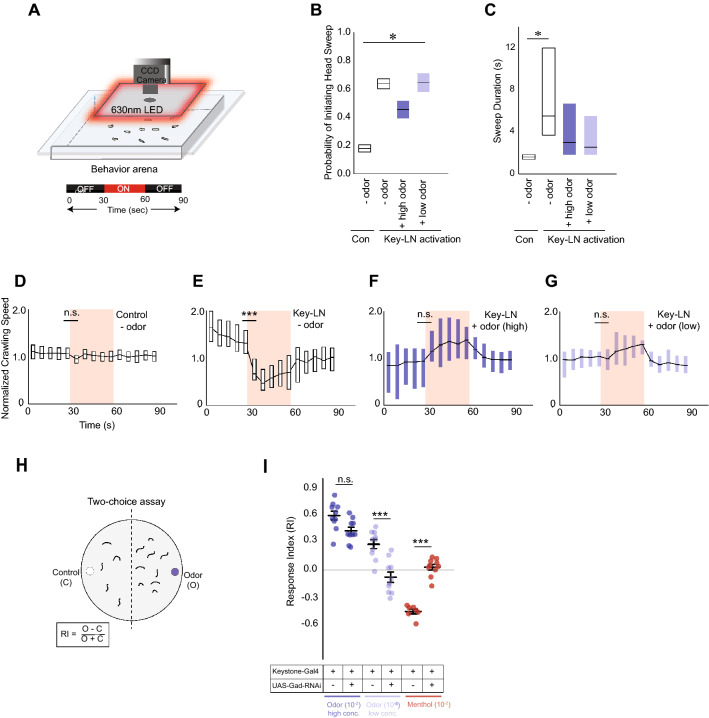
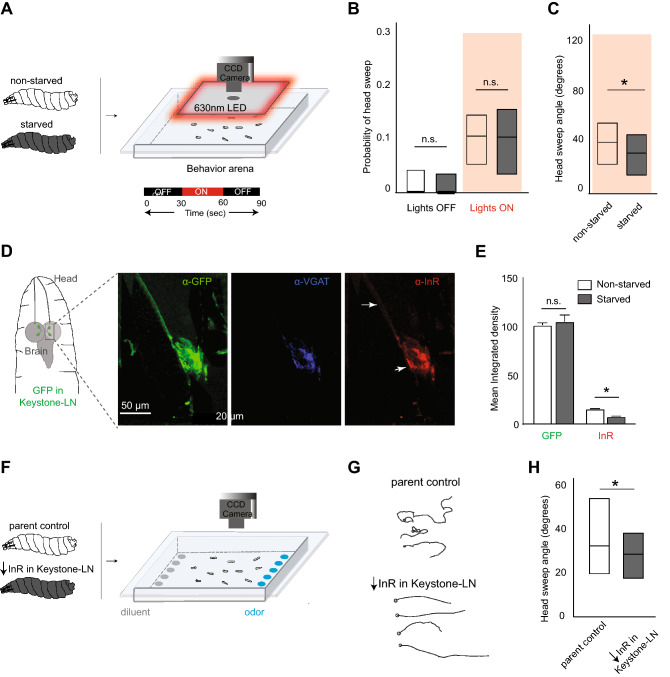
Crawling insects, when starved, tend to have fewer head wavings and travel in straighter tracks in search of food. We used the Drosophila melanogaster larva to investigate whether this flexibility in the insect's navigation strategy arises during early olfactory processing and, if so, how. We demonstrate a critical role for Keystone-LN, an inhibitory local neuron in the antennal lobe, in implementing head-sweep behavior. Keystone-LN responds to odor stimuli, and its inhibitory output is required for a larva to successfully navigate attractive and aversive odor gradients. We show that insulin signaling in Keystone-LN likely mediates the starvation-dependent changes in head-sweep magnitude, shaping the larva's odor-guided movement. Our findings demonstrate how flexibility in an insect's navigation strategy can arise from context-dependent modulation of inhibitory neurons in an early sensory processing center. They raise new questions about modulating a circuit's inhibitory output to implement changes in a goal-directed movement.


Conflict of interest statement

The authors declare no competing interests.

Figures

Figure 1
Figure 1
Keystone-LN activity triggers head-sweep behavior in the Drosophila larva. (A) Tracking assay. Starved and non-starved individuals of wild-type third-instar Drosophila larvae are imaged in the tracking assay. (B) The average number of head sweeps for each larval track is plotted on the -axis. Mann–Whitney U, *p < 0.05, n = 37 for non-starved condition, n = 47 for starved condition. (C) Optogenetics assay. Larval neurons expressing CsChrimson are activated by shining red-light on the behavior arena. Larval movements are recorded. The experimental paradigm is shown below the arena. Red-light stimulus is turned ON for 5 s at 30 s, 90 s, and 150 s. (D) The probability of head sweeps is plotted on y-axes for control larvae expressing no CsChrimson in any neurons (black) and for larvae expressing CsChrimson in Keystone-LN (red), GH146 subset of LNs (blue), GH298 subset of LNs (green), and all Orco-positive OSNs (orange). (E) Histograms of the calculated Z-statistics between a random 15 s and the remaining 165 s, repeated 1,000,000 times. Red and black lines represent the true Z-statistic between light ON and light OFF. Next to each red and black line is the fraction of replicates with a value greater than the true value.
Figure 2
Figure 2
Keystone-LN is centrally positioned in the Drosophila larval antennal lobe. (A) Cartoon showing the anterior end of a third-instar Drosophila larva. Confocal images of the larval brain were taken with a 10 × objective (scale bar is 100 µm) (B) and a 25 × objective (scale bar is 25 µm) (C). Anti-eGFP antibody stains a single pair of neurons in the two anterior brain lobes (B,C) and none in the ventral nerve cord (B). (D) Peripheral olfactory circuit of the Drosophila larva. Excitatory and inhibitory connections between Keystone-LN, OSNs, Broad and Picky LNs, uPNs, and mPNs are shown. Adapted from. (EG) The number of synapses between Keystone-LN and different classes of neurons is tabulated for (E) OSNs, (F) PNs, and (G) LNs.
Figure 3
Figure 3
Odor responses of Keystone-LN in fed and starved larvae. (A). Schematic of in-vivo calcium imaging set-up. The odor stimulator consists of 3 air outlets, one for the carrier gas flow and two for the pulse flow. Under no stimulus conditions, airflow from outlets 1 and 3 are constant. When a stimulus is triggered, the airflow from outlet 1 is switched to outlet 2, which puffs air through an odor-containing syringe for 1 s, while carrier flow remains constant. Odor responses are recorded from the neurites of Keystones in the AL (Keystone-gal4; UAS-GCaMP6m) using a spinning disk confocal microscope. (B) Representative odor-evoked calcium responses in the neurites of Keystone-LNs to the indicated odors diluted in paraffin oil. (C) The top panels show maximum projection images of baseline GCaMP fluorescence in Keystone-LN neurites in the antennal lobe. The bottom heatmaps represent the responses of Keystone-LN neurites to the indicated odors under fed and starved conditions. Each row corresponds to responses from an individual larva. The black bar indicates when the 1-s odor stimulus was applied. (D) Box plots showing solvent corrected response amplitudes with min–max normalization (see “Methods”) comparing responses to different odors in fed and starved states. Mann–Whitney U-test was used to test differences between fed and starved conditions. No statistically significant differences were found for any of the odors tested.
Figure 4
Figure 4
Keystone-LN-induced behavior in the presence of odor. (A) Transgenic larvae expressing CsChrimson in Keystone-LN are subjected to the optogenetics assay in the absence or presence of an odor (4-hexen-3-one). (B) The probability of head sweeps is plotted on the y-axis for control larvae expressing no CsChrimson in any neurons and for larvae expressing CsChrimson in Keystone-LN both in the absence or presence of a high (10–2 vol:vol, dark blue) and a low (10–6 vol:vol, light blue) concentrations of 4-hexen-3-one. Distributions are generated by bootstrap analysis. *p = 2e−16, n = 20,000 for each group. (C) The duration of each head sweep is plotted on the y-axis. *p = 0.0001, No odor, − activation, n = 8, No odor, + activation n = 51, High odor, + activation n = 16, Low odor, + activation n = 20. (DG) The normalized crawling speed of the larvae over the course of the experiment (90 s) is plotted on the y-axis. Control larvae in the absence of odor (D) and larvae expressing CsChrimson in Keystone-LN in the absence of odor (E), in the presence of high odor concentration (F), and in the presence of low odor concentration (G) are shown. ***p < 0.001, n = 32. (H) 2-choice behavior assay. Attraction to test odor is measured as a response index (RI) based on the number of larvae in each half of the plate. (I) RI values (mean, SEM) of control and test larvae expressing Gad-RNAi in Keystone-LN are plotted on the y-axis. Responses to a high concentration (10–2 vol:vol, dark blue dots) and a low concentration (10–6 vol:vol, light blue dots) of an attractive odor (4-Hexen-3-one) and to a high concentration (10–2 vol:vol, red dots) of an aversive odor (menthol) are shown. Factorial ANOVA, Tukey posthoc test, ***p < 0.001, n = 10 (parent control); n = 10 (test line).
Figure 5
Figure 5
Satiety state and insulin signaling affect head-sweep behavior. (A) Starved and non-starved transgenic larvae expressing CsChrimson in Keystone-LN are subjected to the optogenetics assay. Larval movements are recorded. (B) The probability of head sweeps for non-starved (white) and starved larvae (grey) under lights OFF (left) and lights ON (right) are plotted on the y-axis. Robust non-parametric ANOVA (R-fit package), n = 76 for Lights OFF, n = 15 for Lights ON. (C) Magnitudes of head sweep for fed (green) and starved larvae (blue) are plotted on the y-axis. Robust non-parametric ANOVA (R-fit package), *p = 0.0172, n = 72 for fed samples, n = 49 for starved samples. (D) Figure depicting the front end of a third-instar Drosophila larva. Keystone-LN is highlighted in green. The rectangular inset marks the region of interest during confocal imaging. α-GFP antibody pinpoints Keystone-LN. α-VGAT antibody labels vesicular GABA transporter. α-InR antibody labels insulin receptors. (E) GFP and InR protein levels were quantified in Keystone-LNs (mean ± SEM). Student’s t test (two-tailed), p < 0.05. (F) Transgenic larvae expressing UAS-InR-RNAi in Keystone-LN and parent controls are subjected to an odor gradient (4-Hexen-3-one, 10–2 vol:vol). Larval movements are recorded. (G) Example tracks of control larvae and larvae expressing low InR in Keystone-LNs. (H) Magnitudes of head sweep (median, IQR) for control larvae (white, n = 176) and larvae expressing low InR in Keystone-LNs (grey, n = 92) are plotted on the y-axis. Robust non-parametric ANOVA (R-fit package), *p = 0.007.

References

    1. Gershow M, et al. Controlling airborne cues to study small animal navigation. Nat. Methods. 2012;9:290–296. doi: 10.1038/nmeth.1853. - DOI - PMC - PubMed
    1. Torres JB, Evangelista WS, Jr, Barras R, Guedes RNC. Dispersal of Podisus nigrispinus (Het., Pentatomidae) nymphs preying on tomato leafminer: Effect of predator release time, density and satiation level. J. Appl. Entomol. 2002;126:326–332. doi: 10.1046/j.1439-0418.2002.00653.x. - DOI
    1. Grettenberger IM, Joseph SV. Influence of starvation on walking behavior of Bagrada hilaris (Hemiptera: Pentatomidae) PLoS One. 2019;14:e0215446. doi: 10.1371/journal.pone.0215446. - DOI - PMC - PubMed
    1. Bell WJ. Searching behavior patterns in insects. Annu. Rev. Entomol. 1990;35:447–467. doi: 10.1146/annurev.en.35.010190.002311. - DOI
    1. Jones RE. Search behaviour: A study of three caterpillar species. Behaviour. 1977;60:237–259. doi: 10.1163/156853977X00225. - DOI

Publication types

LinkOut - more resources