. 2022 Sep 21;12(1):15733.
doi: 10.1038/s41598-022-20183-x.

ZIKV-envelope proteins induce specific humoral and cellular immunity in distinct mice strains

Affiliations

ZIKV-envelope proteins induce specific humoral and cellular immunity in distinct mice strains

Victória Alves Santos Lunardelli et al. Sci Rep. .

Abstract

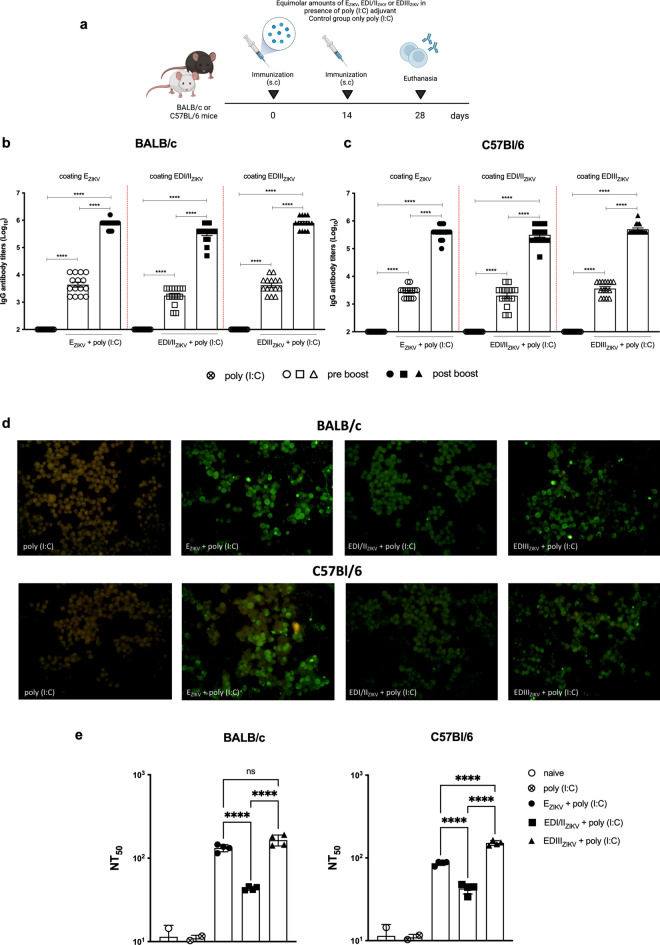
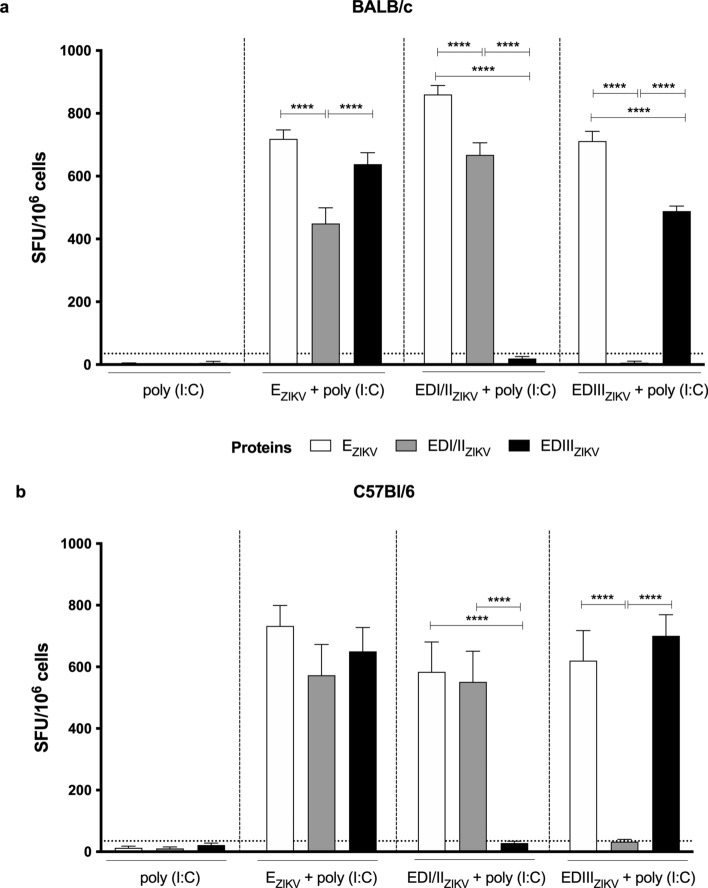
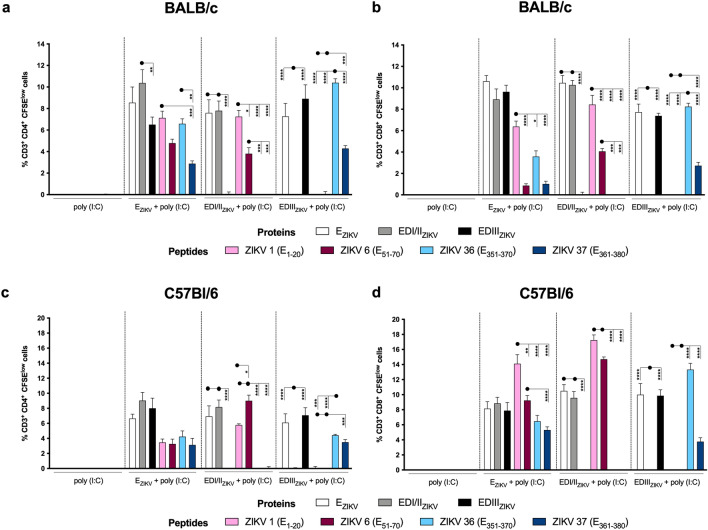
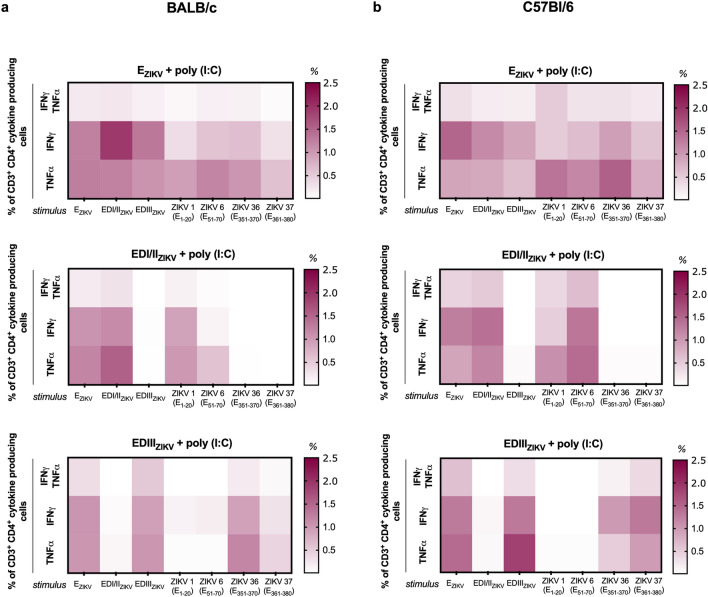
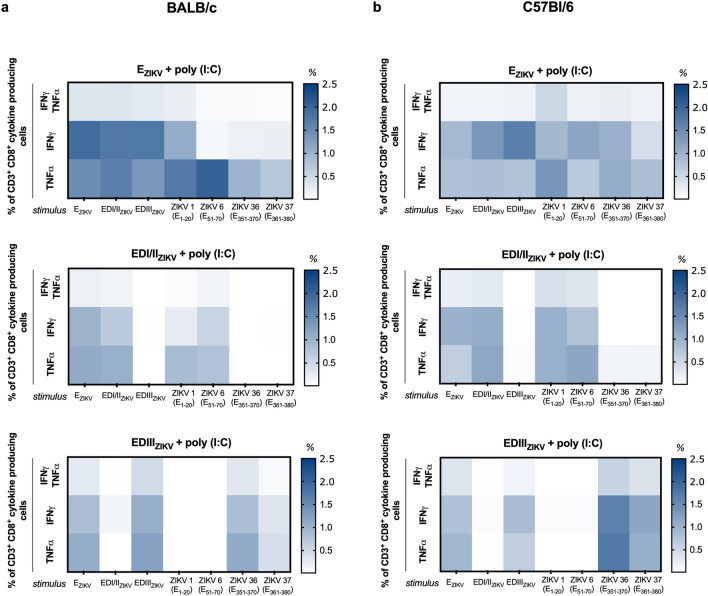
Recent outbreaks of Zika virus (ZIKV) infection have highlighted the need for a better understanding of ZIKV-specific immune responses. The ZIKV envelope glycoprotein (EZIKV) is the most abundant protein on the virus surface and it is the main target of the protective immune response. EZIKV protein contains the central domain (EDI), a dimerization domain containing the fusion peptide (EDII), and a domain that binds to the cell surface receptor (EDIII). In this study, we performed a systematic comparison of the specific immune response induced by different EZIKV recombinant proteins (EZIKV, EDI/IIZIKV or EDIIIZIKV) in two mice strains. Immunization induced high titers of E-specific antibodies which recognized ZIKV-infected cells and neutralized the virus. Furthermore, immunization with EZIKV, EDI/IIZIKV and EDIIIZIKV proteins induced specific IFNγ-producing cells and polyfunctional CD4+ and CD8+ T cells. Finally, we identified 4 peptides present in the envelope protein (E1-20, E51-70, E351-370 and E361-380), capable of inducing a cellular immune response to the H-2Kd and H-2Kb haplotypes. In summary, our work provides a detailed assessment of the immune responses induced after immunization with different regions of the ZIKV envelope protein.


Figures

Figure 1
Figure 1
Specific humoral immune response elicited after immunization with EZIKV, EDI/IIZIKV or EDIIIZIKV recombinant protein in two different mouse strains. (a) Immunization Strategy (created with BioRender.com). BALB/c or C57Bl/6 mice (n = 3 control groups and n = 4 experimental groups) were immunized subcutaneously twice with equimolar amounts of the EZIKV, EDI/IIZIKV or EDIIIZIKV combined with 50 μg poly(I:C). Control groups received only poly(I:C). Mice were bled 14 days after each dose to evaluate humoral response. (b, c) Total specific-IgG antibody titers on a logarithm scale (Log10) in the sera of (b) BALB/c or (c) C57Bl/6 mice. Empty symbols represent pre boost serum and filled symbols represent post boost serum. Post boost sera was inactivated in order to assess their ability to (d) recognize ZIKV-infected Vero cells (MOI = 0.1) or (e) neutralize ZIKV. (d) For IFA assay, mouse serum and goat anti-mouse IgG conjugated with fluorescein isothiocyanate was used as primary and secondary antibodies respectively. (e) For PRNT, sera were incubated with 100 PFU of ZIKV and the neutralization capacity were represented by 50% of viral neutralization (NT50). Data represent mean ± SEM of 4 independent experiments. Statistical significance was measured by One-way ANOVA followed by Tukey’s post hoc test, *p < 0.05, **p < 0.01, ***p < 0.001, ****p < 0.0001.
Figure 2
Figure 2
Specific IFNγ-producing cells after immunization with ZIKV-envelope proteins. Analysis of the specific cellular immune response after immunization of (a) BALB/c or (b) C57Bl/6 mice as described in Fig. 1a. Fifteen days after the boost, the splenocytes were cultured in the presence of equimolar amount of recombinant envelope proteins for 18 h to evaluate the number of IFN-γ producing cells by ELISpot assay. SFU: spot forming units. Statistical significance was measured by Two-way ANOVA followed by Tukey’s post hoc test, *p < 0.05, **p < 0.01, ***p < 0.001, ****p < 0.0001. Data represent mean ± SEM of 4 independent experiments.
Figure 3
Figure 3
Mapping of T cell epitopes after immunization with recombinant ZIKV envelope proteins. Analysis of the specific cellular immune response after immunization of (a, c) BALB/c or (b, d) C57Bl/6 mice as described in Fig. 1a. Fifteen after the second dose, the spleen of each animal was removed and the splenocytes were cultured in the presence of 10 mg/mL of the (a, b) pool of ZIKV peptides or (c, d) individual peptides to evaluate the number of IFNγ-producing cells by ELISpot assay. SFU: spot forming units. Statistical significance was measured by Two-way ANOVA followed by Tukey’s post hoc test, *p < 0.05, **p < 0.01, ***p < 0.001, ****p < 0.0001. Data represent mean ± SEM of 3 independent experiments.
Figure 4
Figure 4
Immunization with recombinant ZIKV envelope proteins induces proliferation of specific CD4+ and CD8+ T cells. Analysis of CD4+ and CD8 + T cell proliferation after immunization of (a, b) BALB/c or (b, d) C57Bl/6 mice as described in Fig. 1a. Fifteen days after the second dose, the spleen of each animal was removed and the splenocytes were labeled with CFSE (1.25 μM) and cultured in the presence of equimolar amounts of recombinant proteins or 5 μg/mL of the individual peptides for 5 days. After labeling with fluorochrome-conjugated anti-CD3, -CD4 and -CD8, cells were analyzed by flow cytometry (representative gating strategies shown in Supplementary Fig. 3b). Initially, a gate was performed on CD3+ cells (T lymphocytes), followed by gates on CD4+ and CD8+ populations. Within the two T cells subpopulations (a, c) CD3+CD4+ and (b, d) CD3+CD8+, the decrease in CFSE fluorescence intensity was evaluated. The frequency of cell proliferation was calculated by subtracting the values from the culture of unstimulated cells. Statistical significance was measured by Two-way ANOVA followed by Tukey’s post hoc test, *p < 0.05, **p < 0.01, ***p < 0.001, ****p < 0.0001. Data represent mean ± SEM of 2 independent experiments.
Figure 5
Figure 5
Immunization with recombinant ZIKV envelope proteins induces polyfunctional CD4+ T cells. Analysis of polyfunctional cells after immunization of (a) BALB/c or (b) C57Bl/6 mice as described in Fig. 1a. Fifteen days after the second dose, the spleen of each animal was removed and cultured in the presence of equimolar amounts of recombinant proteins or 5 μg/mL of the individual peptides. For the detection of cytokine-producing T cells, the cells were restimulated on the 4th day for 12 h in the presence of recombinant proteins, anti-CD28 and brefeldin A. Cells were stained with anti-CD3 and -CD4, then permeabilized and labeled for intracellular cytokines. After selecting the T cell populations that produce cytokines (representative gating strategies are shown in Supplementary Fig. 3b), a Boolean combination was created using the FlowJo software to determine the frequency of each response based on all possible combinations of CD4+ T cell cytokine producers. Heatmap was used to determine the frequency of CD4+ T cells that produce IFNγ and TNFα when stimulated with the different proteins (columns). The frequency of CD4 + T cells that produce cytokines was calculated by subtracting the values from the unstimulated cell culture.
Figure 6
Figure 6
Immunization with recombinant ZIKV envelope proteins induces polyfunctional CD8+ T cells. Analysis of polyfunctional cells after immunization of (a) BALB/c or (b) C57Bl/6 mice as described in Fig. 1a. Fifteen days after the second dose, the spleen of each animal was removed and cultured in the presence of equimolar amounts of recombinant proteins or 5 μg/mL of the individual peptides. For the detection of cytokine-producing T cells, the cells were restimulated on the 4th day for 12 h in the presence of recombinant proteins, anti-CD28 and brefeldin A. Cells were stained with anti-CD3 and -CD8, then permeabilized and labeled for intracellular cytokines. After determining the populations of T cells that produce cytokines (representative gating strategies are shown in Supplementary Fig. 3b, a Boolean combination was created using the FlowJo software to determine the frequency of each response based on all possible combinations of CD8+ T cells cytokine producers. Heatmap was used to determine the frequency of CD8+ T cells that produce IFNγ and TNFα when stimulated with the different proteins (columns). The frequency of cells that produce cytokines was calculated by subtracting the values from the unstimulated cell culture.

References

    1. Gatherer D, Kohl A. Zika virus: A previously slow pandemic spreads rapidly through the Americas. J. Gen. Virol. 2016;97:269–273. doi: 10.1099/jgv.0.000381. - DOI - PubMed
    1. Dick GW, Kitchen SF, Haddow AJ. Zika virus. I. Isolations and serological specificity. Trans. R. Soc. Trop. Med. Hyg. 1952;46:509–520. doi: 10.1016/0035-9203(52)90042-4. - DOI - PubMed
    1. WHO. ZIKA virus, microcephaly, Guillain–Barré syndrome. in (ed. Report, S.) (World Health Organization, 2017).
    1. Brooks JT, et al. Update: Interim guidance for prevention of sexual transmission of ZIKA Virus—United States, July 2016. MMWR Morb. Mortal Wkly. Rep. 2016;65:745–747. doi: 10.15585/mmwr.mm6529e2. - DOI - PubMed
    1. Collins MH, Waggoner JJ. Detecting vertical ZIKA transmission: emerging diagnostic approaches for an emerged flavivirus. ACS Infect. Dis. 2019;5:1055–1069. doi: 10.1021/acsinfecdis.9b00003. - DOI - PubMed

Publication types