

Ancestry-related distribution of Runs of homozygosity and functional variants in Qatari population
- PMID: 36131251
- PMCID: PMC9490902
- DOI: 10.1186/s12863-022-01087-1
Ancestry-related distribution of Runs of homozygosity and functional variants in Qatari population
Abstract
Background: Describing how genetic history shapes the pattern of medically relevant variants could improve the understanding of how specific loci interact with each other and affect diseases and traits prevalence. The Qatari population is characterized by a complex history of admixture and substructure, and the study of its population genomic features would provide valuable insights into the genetic landscape of functional variants. Here, we analyzed the genomic variation of 186 newly-genotyped healthy individuals from the Qatari peninsula.
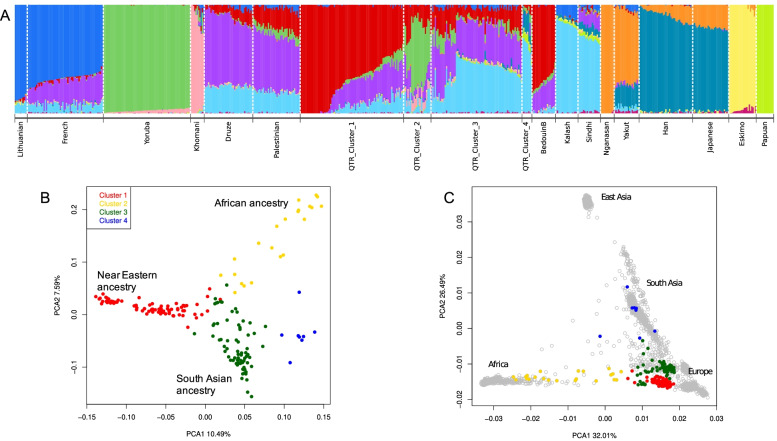
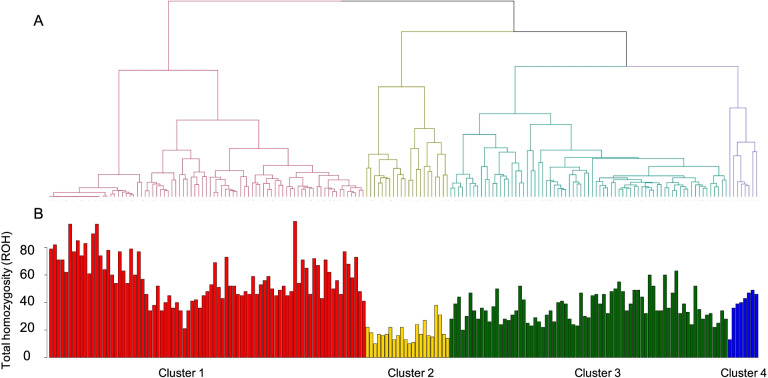
Results: We discovered an intricate genetic structure using ancestry related analyses. In particular, the presence of three different clusters, Cluster 1, Cluster 2 and Cluster 3 (with Near Eastern, South Asian and African ancestry, respectively), was detected with an additional fourth one (Cluster 4) with East Asian ancestry. These subpopulations show differences in the distribution of runs of homozygosity (ROH) and admixture events in the past, ranging from 40 to 5 generations ago. This complex genetic history led to a peculiar pattern of functional markers under positive selection, differentiated in shared signals and private signals. Interestingly we found several signatures of shared selection on SNPs in the FADS2 gene, hinting at a possible common evolutionary link to dietary intake. Among the private signals, we found enrichment for markers associated with HDL and LDL for Cluster 1(Near Eastern ancestry) and Cluster 3 (South Asian ancestry) and height and blood traits for Cluster 2 (African ancestry). The differences in genetic history among these populations also resulted in the different frequency distribution of putative loss of function variants. For example, homozygous carriers for rs2884737, a variant linked to an anticoagulant drug (warfarin) response, are mainly represented by individuals with predominant Bedouin ancestry (risk allele frequency G at 0.48).
Conclusions: We provided a detailed catalogue of the different ancestral pattern in the Qatari population highlighting differences and similarities in the distribution of selected variants and putative loss of functions. Finally, these results would provide useful guidance for assessing genetic risk factors linked to consanguinity and genetic ancestry.
Keywords: Admixture; Loss of function; Positive selection; Qatar population; Runs of homozygosity; Warfarin response.
© 2022. The Author(s).
Conflict of interest statement
On behalf of all authors, the corresponding author states that they have no competing interests.
Figures

References
Publication types
MeSH terms
Substances
LinkOut - more resources
Full Text Sources
Medical
Miscellaneous