. 2022 Sep 21;10(1):140.
doi: 10.1186/s40478-022-01414-8.

Unraveling axonal mechanisms of traumatic brain injury

Affiliations

Unraveling axonal mechanisms of traumatic brain injury

Victorio M Pozo Devoto et al. Acta Neuropathol Commun. .

Abstract

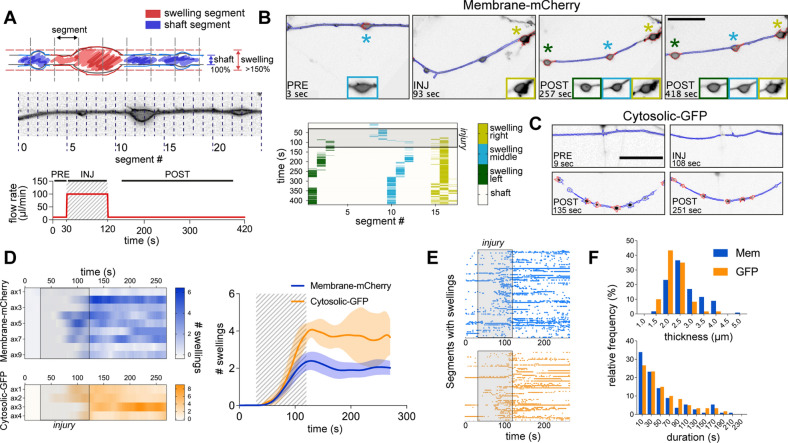
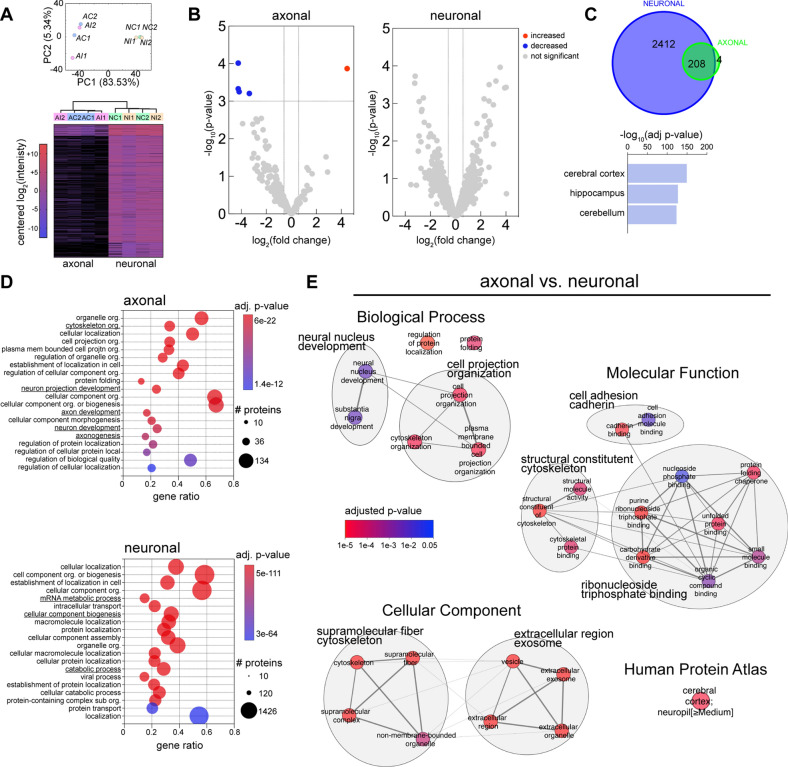
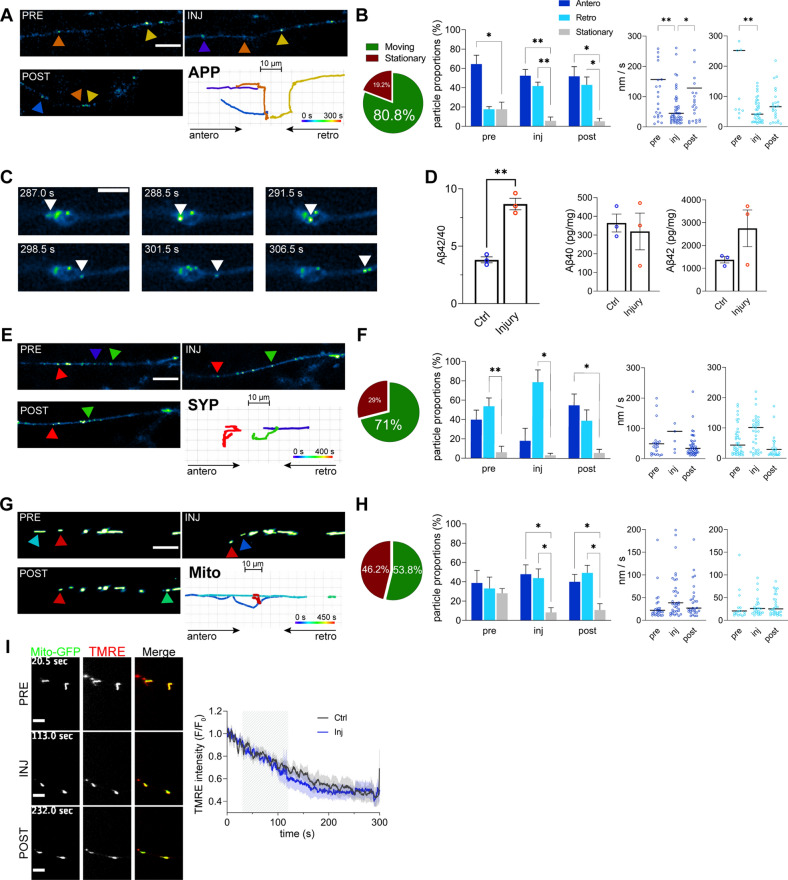
Axonal swellings (AS) are one of the neuropathological hallmark of axonal injury in several disorders from trauma to neurodegeneration. Current evidence proposes a role of perturbed Ca2+ homeostasis in AS formation, involving impaired axonal transport and focal distension of the axons. Mechanisms of AS formation, in particular moments following injury, however, remain unknown. Here we show that AS form independently from intra-axonal Ca2+ changes, which are required primarily for the persistence of AS in time. We further show that the majority of axonal proteins undergoing de/phosphorylation immediately following injury belong to the cytoskeleton. This correlates with an increase in the distance of the actin/spectrin periodic rings and with microtubule tracks remodeling within AS. Observed cytoskeletal rearrangements support axonal transport without major interruptions. Our results demonstrate that the earliest axonal response to injury consists in physiological adaptations of axonal structure to preserve function rather than in immediate pathological events signaling axonal destruction.

Keywords: Axonal swellings; Axonal transport; Calcium; Microtubules; Phosphoproteomics; Subcortical periodic cytoskeleton; Traumatic brain injury.


Conflict of interest statement

V.M.P.D., V.L. and G.B.S. declare that part of the present work was filed as international patent application: PCT/CZ2019/050063 Pozo Devoto V.M., Lacovich V. and Stokin G.B. (2019): System and method for axonal injury assays.

Figures

Fig. 1
Fig. 1
Set-up of a novel axonal injury system. A Schematic representation of the injury system. Image of microfluidic chamber compartments with WGA-stained neurons (scale bar: 500 µm). B Quantification of the speed of the media at different pump flow rates by tracking fluorescent beads in the flow channel (n = 3 independent chambers). C Calculation of the maximum stress applied in the flow channel by quantification of the urethane pillar bending (n = 3 independent chambers, scale bar: 20 µm, close-up: 3 µm). D and E Flow cytometry quantification (D) and immunofluorescence images (E) of the expression and localization of neuronal lineage markers through the differentiation stages from NSCs to mature neurons (FACS: n = 3, 250.000 cells/n; IF: n = 3, scale bar: 100 µm). F Electrophysiological activity during neuronal terminal differentiation (from DIV0 to DIV90, expressed in weeks) recorded on MEA plates. Right plots: representative raster plots of DIV40 and DIV76 recordings (n = 3, 4 wells/n). G Quantification of Ca2+ transients in cultures incubated with Fluo-4 AM through neuronal terminal differentiation (from DIV0 to DIV40) (n = 2, 5 recordings/n, scale bar: 50 µm). H Immunostaining against Tau, β3-Tub, Map2 and pNF (SMI31) of DIV40 neurons cultured in microfluidic chambers. Axonal and dendritic length measurements from the neuronal compartment to the axonal compartment (n = 3, 5–10 projections/n, scale bar: 200 µm). I Effects of different pump flow rates on AS generation and axotomy. Axons of mem-mCherry transduced neurons (DIV40) imaged before and after different pump flow rates for 90 s (n = 5, scale bar: 10 µm). TEM of axons in the flow channel (scale bar: 2 µm). Data are mean ± SEM (*p < 0.05, **p < 0.01, ***p < 0.001). Statistical comparisons were performed using one-way ANOVA followed by Dunnett’s multiple comparison test against NSCs group (D) or DIV10 group (G), or the Tukey’s multiple comparison test (H and I). See also Additional file 1: Fig. S1
Fig. 2
Fig. 2
Wax and wane behavior of the axonal swellings. A Schematic representation of the analytical method and the injury protocol for the AS detection. The axon is divided into segments of equal sizes. For a swelling to be detected, the width of the axon in that segment has to be greater than 1.5 × of the median axonal shaft width in that frame. B AS tracking method of axons subjected to injury. Cultures were transduced with mem-mCherry to evidence the axolemma. Matrix shows tracking of the swellings in time. Shaded area corresponds to the injury stage (from 30 to 120 s, scale bar: 20 µm). C Same method as in B applied to the axons transduced with cytosolic-GFP (scale bar: 20 µm). D Quantification of the number of swellings in time for each individual axon. mem-mCherry (upper) and cytosolic-GFP (lower) stained axons. Right plot: mean number of swellings per axon (n = 9 for mCherry, n = 4 for GFP). E Rasterplot showing the behavior in time of each individual AS for mem-mCherry and cytoslic-GFP. F Frequency distribution analysis of swelling thickness and duration. Data are mean ± SEM
Fig. 3
Fig. 3
Axonal Ca2+ increase is required to sustain swellings. A Axonal Ca2+, Na+ and K+ levels during injury measured with the ratiometric probes FURA-2AM, SBFI and PBFI (n = 4–6, scale bar: 10 µm). B AS and axonal Ca2+ levels during injury. Mem-mCherry transduced neurons were incubated with Ca2+ sensor Fluo-4 AM. Middle: mean axonal Ca2+ levels during injury. Right: Mean number of swellings and Ca2+ levels during injury (n = 7, scale bar: 20 µm). C AS and Ca2+ tracking across the axonal shaft through the injury. Example of a matrix showing detection of swellings (> 150% width) and high Ca2+ (> 1.25x) for each segment of the axonal shaft in time. D Percentage of AS per axon that during their duration present always Ca2+, part time Ca2+ or no Ca2+ (left, n = 6, 10–150 swellings/n). Bubble plot shows the relationship between the duration of the AS and the presence of high Ca2+ (middle, n = 342 swellings). Pie chart showing the percentage of AS that are preceded (2 s window) by high Ca2+ (right, n = 342 swellings). E Schematic representation of the compounds used to block different sources of Ca2+. Axons were incubated with compounds, subjected to injury and AS formation and Ca2+ levels assessed (n = 4–7). F Comparison of the effects of different compounds on the mean number of AS and Ca2+ intensity levels during and after injury (n = 4–7). G Diagram showing the targets of each compound and the mean differences in AS numbers or Ca2+ intensity levels compared to the control levels. Data are mean ± SEM (*p < 0.05, **p < 0.01). Statistical comparisons were performed using student t-test (A), one-way ANOVA followed by the Tukey’s multiple comparison test (D) or Dunnett’s multiple comparison test against the control group (F). See also Additional file 7: Fig. S2
Fig. 4
Fig. 4
Axonal proteomic profiling before and immediately after injury. A Axonal and neuronal compartment fractions (A/N) in both control and injury treatments (C/I) were processed for LFQ mass spectrometry. PCA and heatmap of differentially expressed proteins (n = 2). B Volcano plots depicting the quantitative protein changes following injury compared with control treatment for the axonal and the neuronal fractions. C Total number of proteins present in the neuronal and axonal fractions (upper panel). Human Protein Atlas top terms of the enrichment analysis for the neuronal fraction proteins (lower panel). D Top GO Biological Processes terms for the enrichment of the axonal (upper panel) or the neuronal fraction (lower panel). E Enrichment analysis of the axonal fraction proteins using as background the neuronal fraction proteins. Significant terms for each GO category were clustered by similarity and most representative words of the cluster’s terms assigned. See also Additional file 9: Fig. S3
Fig. 5
Fig. 5
Phosphorylation changes of the axonal proteins following injury. A Axonal and neuronal compartment fractions (A/N) in both control and injury treatments (C/I) were enriched for phosphorylation and processed for quantitative mass spectrometry. Heatmaps of phospho-peptides levels comparing injury versus control treatment for both axonal and neuronal fractions (n = 4). B Volcano plots of phosphopeptides levels comparing injury versus control treatment for both the axonal and neuronal fractions. C Pie charts depict the number of identified proteins that significantly increase or decrease their phosphorylation and the number of proteins that are not modified after injury. D Enrichment analysis (GO Biological Processes) of the proteins that are significantly regulated by phosphorylation after injury, using as background all the detected phosphoproteins. Comparison of significant terms between the axonal and neuronal fractions. E Stringplot showing all the phosphoproteins in the axonal fraction significantly changed after injury. F Overrepresentation analysis of the proteins in (E) showing top significant terms for GO molecular functions. G Kinome tree highlighting predicted kinases in both fractions, based on the significantly changed phosphopeptides as substrates (left). List of kinases and their families with the predicted activity based on their substrate’s fold change. H Stringplots of phosphoproteins present in specific cytoskeletal terms found in (F) and their kinases predicted activity
Fig. 6
Fig. 6
Structural reorganization of the axonal cytoskeleton following injury. A Representative scanning electron microscopy images of AS in control and axons subjected to injury (scale bar chamber: 200 µm, close-up: 20 µm, right horizontal: 5 µm, swellings: 2 µm). B Frequency distribution of the number of AS measured per axon (n = 5). C Frequency distribution of inter-swelling distances for control and injured axons. The distribution was fitted with three Gaussian curves with means of 3.09 µm, 6.12 µm and 13.87 µm (variances: 0.75, 3.02, 8,76 µm, respectively, control n = 57, injury n = 181). D SIM images of axons transduced with mem-mCherry and immunostained for βII-Spectrin or actin (scale bar: 2 µm). E Identification of AS and shaft ROIs, masking for surface (mem-mCherry), identification of actin or βII-Spectrin particles and measurements of the distances between the closest neighbours. Distances in shaft vs distances in swellings for actin and βII-Spectrin (n > 14). F SIM images of axons transduced with mem-mCherry and immunostained for βIII-tubulin or pNF. Images were processed and magnitude of directionality measured and plotted in polar plots (scale bar upper: 5 µm, middle: 2 µm). G Representative image of the axons immunostained for CAMSAP2 and acetylated tubulin after injury (scale bar: 20 µm, close-up: 5 µm). H Frequency distribution of the periodicity of CAMSAP2 staining along the axons after injury (n = 96). I Representative image (z-projection) of an axon transduced with mem-mCherry and immunostained for CAMSAP2 and acetylated tubulin (scale bar: 10 µm, close-up: 5 µm). Data show mean ± SEM (**p < 0.01, ***p < 0.001). Statistical comparisons were performed using the student t-test (E). See also Additional file 13: Fig. S4
Fig. 7
Fig. 7
Adaptation of the axonal transport in response to the injury. A and B Tracking of APP-GFP particles in pre, during and post-injury stages (A, scale bar: 10 µm). Proportion of moving and stationary particles in the full tracking time (pre, injury and post injury stages) (B). Anterograde, retrograde and stationary movement particle proportions for each stage (n = 4). Anterograde and retrograde median velocities in the three different stages (n = 33–56). C Sequence of an APP-GFP particle moving anterogradely through an axonal swelling (scale bar: 5 µm). D ELISA Aβ40 and Aβ42 quantification in the axonal compartment comparing control and injured axons (n = 3). E and F Tracking of Synaptophysin-GFP particles in pre, during and post-injury stages (E, scale bar: 10 µm). Proportion of moving and stationary particles in the full tracking time (F). Anterograde, retrograde and stationary movement particle proportions for each stage (n = 4). Anterograde and retrograde median velocities in the three different stages (n = 13–40). G and H Tracking of Mito-GFP labeled mitochondria in pre, during and post-injury stages (G, scale bar: 10 µm). Proportion of moving and stationary particles in the full tracking time (H). Anterograde, retrograde and stationary movement particle proportions for each stage (n = 5). Anterograde and retrograde median velocities in the three different stages (n = 21–40). I Mitochondrial membrane potential levels during injury measured with TMRE probe (n = 7). Data are mean ± SEM (*p < 0.05, **p < 0.01). Statistical comparisons were performed using student t-test (D), two-way ANOVA followed by Dunnett’s multiple comparison test against stationary group (proportions: B, F and H) or Kruskal–Wallis test followed by Dunn’s multiple comparisons test against pre-injury (speed: B, F and H)

References

    1. Faul M, Coronado V. Epidemiology of traumatic brain injury. Handb Clin Neurol. 2015;127:3–13. doi: 10.1016/B978-0-444-52892-6.00001-5. - DOI - PubMed
    1. Rand CW, Courville CB. Histologic changes in the brain in cases of fatal injury to the head; alterations in nerve cells. Arch Neurol Psychiatry. 1946;55:79–110. doi: 10.1001/archneurpsyc.1946.02300130003001. - DOI - PubMed
    1. Ziogas NK, Koliatsos VE. Primary traumatic axonopathy in mice subjected to impact acceleration: a reappraisal of pathology and mechanisms with high-resolution anatomical methods. J Neurosci. 2018;38(16):4031–4047. doi: 10.1523/JNEUROSCI.2343-17.2018. - DOI - PMC - PubMed
    1. Reeves TM, Phillips LL, Povlishock JT. Myelinated and unmyelinated axons of the corpus callosum differ in vulnerability and functional recovery following traumatic brain injury. Exp Neurol. 2005;196(1):126–137. doi: 10.1016/j.expneurol.2005.07.014. - DOI - PubMed
    1. Geula C, Nagykery N, Nicholas A, Wu CK. Cholinergic neuronal and axonal abnormalities are present early in aging and in Alzheimer disease. J Neuropathol Exp Neurol. 2008;67(4):309–318. doi: 10.1097/NEN.0b013e31816a1df3. - DOI - PMC - PubMed

Publication types