Review
. 2021 Dec 13;4(2):353-376.
doi: 10.1039/d1na00559f. eCollection 2022 Jan 18.

Carbon dots: a novel platform for biomedical applications

Affiliations
Review

Carbon dots: a novel platform for biomedical applications

Mohammadreza Behi et al. Nanoscale Adv. .

Abstract

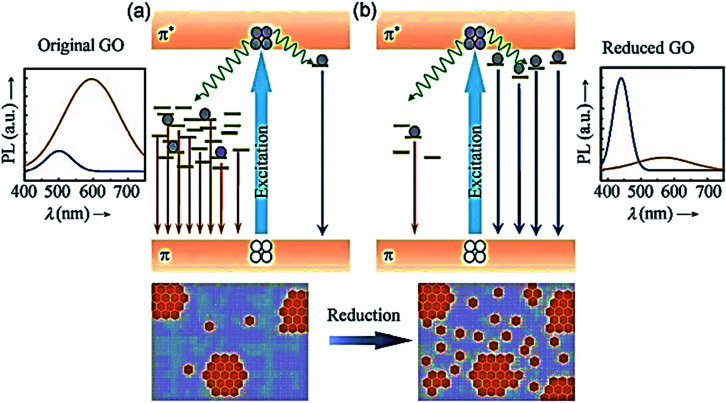
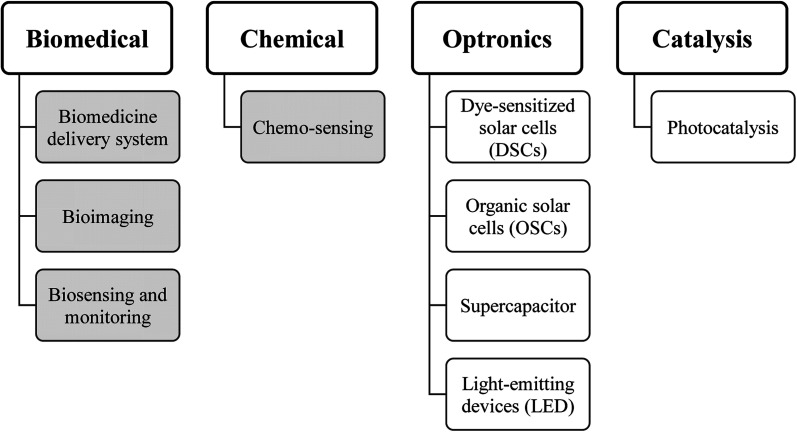
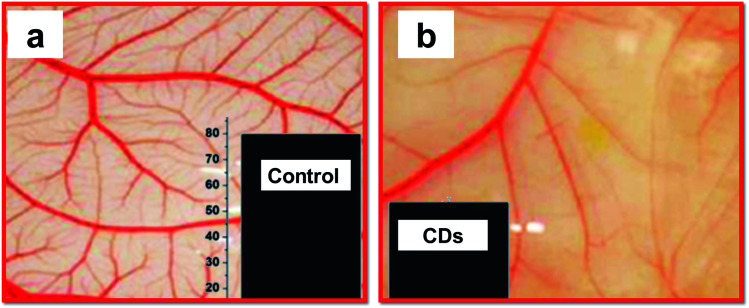
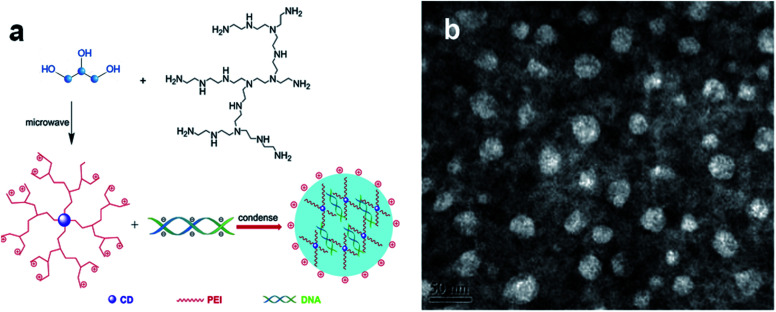
Carbon dots (CDs) are a recently synthesised class of carbon-based nanostructures known as zero-dimensional (0D) nanomaterials, which have drawn a great deal of attention owing to their distinctive features, which encompass optical properties (e.g., photoluminescence), ease of passivation, low cost, simple synthetic route, accessibility of precursors and other properties. These newly synthesised nano-sized materials can replace traditional semiconductor quantum dots, which exhibit significant toxicity drawbacks and higher cost. It is demonstrated that their involvement in diverse areas of chemical and bio-sensing, bio-imaging, drug delivery, photocatalysis, electrocatalysis and light-emitting devices consider them as flawless and potential candidates for biomedical application. In this review, we provide a classification of CDs within their extended families, an overview of the different methods of CDs preparation, especially from natural sources, i.e., environmentally friendly and their unique photoluminescence properties, thoroughly describing the peculiar aspects of their applications in the biomedical field, where we think they will thrive as the next generation of quantum emitters. We believe that this review covers a niche that was not reviewed by other similar publications.


Conflict of interest statement

The authors declare that there is no conflict of interest.

Figures

Fig. 1
Fig. 1. The addressable areas of research for CDs.
Fig. 2
Fig. 2. Illustration of three different types of carbon dots (CDs), from left to right: carbon nanodots (CNDs), graphene quantum dots (GQDs) and polymer dots (PDs).
Fig. 3
Fig. 3. Schematic illustration of the production routes of CDs: (a) “bottom-up” synthesis, where CDs are prepared from organic molecules or polymers through hydrothermal, calcination, microwave radiation, and not limited to these methods; (b) “top-down” synthesis, where CDs are prepared from larger sized carbon resources through acidic oxidation, hydrothermal cutting, and electrochemical methods.
Fig. 4
Fig. 4. Scheme of the various photoluminescence mechanisms and their unique characteristics: (a) SQDs with quantum confinement, where the size-dependent PL, excitation-independent PL has narrow PL band and long lifetimes; (b) CDs/GQDs with quantum confinement, where the size-dependent and excitation-independent PL has a broad PL band and medium lifetimes; (c) CNDs with no quantum confinement, where the size-independent and excitation-dependent PL has a broad PL band and short lifetimes. Adapted from ref. with permission from the Royal Society of Chemistry (Great Britain), copyright 2021.
Fig. 5
Fig. 5. Proposed PL emission mechanisms of (a) the predominant “red emission” in GO from disorder-induced localized states and (b) the predominant “blue emission” in reduced GO from confined cluster states. Adapted from ref. with permission from John Wiley and Sons, copyright 2021.
Fig. 6
Fig. 6. Classifications of potential applications of CDs.
Fig. 7
Fig. 7. Anti-angiogenic effect of CDs. (a) Vascular density observed in buffer (recorded for chick embryos in a chick chorioallantoic membrane (CAM) assay); (b) much lower vascular proliferation upon treatment with CDs. Insets show a graphical representation of the haemoglobin level in the control and sample treated with CDs, adopted and modified from ref. . These images were adapted with permission from ref. . American Chemical Society, Copyright 2015.
Fig. 8
Fig. 8. The scheme depicts the preparation of a gene delivery platform using CDs as vehicles. (a) The CDs are prepared through microwave-induced hydrothermal treatment of glycerol and polyethyleneimine. The CDs were incubated with DNA, forming the transfection agent following further condensation; (b) TEM images of negatively stained CDs/pDNA complexes. They were adopted and modified from. These images were adapted with permission from ref. . Elsevier, copyright 2021.
Fig. 9
Fig. 9. CDs synthesised from oligonucleotides precursor as a cellular delivery vehicle. (a) The scheme depicts the hydrothermal synthesis of CDs from purified DNA and employing the CDs for either bioimaging (making use of their fluorescence) or delivery into cells (upon attachment of molecular cargo onto the CDs); (b) DNA–CDs were readily internalized by bacteria and yeast. DNA–CDs entered (b1) E. coli or (b2) S. cerevisiae cells and emitted green signals upon UV irradiation (405 nm) as shown on CFM images. These images were adapted with permission from ref. . American Chemical Society, Copyright 2015.
Fig. 10
Fig. 10. Cell imaging using CDs. (a) Confocal fluorescence microscopy images of CHO cells incubated with amphiphilic CDs embedded within phospholipid small unilamellar vesicles, (a1) bright-field image, (a2) images recorded at an excitation of 405 nm and emission filter 525/30 nm, (a3) excitation of 488 nm and emission filter 525/30 nm, (a4) excitation at 561 nm and emission 641/40 nm. Scale bar is 10 μm; (b) CLSM images of live HL-7702 cells using 0.1 mg mL−1 CDs. (b1) Before and (b2 and b3) after treatment, (b2) with 10−6 M Cu2+ and (b3) 10−5 M Cu2+. Scale bar is 25 μm; (c) confocal fluorescence microscopy images (excitation at 405 nm) of MCF-7 cells incubated with CDs prepared from (c1) metaphenylenediamine, (c2) ortho phenylenediamine, and (c3) paraphenylenediamine. Each CDs label provides a distinct fluorescence emission peak (e.g., distinct colour). These images were adapted with permission from ref. , and . RSC, Elsevier and John Wiley and Sons. Copyright 2021.
None
Mohammadreza Behi
None
Leila Gholami
None
Sina Naficy
None
Stefano Palomba
None
Fariba Dehghani

References

    1. Ding C. Zhu A. Tian Y. Acc. Chem. Res. 2014;47:20–30. doi: 10.1021/ar400023s. - DOI - PubMed
    1. Zhu H. Zhang H. Xia Y. Anal. Chem. 2018;90:3942–3949. doi: 10.1021/acs.analchem.7b04893. - DOI - PubMed
    1. Kalisman P. Nakibli Y. Amirav L. Nano Lett. 2016;16:1776–1781. doi: 10.1021/acs.nanolett.5b04813. - DOI - PubMed
    1. Cheng Z. Li Q. Li Z. Zhou Q. Fang Y. Nano Lett. 2010;10:1864–1868. doi: 10.1021/nl100633g. - DOI - PubMed
    1. Julien P. A. Mottillo C. Friščić T. Green Chem. 2017;19:2729–2747. doi: 10.1039/C7GC01078H. - DOI