. 2021 May 28;3(14):4254-4270.
doi: 10.1039/d1na00087j. eCollection 2021 Jul 13.

Physico-chemical properties of selenium-tellurium alloys across the scales

Affiliations

Physico-chemical properties of selenium-tellurium alloys across the scales

Luke D Geoffrion et al. Nanoscale Adv. .

Abstract

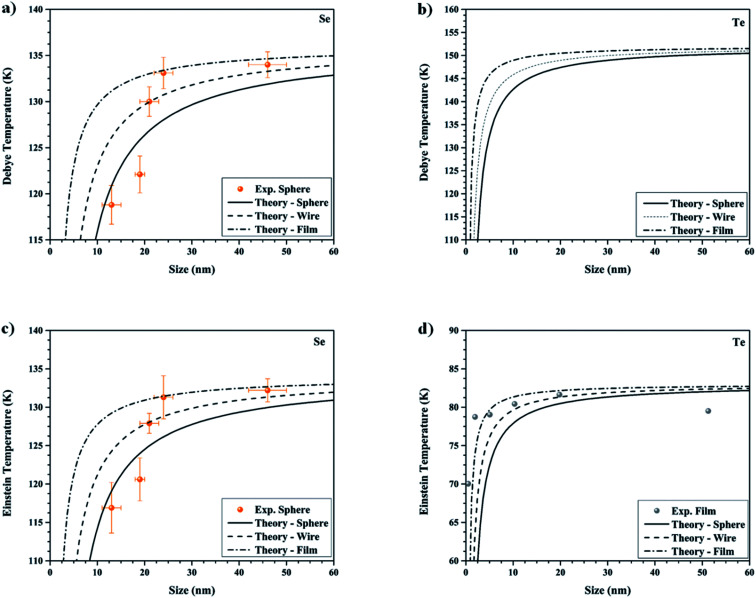
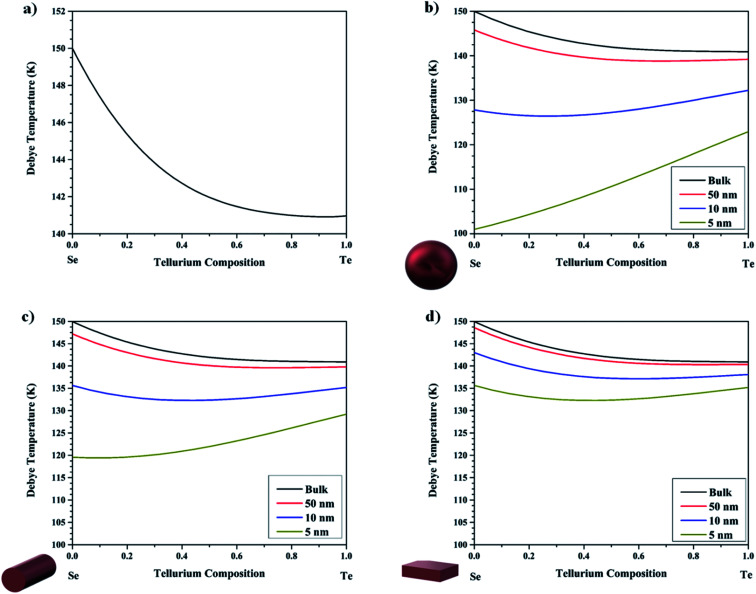
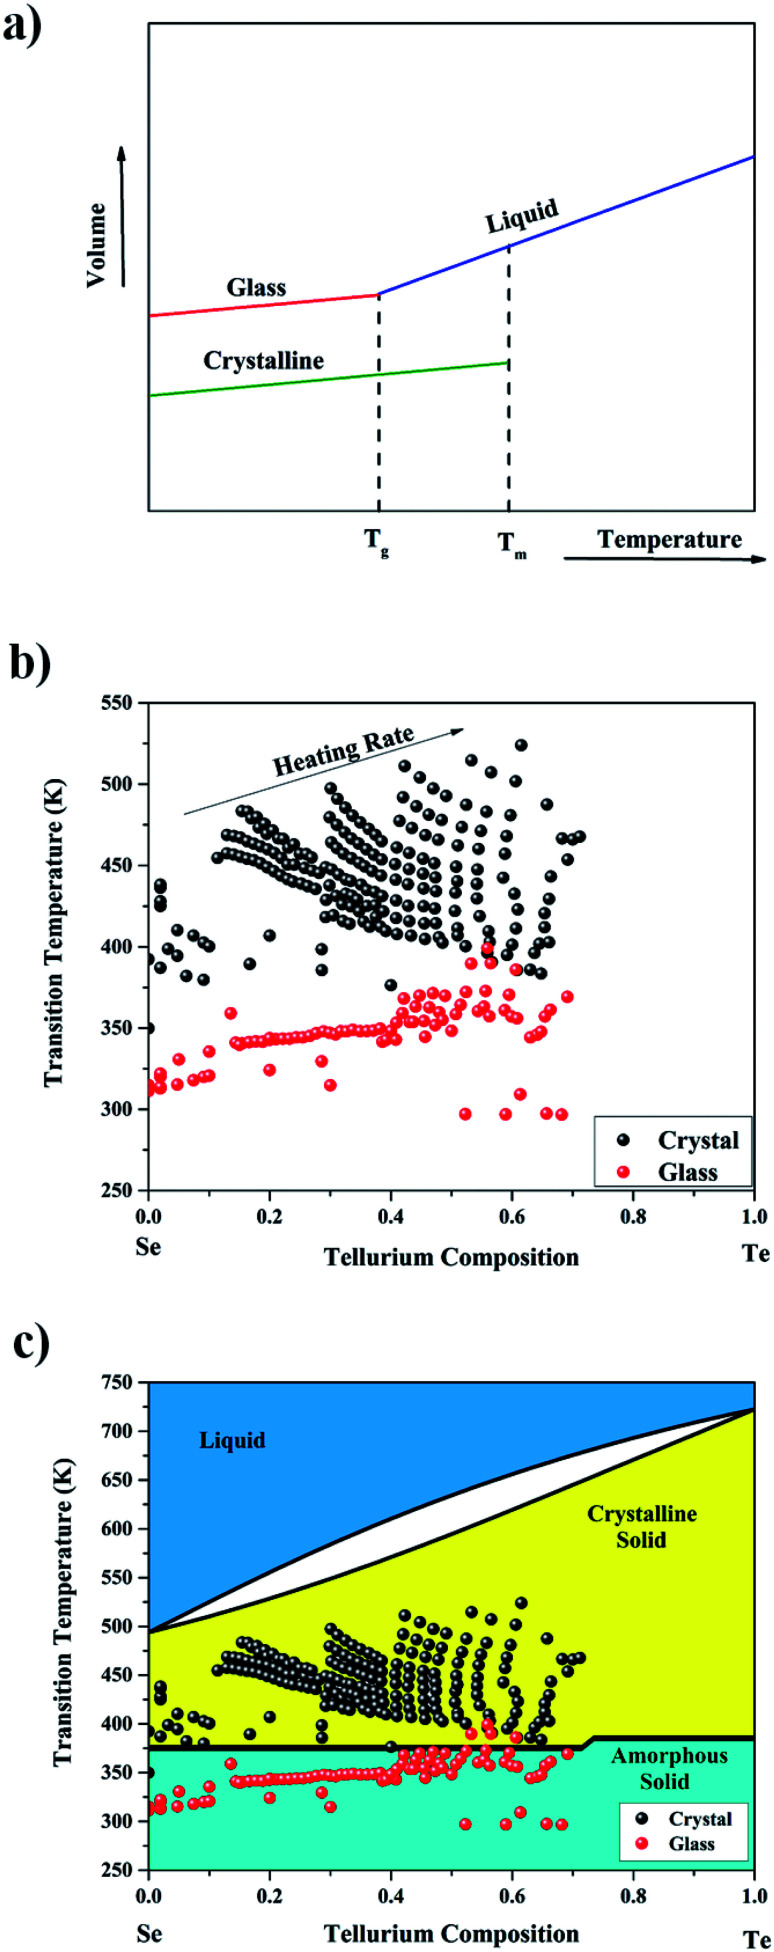
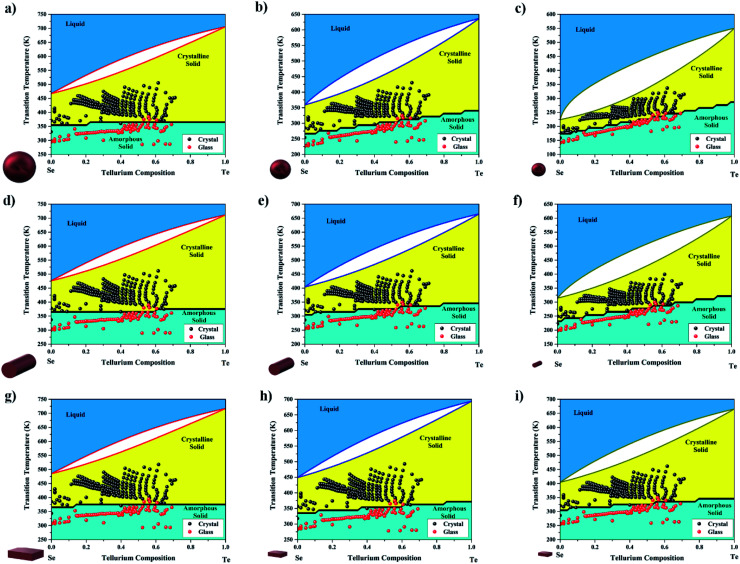
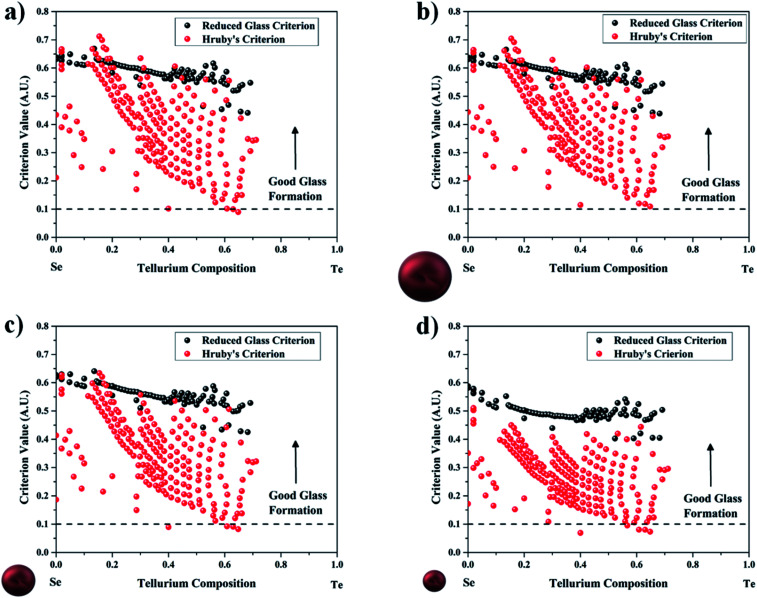
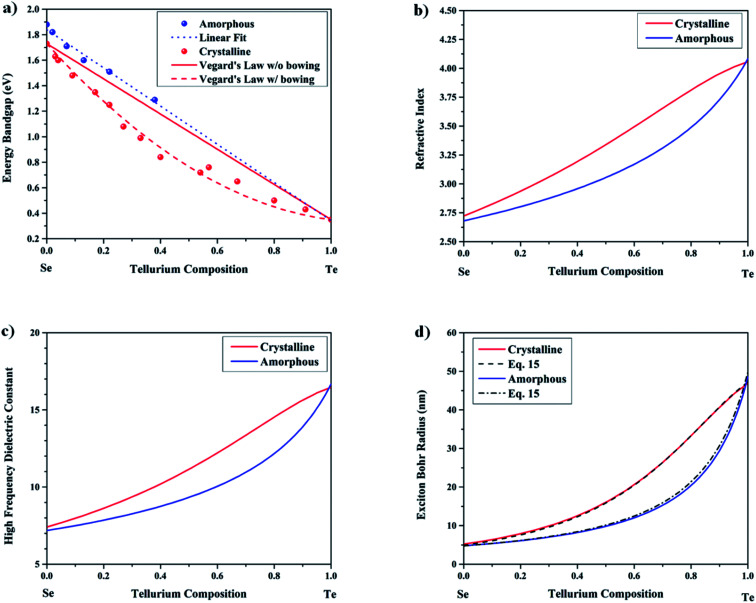
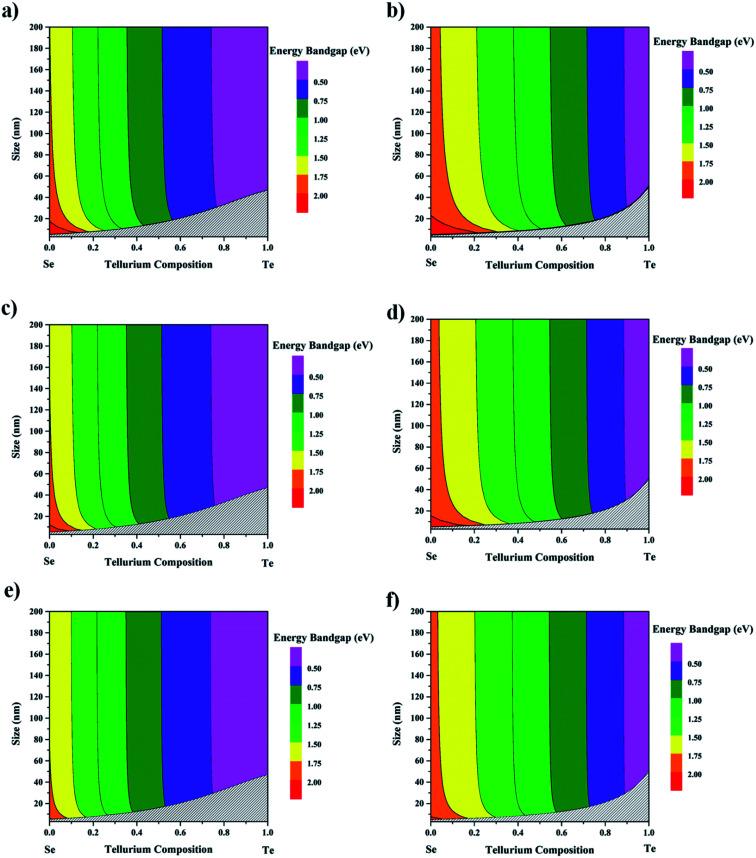
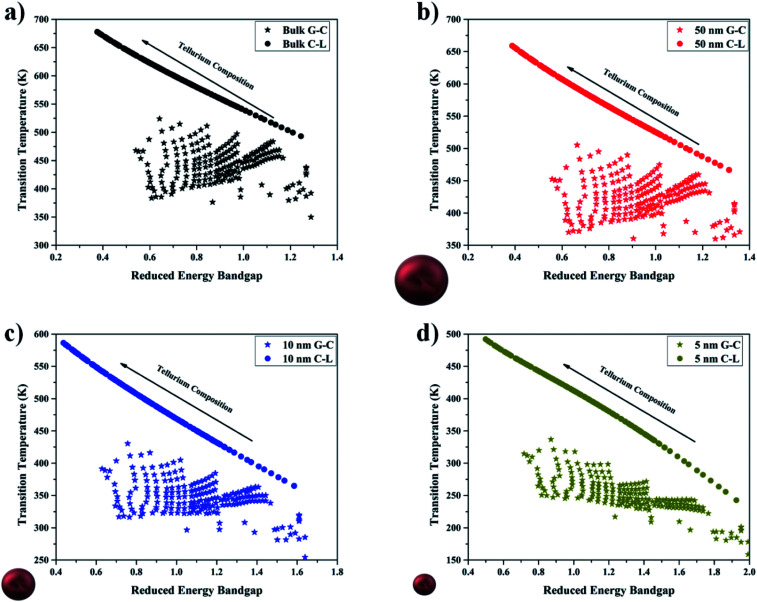
Selenium and tellurium are both energy critical elements as defined by the American Physical Society and the Materials Research Society. When mixed together, both elements form an alloy. The size- and shape-dependent thermal and optical properties of this alloy are investigated in this manuscript by using nano-thermodynamics and machine learning techniques. This alloy is found to have particularly interesting properties for solar cell applications.


Conflict of interest statement

There are no conflicts to declare.

Figures

Fig. 1
Fig. 1. World reserves of (a) selenium and (b) tellurium. The 2020 data come from the U.S. Geological Survey (USGS). (c) Price per kilogram of material as a function of time. The time period covers the last 5 years. World consumption of (d) selenium and (e) tellurium. All data come from the USGS.
Fig. 2
Fig. 2. (a) Binary phase diagram of the bulk Se1−xTex alloy displaying the solidusliquidus curves (eqn (1)). Experimental data points are taken from ref. . Binary phase diagram for the Se1−xTex alloy displaying the solidusliquidus curves (eqn (1) and (2)) at the nanoscale (50, 10 and 5 nm) for the (b) sphere, (c) wire, and (d) film morphologies.
Fig. 3
Fig. 3. Size-dependent enthalpy of mixing at 500 K for the solid solution of Se1−xTex alloy considering the spherical morphology.
Fig. 4
Fig. 4. Surface composition versus the core composition of the Se1−xTex alloy at the solidus temperature for the (a) sphere, (b) wire, and (c) film morphologies. (d) Surface segregation index as defined in ref. versus the size of the nanostructure.
Fig. 5
Fig. 5. Debye temperature versus the size of (a) Se nanostructures, (b) Te nanostructures. Einstein temperature versus the size of (c) Se nanostructures, (d) Te nanostructures. Experimental data for (a) and (c) are from ref. for spherical nanoparticles, and (d) from ref. for Te films.
Fig. 6
Fig. 6. Compositionally dependent Debye Temperature for the Se1−xTex alloy in the (a) bulk, and the (b) sphere, (c) wire, and (d) film morphologies.
Fig. 7
Fig. 7. (a) Sketch representing the two possible scenarios for solidification, the crystallization path and the glass transition path. (b) Experimental data are from ref. , which were extracted by using the online tool WebPlotDigitizer, and ref. . (c) Logistic regression classifier shows the boundary between the crystalline region and the amorphous region. Below this temperature, one should expect a glass transition; but above this temperature, one should expect a crystalline transition.
Fig. 8
Fig. 8. (a, b, and c) Nano-sized glass (yellow) and crystalline (cyan) phases for spherical particles with sizes of 50 nm, 10 nm, and 5 nm, respectively. (d, e, and f) Nano-sized glass (yellow) and crystalline (cyan) phases for wire morphologies with sizes of 50 nm, 10 nm, and 5 nm, respectively. (g, h, and i) Nano-sized glass (yellow) and crystalline (cyan) phases for films with sizes of 50 nm, 10 nm, and 5 nm, respectively.
Fig. 9
Fig. 9. Reduced glass criterion and Hruby's criterion for the (a) bulk, and spherical particle morphologies with sizes equal to (b) 50 nm, (c) 10 nm, and (d) 5 nm. Typically, those with a value greater than 0.1 in the Hruby's criterion are good glass formers.
Fig. 10
Fig. 10. (a) Energy bandgap versus the Te composition of the bulk Se1−xTex alloy. Experimental data points taken from ref. for the amorphous case and ref. for the crystalline case. (b) Refractive index versus the Te composition for the amorphous and crystalline cases. (c) High-frequency dielectric constant versus the Te composition for the amorphous and crystalline cases. (d) Exciton Bohr radius versus the Te composition calculated according to ref. for the amorphous and crystalline cases, and curve fitting by eqn (17) using the calculated high-frequency dielectric constant from Fig. 8c and assuming a linear exciton effective mass for the amorphous case and Vegard's law like with bowing for the crystalline case.
Fig. 11
Fig. 11. Contour plots displaying the energy bandgap of the Se1−xTex alloy versus the Te composition and size of the alloy in crystalline and amorphous states for the (a and b) sphere, (c and d) wire, and (e and f) film morphologies. Areas in grey are the respective exciton Bohr radii for the crystalline and amorphous phases.
Fig. 12
Fig. 12. Transition temperature vs. reduced energy bandgap of the amorphous (stars) and crystalline (circles) phases for the (a) bulk and nano-sized spherical nanoparticles with sizes equal to (b) 50 nm, (c) 10 nm, and (d) 5 nm.

References

    1. Hurd A. J. et al., Energy-critical elements for sustainable development. MRS Bull. 2012;37:405–410. doi: 10.1557/mrs.2012.54. - DOI
    1. Jaffe R., et al., Energy Critical Elements: Securing Materials for Emerging Technologies, POPA Reports, February 2011, pp. 1–28
    1. https://www.rsc.org/periodic-table/element/34/selenium. https://www.rsc.org/periodic-table/element/34/selenium
    1. https://www.rsc.org/periodic-table/element/52/tellurium. https://www.rsc.org/periodic-table/element/52/tellurium
    1. Hoffmann J. E. Recovering Selenium and Tellurium from Copper Refinery Slimes. JOM. 1989:33–38. doi: 10.1007/BF03220269. - DOI