. 2020 Sep 2;2(10):4522-4528.
doi: 10.1039/d0na00629g. eCollection 2020 Oct 13.

Determining the morphology and concentration of core-shell Au/Ag nanoparticles

Affiliations

Determining the morphology and concentration of core-shell Au/Ag nanoparticles

Jieli Lyu et al. Nanoscale Adv. .

Abstract

Accurately measuring the shape, structure and concentration of nanoparticles (NPs) is a crucial step towards understanding their formation and a prerequisite for any applications. While determining these parameters for single-metal NPs is by now rather routine, reliably characterizing bimetallic NPs is still a challenge. Using four complementary techniques: transmission electron microscopy (TEM), light absorbance spectroscopy (AS), small-angle X-ray scattering (SAXS) and inductively coupled plasma mass spectrometry (ICP-MS) we study bimetallic nanoparticles obtained by growing a silver shell on top of a gold seed. The initial quasi-spherical objects become faceted and grow into a rounded cube as the molar silver-to-gold ratio K increases. The shape evolution is well described by SAXS and TEM. The shell thickness, overall size polydispersity and number particle concentration obtained by the various methods are in good agreement, validating the use of non-invasive in situ techniques such as AS and SAXS for the study of bimetallic NPs.


Conflict of interest statement

There are no conflicts to declare.

Figures

Fig. 1
Fig. 1. TEM images for different values of the molar ratio K.
Fig. 2
Fig. 2. Quadraticity parameter Q. Left: average value 〈Q〉 as a function of K (mean and standard deviation, solid dots and error bars) with linear fit (solid line). The limiting values for a perfect circle and square are shown as dashed lines. Right: histograms of Q for each K value (shifted vertically for clarity). The mean and std. dev. from the left panel are shown under each curve. Colors (black, blue and red) distinguish three types of curves (see text).
Fig. 3
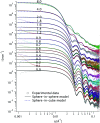
Fig. 3. Scattered intensity I as a function of the scattering vector q for all solutions (dots, various colors). The spectra were shifted vertically for clarity. The molar Ag/Au ratio K is indicated above each curve. Fits with the sphere-in-sphere model (solid lines) and with the sphere-in-cube model (dashed lines) are displayed for each curve.
Fig. 4
Fig. 4. Goodness-of-fit function for the SAXS models in Fig. 3, shown as solid squares (for the sphere-in-sphere model) and as open circles (for the sphere-in-cube model) as a function of the Ag/Au ratio K.
Fig. 5
Fig. 5. Shell thickness extracted from the fits in Fig. 3 for the two models and corresponding geometrical predictions (see the text for more details). The TEM values are shown as red diamonds.
Fig. 6
Fig. 6. Relative polydispersity extracted from the SAXS fits in Fig. 3 for the two models (solid squares for sphere-in-sphere and open dots for sphere-in-cube). The circled points with abnormally low values (for K = 0.8 and 0.9) have very poor fit quality (see Fig. 4). Relative polydispersity extracted from the TEM data (solid dots).
Fig. 7
Fig. 7. The Ag/Au ratio in the particles, measured by ICP-MS, versus the same ratio in solution, K (diamonds). The dashed line marks the expected values if all the silver is deposited onto the gold cores.
Fig. 8
Fig. 8. Number particle density n as a function of the Ag/Au ratio K, extracted from fitting the SAXS data in Fig. 3 (solid black squares), from the UV-vis absorbance data (open red dots) and from ICP-MS (blue diamonds). Anomalously low SAXS values are circled.

References

    1. Ma Y. Li W. Cho E. C. Li Z. Yu T. Zeng J. Xie Z. Xia Y. ACS Nano. 2010;4:6725–6734. doi: 10.1021/nn102237c. - DOI - PMC - PubMed
    1. Okuno Y. Nishioka K. Kiya A. Nakashima N. Ishibashi A. Niidome Y. Nanoscale. 2010;2:1489–1493. doi: 10.1039/C0NR00130A. - DOI - PubMed
    1. Park K. Drummy L. F. Vaia R. A. J. Mater. Chem. 2011;21:15608. doi: 10.1039/C1JM12489G. - DOI
    1. Gómez-Graña S. Goris B. Altantzis T. Fernández-López C. Carbó-Argibay E. Guerrero-Martínez A. Almora-Barrios N. López N. Pastoriza-Santos I. Pérez-Juste J. Bals S. Van Tendeloo G. Liz-Marzán L. M. J. Phys. Chem. Lett. 2013;4:2209–2216. doi: 10.1021/jz401269w. - DOI
    1. Tebbe M. Kuttner C. Mayer M. Maennel M. Pazos-Perez N. König T. A. Fery A. J. Phys. Chem. C. 2015;119:9513–9523. doi: 10.1021/acs.jpcc.5b03155. - DOI - PMC - PubMed