. 2022 Sep 5:13:932286.
doi: 10.3389/fendo.2022.932286. eCollection 2022.

Renal oncometabolite L-2-hydroxyglutarate imposes a block in kidney tubulogenesis: Evidence for an epigenetic basis for the L-2HG-induced impairment of differentiation

Affiliations

Renal oncometabolite L-2-hydroxyglutarate imposes a block in kidney tubulogenesis: Evidence for an epigenetic basis for the L-2HG-induced impairment of differentiation

Mary Taub et al. Front Endocrinol (Lausanne). .

Abstract

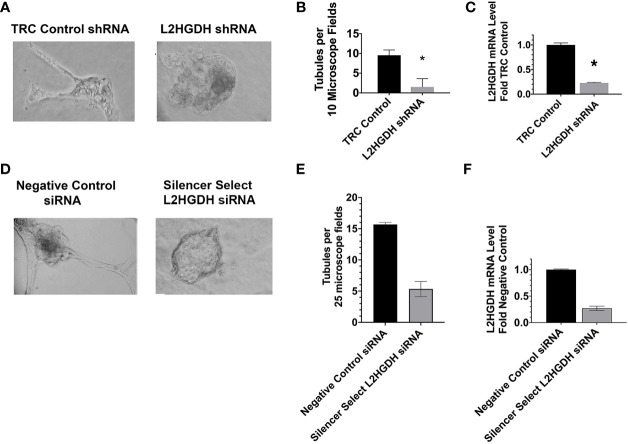
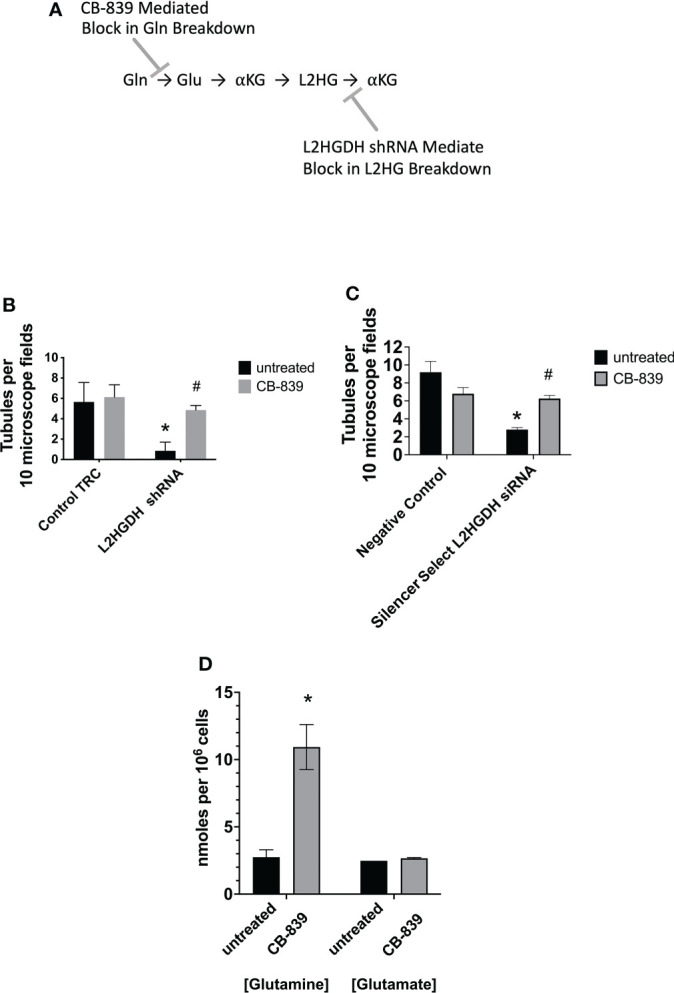
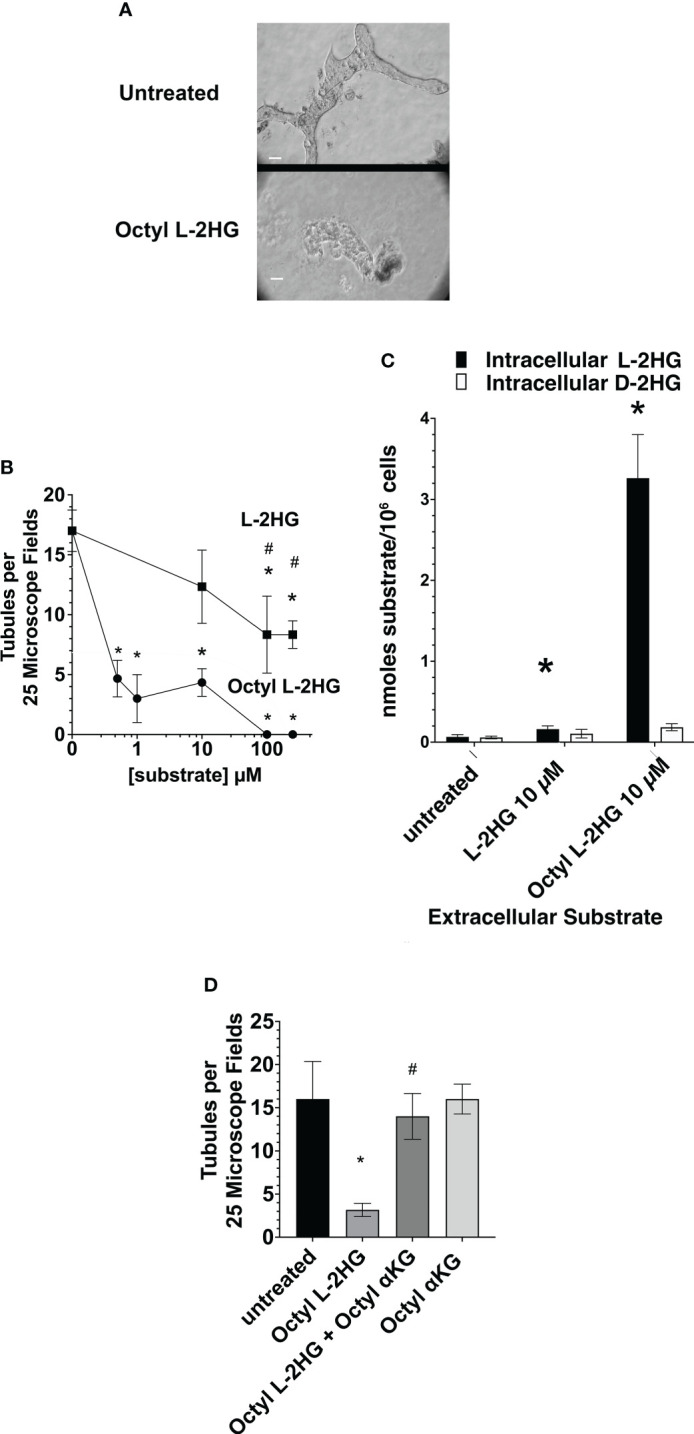
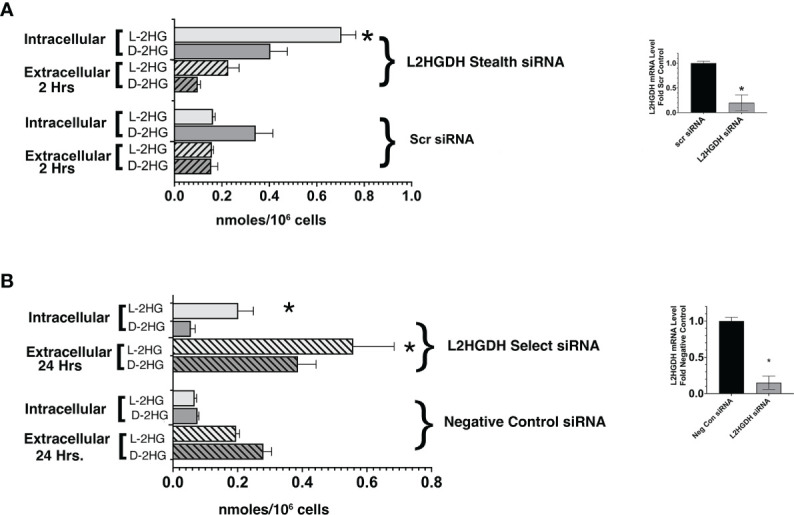
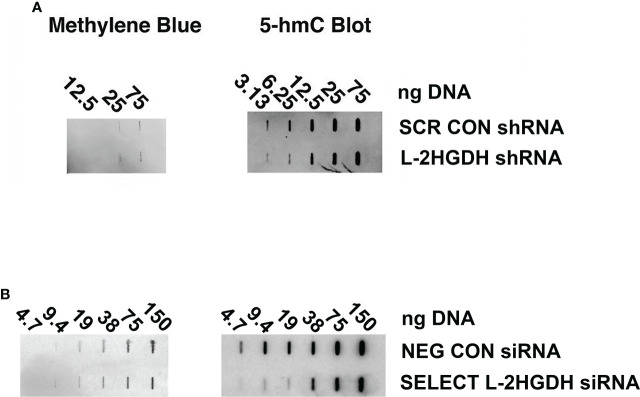
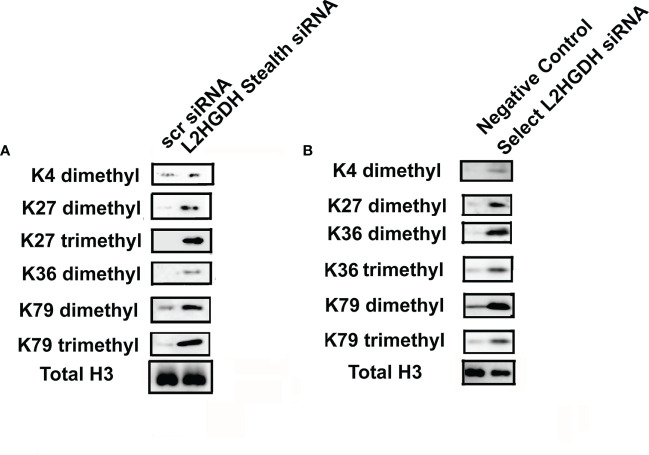
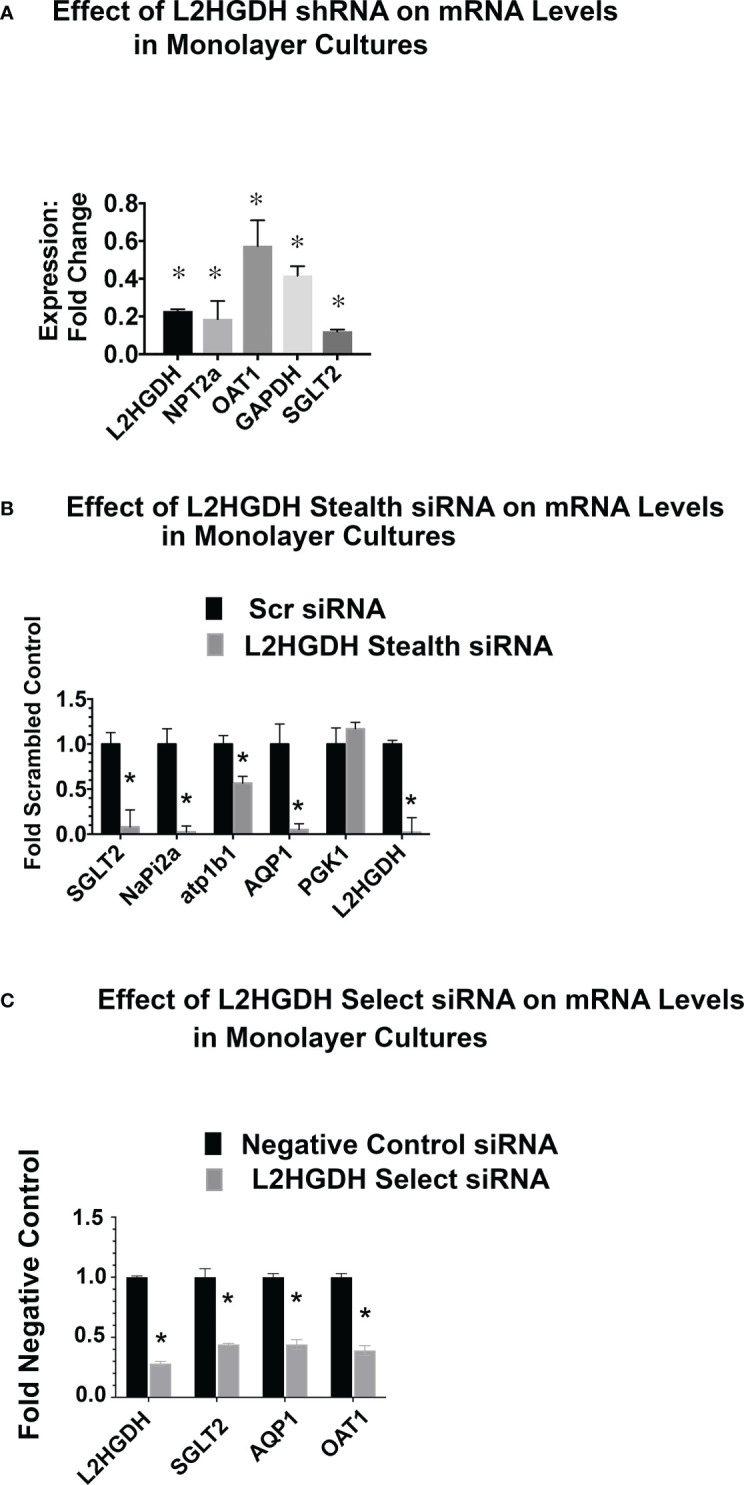
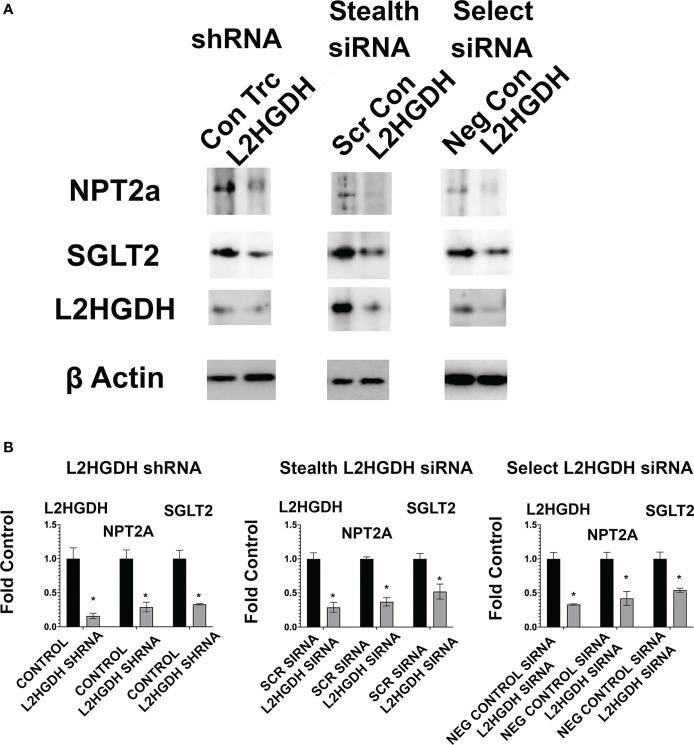
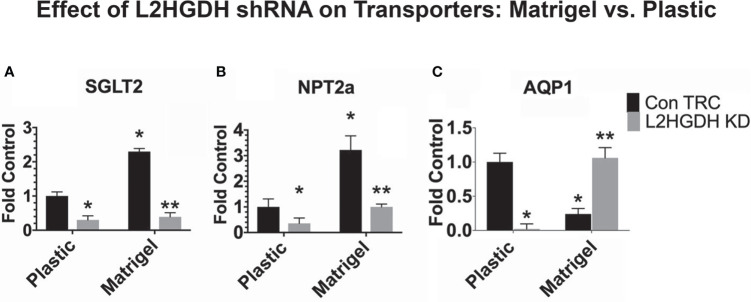
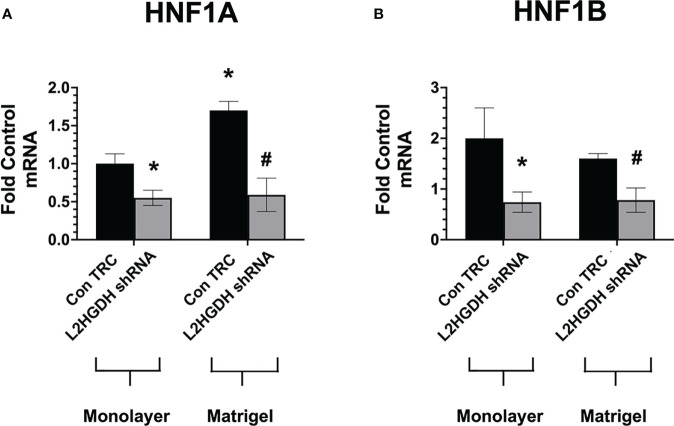
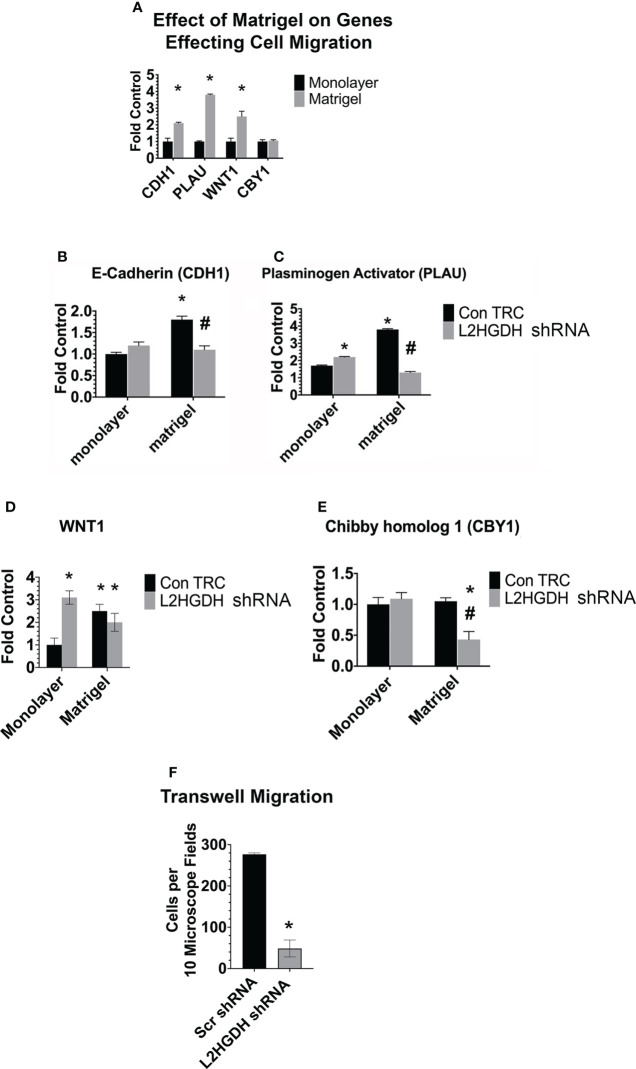
2-Hydroxyglutarate (2HG) overproducing tumors arise in a number of tissues, including the kidney. The tumorigenesis resulting from overproduced 2HG has been attributed to the ability of 2HG alter gene expression by inhibiting α-ketoglutarate (αKG)-dependent dioxygenases, including Ten-eleven-Translocation (TET) enzymes. Genes that regulate cellular differentiation are reportedly repressed, blocking differentiation of mesenchymal cells into myocytes, and adipocytes. In this report, the expression of the enzyme responsible for L2HG degradation, L-2HG dehydrogenase (L2HGDH), is knocked down, using lentiviral shRNA, as well as siRNA, in primary cultures of normal Renal Proximal Tubule (RPT) cells. The knockdown (KD) results in increased L-2HG levels, decreased demethylation of 5mC in genomic DNA, and increased methylation of H3 Histones. Consequences include reduced tubulogenesis by RPT cells in matrigel, and reduced expression of molecular markers of differentiation, including membrane transporters as well as HNF1α and HNF1β, which regulate their transcription. These results are consistent with the hypothesis that oncometabolite 2HG blocks RPT differentiation by altering the methylation status of chromatin in a manner that impedes the transcriptional events required for normal differentiation. Presumably, similar alterations are responsible for promoting the expansion of renal cancer stem-cells, increasing their propensity for malignant transformation.

Keywords: L-2-Hydroxyglutarate; differentiation; matrigel (MA); proximal tubule; renal cell carcinoma.


Conflict of interest statement

The authors declare that the research was conducted in the absence of any commercial or financial relationships that could be construed as a potential conflict of interest.

Figures

Figure 1
Figure 1
Inhibition of tubulogenesis by L2HGDH shRNA AND L2HGDH siRNA. Primary RPT cell cultures were either (A) transduced with lentivirus containing either L2HGDH shRNA or Control TRC shRNA vectors, or (D) transfected with either Silencer Select L2HGDH siRNA, or Negative Control siRNA. Prior to culturing in matrigel, the shRNA transduced cells were selected 1 week with 1.6 µg/ml puromycin, while the siRNA transfected cells were cultured 1 day to allow for gene expression. Subsequently, the primary cultures were trypsinized and passaged into matrigel in DMEM/F12-IT further supplemented with 5 ng/ml EGF, as described in Materials and Methods. Representative microscope fields of matrigel cultures are illustrated including (A1) matrigel cultures transduced with either Control TRC shRNA or L2HGDH shRNA, and (B1) matrigel cultures transfected with either Silencer Select L2HGDH siRNA or Negative Control siRNA. (B) the effect of the L2HGDH shRNA on number of tubules was quantitated, relative to Control shRNA, and (C) the relative levels of L2HGDH mRNA determined in the two conditions. Similarly, in (E) the effect of Silencer Select L2HGDH siRNA on the number of tubules was quantitated, relative to Negative Control siRNA, and (F) the relative levels of L2HGDH mRNA determined in the same 2 conditions. Values are averages +/- SEM of triplicate determinations. (*) p < 0.05 relative to either the TRC control shRNA (B, C) or the Negative Control siRNA (E, F), respectively. Scale Bars, 50 µm.
Figure 2
Figure 2
Effect of Glutaminase Inhibitor CB-839 on tubulogenesis. (A) Model for the Effect of CB-839 on Gln metabolism. Shelar et al. (2) previously presented evidence indicating that L2HG in RCCs primarily originates from Gln, initially occurring via the metabolism of Gln to Glu by Glutaminase. L2HG is subsequently metabolized to αKG by L2HGDH. (B) Primary RPT cultures were transduced with lentivirus containing either L2HGDH shRNA or Control TRC shRNA, selected with puromycin, and passaged into matrigel, as described in the Figure 1 legend. (C) Primary RPT cell cultures were transfected with Silencer Select L2HGDH siRNA or Negative Control siRNA, and passaged into matrigel 1 day later, as described in the Figure 1 legend. In parts (B, C) Matrigel cultures were incubated with DMEM/F12- IT further supplemented with 5 ng/ml EGF and either 1 µM CB-839 or no further supplement, the day after cultures were initiated in matrigel. In parts (B, C), tubules were counted as described in the Figure 1 legend. Values are averages +/- SEM of triplicate determinations. (*) p < 0.05 relative to untreated Control TRC; (#) p < 0.05 relative to the untreated L2HGDH condition. (D) The level of glutamine and glutamate was determined in primary RPT cell cultures treated with either 1 µM CB-839 or untreated, as described in Materials and Methods. Values are averages +/- SEM of triplicate determinations. (*) p < 0.05 relative to untreated control in the glutamine condition.
Figure 3
Figure 3
Inhibition of tubulogenesis by Octyl L-2HG. (A) Representative microscope fields of either control matrigel cultures in DMEM/F12-IT supplemented with 5 ng/ml EGF alone, or further supplemented with 100 µM Octyl L-2HG. (B) The frequency of tubule formation as a function of the concentration of either Octyl L-2HG or L-2HG. (C) Effect of 10 µM L-2HG or Octyl L-2HG on the intracellular L- and D-2HG concentration. (D) Effect of 5-octyl-αKG (250 µM) on the Octyl L-2HG (100 µM)-induced inhibition of tubulogenesis. Values are averages +/- SEM of triplicate determinations. (*) p < 0.05 relative to untreated cultures; (#) p < 0.05 relative to Octyl L2HG. Scale Bar, 50 µm.
Figure 4
Figure 4
Effect of L2HGDH shRNA an L2HGDH siRNA on the intra- and extracellular L- and D-2Hydroxyglutarate Level. (A) Primary RPT cells were transfected with either L2HGDH Stealth siRNA or the corresponding Scrambled siRNA. The medium was changed on Days 1, 2 and 3 post-transcription. (A) Two hours after the medium change on Day 3 post-transfection, frozen cell pellets were prepared, and medium was collected. (B) Primary cultures were transfected either with L2HGDH Silencer Select siRNA or Negative Control siRNA. As in part A, the medium was changed on Days 1, 2 and 3 post-transfection. The medium that was changed on Day 3, however, was collected and frozen, while frozen pellets were prepared 2 h after the final medium change. The L- and D-2HG in each of the samples (i.e. cell pellets and medium) was derivatized, separated by GC/MS, and quantitated, as described in Materials and Methods. Values are averages (+/- SEM) of triplicate determinations. In part A, *p < 0.05 relative to intracellular L-2HG with Scr siRNA, while in part B, *p < 0.05 relative to Negative Control siRNA in the same condition (i.e. either intracellular L-2HG, or extracellular L-2HG). In the insets, L2HGDH mRNA levels were determined as described in Materials and Methods. (*) p < 0.05 relative to Control condition.
Figure 5
Figure 5
Effect of L2HGHD shRNA and siRNA on DNA methylation. The effect of L 2HGDH shRNA and siRNA on 5hmC levels. Genomic DNA was purified from primary cultures (A) transduced with lentivirus containing either Scrambled shRNA or L2HGDH shRNA vectors, or (B) transfected with either Negative Control siRNA, or Silencer Select L2HGDH siRNA. Serial dilutions of the genomic DNA were applied to slot blots. Subsequently, blots were probed with a 5hmC antibody, and total DNA visualized with methylene blue.
Figure 6
Figure 6
Effect of L2HGDH siRNA on histone methylation. Nuclear histones were purified from primary cultures transfected either with (A) L2HGDH Stealth siRNA or Scrambled Control Stealth siRNA, or (B) Silencer Select L2HGDH siRNA or Negative Control siRNA. Three days later, nuclear histones were purified. Subsequently, nuclear histones were separated by SDS/PAGE, transferred to nitrocellulose, followed by Western analysis, as described in Materials and Methods.
Figure 7
Figure 7
Effect of L2HGDH shRNA and L2HGDH siRNA on the expression of transporter mRNAs in monolayer cultures. (A) The expression of the mRNAs for L2HGDH, NPT2a, OAT1, GAPDH and SGLT2 was determined in primary cultures transduced with lentivirus containing either an L2HGDH shRNA or Control TRC vector. The relative expression of mRNAs in cultures transduced with L2HGDH shRNA was compared to the level in cultures transduced with Control TRC shRNA. (B) Relative mRNA levels were determined in primary RPT cells transfected twice with either L2HGDH Stealth siRNA or Scrambled siRNA. (C) Relative mRNA levels were determined in primary RPT cells transfected twice with either L2HGDH Silencer Select siRNA or Negative Control siRNA, as described in Materials and Methods. In part A, (*) p < 0.05 relative to either the TRC Control (Part A), the Scrambled Control (Part B), or, the Negative Control (Part C).
Figure 8
Figure 8
Effect of lentiviral L2HGDH shRNA and L2HGDH siRNA on the level of the NPT2a, SGLT2 and L2HGDH proteins in monolayer cultures. (A) Blots of shRNA and siRNA-treated primary cultures. Blots used in the study were prepared following Western transfers of SDS/PAGE gels, as described in Materials and Methods. The samples in the blots were derived from lysates of primary cultures treated either with (i) L2HGDH shRNA (or Control TRC shRNA), (ii) L2HGDH Stealth siRNA (or Scrambled siRNA), or (iii) L2HGDH Silencer Select siRNA (or Negative Control siRNA). (B) Relative Levels of NPT2a, SGLT2 and L2HGDH. The relative levels of NPT2a, SGLT2 and L2HGDH were determined using ImageLab software. Values are averages (+/- SEM) from duplicate bands for each sample. (*) p < 0.05 relative to the TRC Control (for L2HGDH shRNA), the Scr Control (for L2HGDH Stealth siRNA), and the Negative Control (for L2HGH Silencer Select siRNA).
Figure 9
Figure 9
Effect of matrigel on transporter gene expression. Primary cultures of RPT cells were transduced with lentiviral L2HGDH shRNA or Control TRC shRNA. A portion of the cultures was transferred into either matrigel or onto plastic. The relative level of mRNA for (A) SGLT2, (B) NPT2a, and (C) AQP1 was determined as described in Materials and Methods. (*) p < 0.05 for the Con TRC Plastic Control; (**) p < 0.05 for the ConTRC Matrigel Control.
Figure 10
Figure 10
Effect of L2HGDH shRNA on expression of HNF1α and HNF1α. Primary RPT cells were transduced with lentiviral L2HGDH shRNA or Control TRC shRNA. A portion of the cultures was transferred either into matrigel or onto plastic. The relative level of mRNA for (A) HNF1α and (B) HNF1β was determined as described in Materials and Methods. (*) p < 0.05 relative to Con TRC Monolayers; (#) p < 0.05 relative to Con TRC Matrigel cultures.
Figure 11
Figure 11
Expression of genes affecting tubulogenesis, and cell migration. (A). The relative level of mRNA encoding for E-Cadherin (CDH1), tissue Plasminogen Activator (PLAU), Wnt1 and Chibby homolog 1 (CBY1) was determined in parallel monolayer and matrigel cultures. The relative level of the mRNA encoding for (B) E-Cadherin, (C) Plasminogen Activator, (D) WNT1, and (E) CBY1 (1) was determined in monolayer and matrigel cultures tranduced with lentiviral L2HGDH shRNA or Control TRC shRNA. (F) EGF-stimulated cell migration across PET membranes was determined in RPT cells following their transduction with lentiviral L2HGDH shRNA or Con TRC shRNA. (*) p < 0.05 relative to monolayer cultures in the same condition in panel (A); In panels (B–E), (*) p < 0.05 relative to the Con TRC monolayer culture condition; in 11F (*) p < 0.05 relative to the scr shRNA condition; (#) p < 0.05 relative to the Con TRC Matrigel Condition (E).

References

    1. Losman JA, Kaelin WG, Jr. What a difference a hydroxyl makes: mutant IDH, (R)-2-hydroxyglutarate, and cancer. Genes Dev (2013) 27:836–52. doi: 10.1101/gad.217406.113 - DOI - PMC - PubMed
    1. Shelar S, Shim EH, Brinkley GJ, Kundu A, Carobbio F, Poston T, et al. . Biochemical and epigenetic insights into l-2-Hydroxyglutarate, a potential therapeutic target in renal cancer. Clin Cancer Res (2018) 24:6433–46. doi: 10.1158/1078-0432.CCR-18-1727 - DOI - PMC - PubMed
    1. Xu W, Yang H, Liu Y, Yang Y, Wang P, Kim SH, et al. . Oncometabolite 2-hydroxyglutarate is a competitive inhibitor of alpha-ketoglutarate-dependent dioxygenases. Cancer Cell (2011) 19:17–30. doi: 10.1016/j.ccr.2010.12.014 - DOI - PMC - PubMed
    1. Schvartzman JM, Reuter VP, Koche RP, Thompson CB. 2-hydroxyglutarate inhibits MyoD-mediated differentiation by preventing H3K9 demethylation. Proc Natl Acad Sci USA (2019) 116:12851–6. doi: 10.1073/pnas.187662116 - DOI - PMC - PubMed
    1. Lu C, Ward PS, Kapoor GS, Rohle D, Turcan S, Abdel-Wahab O, et al. . IDH mutation impairs histone demethylation and results in a block to cell differentiation. Nature (2012) 483:474–8. doi: 10.1038/nature10860 - DOI - PMC - PubMed

Publication types

LinkOut - more resources