. 2021 Apr 9;3(11):3124-3135.
doi: 10.1039/d1na00172h. eCollection 2021 Jun 1.

Inverted perovskite solar cells with enhanced lifetime and thermal stability enabled by a metallic tantalum disulfide buffer layer

Affiliations

Inverted perovskite solar cells with enhanced lifetime and thermal stability enabled by a metallic tantalum disulfide buffer layer

Konstantinos Chatzimanolis et al. Nanoscale Adv. .

Abstract

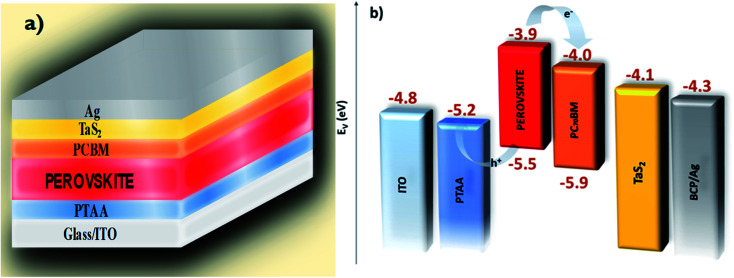
Perovskite solar cells (PSCs) have proved their potential for delivering high power conversion efficiencies (PCE) alongside low fabrication cost and high versatility. The stability and the PCE of PSCs can readily be improved by implementing engineering approaches that entail the incorporation of two-dimensional (2D) materials across the device's layered configuration. In this work, two-dimensional (2D) 6R-TaS2 flakes were exfoliated and incorporated as a buffer layer in inverted PSCs, enhancing the device's PCE, lifetime and thermal stability. A thin buffer layer of 6R-TaS2 flakes was formed on top of the electron transport layer to facilitate electron extraction, thus improving the overall device performance. The optimized devices reach a PCE of 18.45%, representing a 12% improvement compared to the reference cell. The lifetime stability measurements of the devices under ISOS-L2, ISOS-D1, ISOS-D1I and ISOS-D2I protocols revealed that the TaS2 buffer layer retards the intrinsic, thermally activated degradation processes of the PSCs. Notably, the devices retain more than the 80% of their initial PCE over 330 h under continuous 1 Sun illumination at 65 °C.


Conflict of interest statement

There are no conflicts to declare.

Figures

Fig. 1
Fig. 1. (a) Schematic illustration of an inverted PSC incorporating 6R-TaS2 flakes, with the following layered stack: Glass/ITO/PTAA/Perovskite/PC70BM/TaS2/Ag. (b) Energy level diagram of the material stack in the PSC.
Fig. 2
Fig. 2. Representative top-view and cross-sectional SEM images of PSC-Ref (panels a, c) and PSC-2 (panels b, d). (a) Top-view of perovskite surface prior to PCBM deposition in PSC-Ref. (b) Top-view of the 6R-TaS2 buffer layer on top of the PC70BM layer. (c) Cross-sectional SEM image of PSC-Ref. (d) Cross-section SEM image of PSC-2 incorporating the TaS2 buffer layer. False colouring was used for the different layers of the structure: ITO/PTAA/perovskite (PSK)/PC70BM/Ag.
Fig. 3
Fig. 3. Photovoltaic performance of the reference PSC (PSC-Ref) and the PSCs incorporating TaS2 flakes as a buffer layer (PSC-X). (a) Box chart of PCE performance for PSC-Ref, PSC-1, PSC-2 PSC-3 and PSC-5, and (b) the JV curves measured for the champion devices for each PSC configuration.
Fig. 4
Fig. 4. Estimation of the carrier's lifetime, the extracted charge density, as well as the effective carrier mobility, based on transient measurements. (a) Extracted carrier's lifetime from TPV decay measurements at different bias conditions. (b) Charge density extracted from TPC measurements. The lines in panels (a, b) represent linear fittings. (c) Drift mobility estimation from the photo-CELIV technique.
Fig. 5
Fig. 5. Lifetime measurements of encapsulated perovskite devices under continuous 1 sun illumination, 65 °C and 10–15% RH. (a) Long term ISOS-L2 lifetime measurements of PSC-Ref (black), PSC-1 (red), PSC-2 (magenta), PSC-3 (green) and PSC-5 (blue). (b) Normalized PCE over time for PSC-2. The degradation rate is calculated from a linear fit of the experimental data in the stabilized region. Tburn-in marks the end of the burn-in phase and Ts80 denotes the time at which the PCE drops to 80% of the initial PCE at Tburn-in in the stabilized region.
Fig. 6
Fig. 6. Lifetime measurements for PSC-2 (red), compared to those of PSC-Ref (black) using the following stress factors: (a) under inert atmosphere and 0% RH in the dark, (b) thermal stress at 65 °C under inert conditions and 0% RH and (c) under ambient conditions in the dark of unencapsulated cells.

References

    1. Yoo J. J. Seo G. Chua M. R. Park T. G. Lu Y. Rotermund F. Kim Y. Moon C. S. Jeon N. J. Correa-Baena J.-P. Bulović V. Shin S. S. Bawendi M. G. Seo J. Nature. 2021;590:587–593. doi: 10.1038/s41586-021-03285-w. - DOI - PubMed
    1. Das S. Pandey D. Thomas J. Roy T. Adv. Mater. 2019;31:1802722. doi: 10.1002/adma.201802722. - DOI - PubMed
    1. Agresti A. Pescetelli S. Palma A. L. Martín-García B. Najafi L. Bellani S. Moreels I. Prato M. Bonaccorso F. Di Carlo A. ACS Energy Lett. 2019;4:1862–1871. doi: 10.1021/acsenergylett.9b01151. - DOI
    1. Agresti A. Pescetelli S. Palma A. L. Del Rio Castillo A. E. Konios D. Kakavelakis G. Razza S. Cinà L. Kymakis E. Bonaccorso F. Di Carlo A. ACS Energy Lett. 2017;2:279–287. doi: 10.1021/acsenergylett.6b00672. - DOI
    1. Agresti A. Pescetelli S. Palma A. L. Martín-García B. Najafi L. Bellani S. Moreels I. Prato M. Bonaccorso F. Di Carlo A. ACS Energy Lett. 2019;4:1862–1871. doi: 10.1021/acsenergylett.9b01151. - DOI