. 2020 Oct 30;2(12):5728-5736.
doi: 10.1039/d0na00636j. eCollection 2020 Dec 15.

Nanonewton forces between Staphylococcus aureus surface protein IsdB and vitronectin

Affiliations

Nanonewton forces between Staphylococcus aureus surface protein IsdB and vitronectin

Marion Mathelié-Guinlet et al. Nanoscale Adv. .

Abstract

Single-molecule experiments have recently revealed that the interaction between staphylococcal surface proteins and their ligands can be extremely strong, equivalent to the strength of covalent bonds. Here, we report on the unusually high binding strength between Staphylococcus aureus iron-regulated surface determinant B (IsdB) and vitronectin (Vn), an essential human blood protein known to interact with bacterial pathogens. The IsdB-Vn interaction is dramatically strengthened by mechanical tension, with forces up to 2000 pN at a loading rate of 105 pN s-1. In line with this, flow experiments show that IsdB-mediated bacterial adhesion to Vn is enhanced by fluid shear stress. The stress-dependent binding of IsdB to Vn is likely to play a role in promoting bacterial adhesion to human cells under fluid shear stress conditions.


Conflict of interest statement

There are no conflicts of interest to declare.

Figures

Fig. 1
Fig. 1. IsdB-dependent bacterial adhesion to Vn-substrates. (A) Schematic diagram of the domain organization of Vn and IsdB. S: signal sequence; SMB: somatomedin B domain; HBD: heparin-binding domain; NEAT: near iron transporter domain. Orange boxes are the hemopexin-like domains, predicted as putative haem-binding motifs in Vn. (B) Bacterial adhesion to Vn increases with fluid shear stress. Optical microscopy images of WT and ΔisdB bacteria adhering to Vn-coated surfaces in a microparallel flow chamber, under low and high shear stress. Shown in (C) is the quantification of the amounts of adhering bacteria (from a total of 6 images from 3 experiments for each condition).
Fig. 2
Fig. 2. Adhesion forces between single bacteria and Vn-substrates. Maximum adhesion force (left) and rupture length (right) histograms with representative retraction force profiles (right insets) obtained by recording force–distance curves in PBS, at a retraction speed of 1 μm s−1 (∼2 × 10⁴ pN s−1), between three (A) WT and (B) ΔisdB S. aureus cells and Vn substrates (n = 599 and n = 220 adhesive curves for WT and mutant cells respectively). Percentages shown in the upper left corner of each histogram corresponds to the non-adhesive events. Left insets represent schemes of the single-cell force spectroscopy setup.
Fig. 3
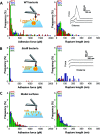
Fig. 3. Strength of single IsdB–Vn interactions. Maximum adhesion force (left) and rupture length (right) histograms obtained by recording force–distance curves in PBS, at a retraction speed of 1 μm s−1 (∼2 × 10⁴ pN s−1), between three different WT (A) or ΔisdB (B) S. aureus cells and AFM tips functionalized with Vn, along with representative retraction force profiles (right insets) (n = 357 and n = 64 adhesive curves for WT and mutant cells respectively). Left insets represent schemes of the single-molecule force spectroscopy setup. (C) Same force and rupture length histograms obtained, on three independent samples, between AFM tips functionalized with Vn and IsdB-coated substrates (n = 310 adhesive curves). Percentages shown in the upper left corner of each histogram corresponds to the non-adhesive events.
Fig. 4
Fig. 4. Comparison of single-cell and single-molecule measurements. (A and B) Box plots showing the adhesion probability of WT and ΔisdB cells to Vn, obtained on N independent cells, in single-cell (SCFS) and single-molecule (SMFS) force spectroscopy respectively. (C) Mean adhesion forces reported in both the low (F < 500 pN) and high (F > 500 pN) force regimes. Stars are the mean values, boxes the 25–75% quartiles and whiskers the SD. For statistical differences, based on Student t-tests: *p ≤ 0.05 and ns is no significant difference. (D) Probability of observing the low and high forces both in SCFS and SMFS.
Fig. 5
Fig. 5. Physical stress strengthens the IsdB–Vn interaction. (A) Dynamic force spectroscopy data showing the adhesion forces for IsdB–Vn interactions measured at increasing LRs on WT S. aureus cells (n = 2666 data points from 6 independent cells). (B) Force distributions plotted as histograms depending on two ranges of LRs, suggesting that the probability of forming strong bonds increases with the LR. (C) Plot of the spring constants of the molecular complex (km) as a function of adhesion force.

References

    1. Byrd A. L. Belkaid Y. Segre J. A. Nat. Rev. Microbiol. 2018;16:143–155. doi: 10.1038/nrmicro.2017.157. - DOI - PubMed
    1. Parlet C. P. Brown M. M. Horswill A. R. Trends Microbiol. 2019;27:497–507. doi: 10.1016/j.tim.2019.01.008. - DOI - PMC - PubMed
    1. Angus D. C. van der Poll T. N. Engl. J. Med. 2013;369:840–851. doi: 10.1056/NEJMra1208623. - DOI - PubMed
    1. Thomer L. Schneewind O. Missiakas D. Annu. Rev. Pathol.: Mech. Dis. 2016;11:343–364. doi: 10.1146/annurev-pathol-012615-044351. - DOI - PMC - PubMed
    1. Moreillon P. Que Y.-A. Lancet. 2004;363:139–149. doi: 10.1016/S0140-6736(03)15266-X. - DOI - PubMed