

doi: 10.1039/c9na00567f.
eCollection 2020 Dec 15.
Formation of gadolinium-ferritin from clinical magnetic resonance contrast agents
Affiliations
- PMID: 36133872
- PMCID: PMC9417687
- DOI: 10.1039/c9na00567f
Item in Clipboard
Formation of gadolinium-ferritin from clinical magnetic resonance contrast agents
Nanoscale Adv.
.
Abstract
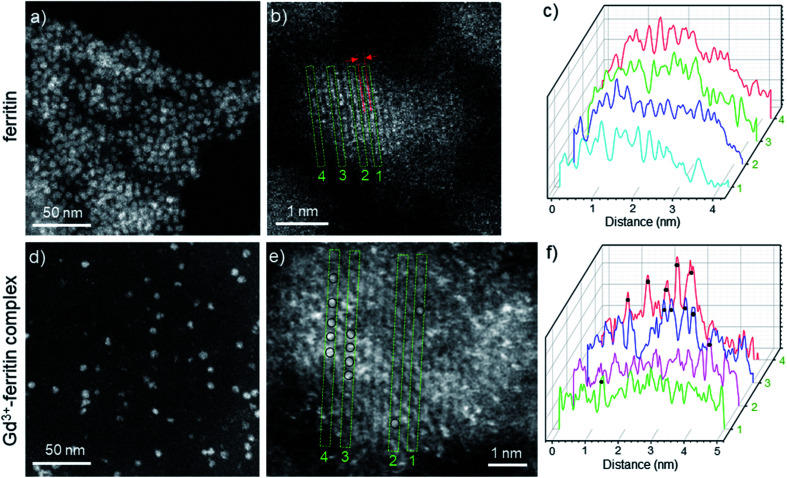
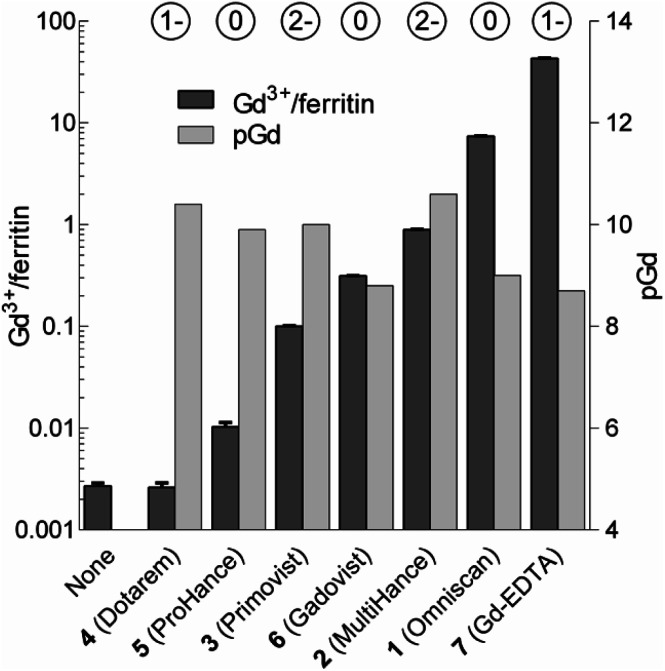
Gadolinium deposition in the brain following administration of gadolinium-based contrast agents (GBCAs) has led to health concerns. We show that some clinical GBCAs form Gd3+-ferritin nanoparticles at (sub)nanomolar concentrations of Gd3+ under physiological conditions. We describe their structure at atomic resolution and discuss potential relevance for clinical MRI.
This journal is © The Royal Society of Chemistry.
Conflict of interest statement
J. V. is a consultant for Novocure Inc. and Bracco Inc.
Figures

References
-
- Idée J.-M. Fretellier N. Robic C. Corot C. Crit. Rev. Toxicol. 2014;44:895–913. - PubMed
-
- Kanda T. Fukusato T. Matsuda M. Toyoda K. Oba H. Kotoku J. Haruyama T. Kitajima K. Furui S. Radiology. 2015;276:228–232. - PubMed
-
- Kanda T. Ishii K. Kawaguchi H. Kitajima K. Takenaka D. Radiology. 2013;270:834–841. - PubMed
-
- Renz D. M. Kümpel S. Böttcher J. Pfeil A. Streitparth F. Waginger M. Reichenbach J. R. Teichgräber U. K. Mentzel H.-J. Invest. Radiol. 2018;53:119–127. - PubMed
LinkOut - more resources
Full Text Sources