Clinical Trial
. 2022 Sep 22;7(18):e161498.
doi: 10.1172/jci.insight.161498.

Exercise restores brain insulin sensitivity in sedentary adults who are overweight and obese

Affiliations
Clinical Trial

Exercise restores brain insulin sensitivity in sedentary adults who are overweight and obese

Stephanie Kullmann et al. JCI Insight. .

Abstract

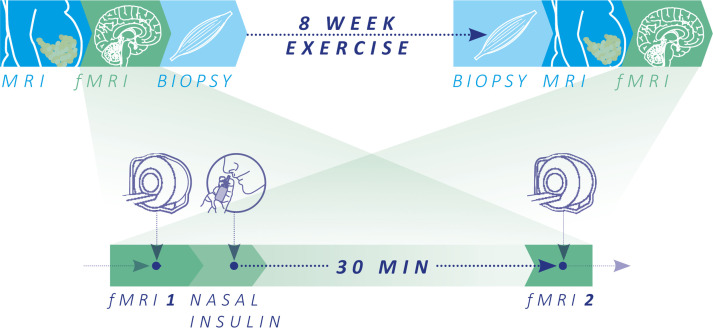
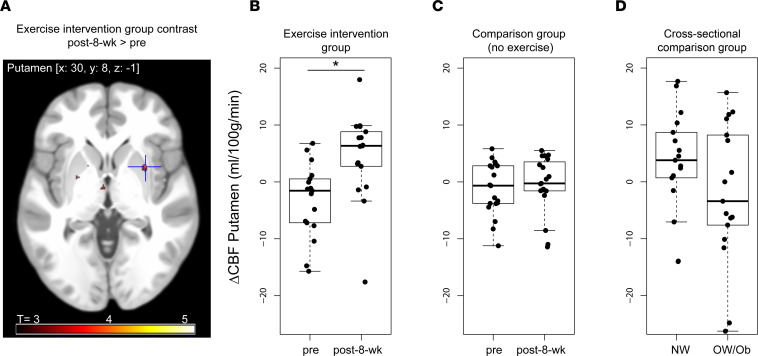
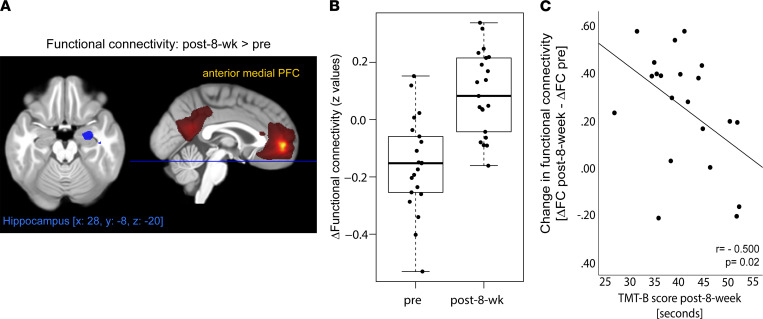
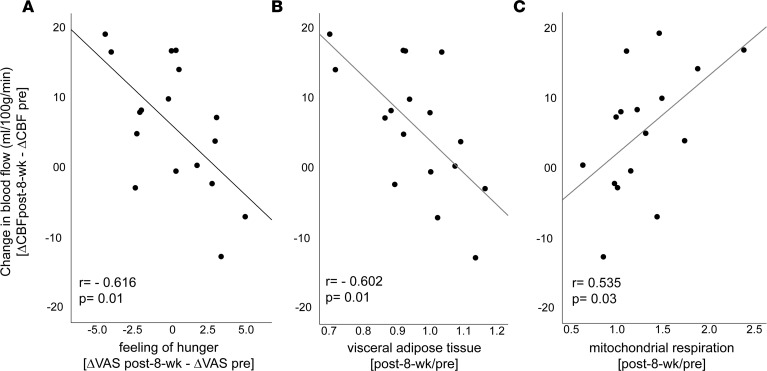
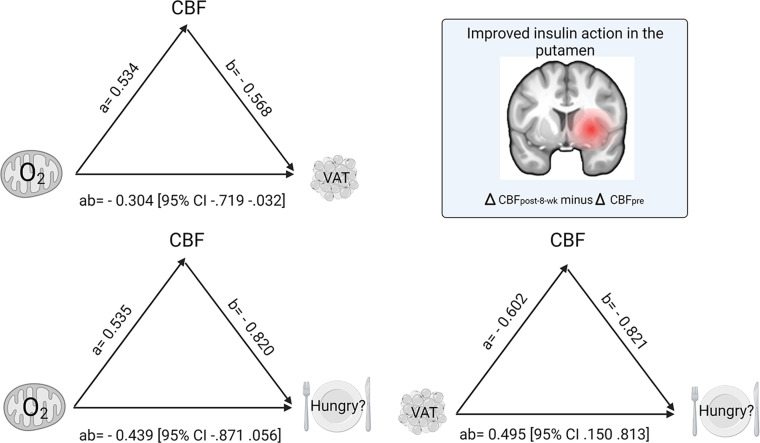
BACKGROUNDInsulin resistance of the brain can unfavorably affect long-term weight maintenance and body fat distribution. Little is known if and how brain insulin sensitivity can be restored in humans. We aimed to evaluate the effects of an exercise intervention on insulin sensitivity of the brain and how this relates to exercise-induced changes in whole-body metabolism and behavior.METHODSIn this clinical trial, sedentary participants who were overweight and obese underwent an 8-week supervised aerobic training intervention. Brain insulin sensitivity was assessed in 21 participants (14 women, 7 men; age range 21-59 years; BMI range 27.5-45.5 kg/m2) using functional MRI, combined with intranasal administration of insulin, before and after the intervention.RESULTSThe exercise program resulted in enhanced brain insulin action to the level of a person of healthy weight, demonstrated by increased insulin-induced striatal activity and strengthened hippocampal functional connectivity. Improved brain insulin action correlated with increased mitochondrial respiration in skeletal muscle, reductions in visceral fat and hunger, as well as improved cognition. Mediation analyses suggest that improved brain insulin responsiveness helps mediate the peripheral exercise effects leading to healthier body fat distribution and reduced perception of hunger.CONCLUSIONOur study demonstrates that an 8-week exercise intervention in sedentary individuals can restore insulin action in the brain. Hence, the ameliorating benefits of exercise toward brain insulin resistance may provide an objective therapeutic target in humans in the challenge to reduce diabetes risk factors.TRIAL REGISTRATIONClinicalTrials.gov (NCT03151590).FUNDINGBMBF/DZD 01GI0925.

Keywords: Adipose tissue; Insulin signaling; Metabolism; Neuroimaging; Neuroscience.


Conflict of interest statement

Conflict of interest: The authors have declared that no conflict of interest exists.

Figures

Figure 1
Figure 1. Schematic overview of the study and major test procedures.
Whole-body MRI and functional MRI (fMRI) of the brain and skeletal muscle biopsies were acquired on 3 separate days before and after the 8-week exercise intervention. fMRI was assessed following overnight fasting (10 hours minimum) to investigate brain insulin action using cerebral blood flow (CBF) and functional connectivity (FC) in the fasted state (fMRI-1) and 30 minutes after nasal insulin spray application (fMRI-2). To quantify brain insulin action, ΔCBF and ΔFC were calculated (fMRI-2 – fMRI-1).
Figure 2
Figure 2. Increased brain insulin action after an 8-week exercise intervention in the putamen.
(A) Image shows cluster in the putamen with an increase in cerebral blood flow from before to after the exercise intervention. Color map corresponds to T values (P < 0.001 uncorrected for display). (BD) Box plots show change in absolute cerebral blood flow in the right putamen from before to after insulin nasal spray (ΔCBF= fMRI-2 – fMRI-1). (B) Before and after 8-week exercise intervention in overweight and obese individuals (n = 18; PFWE < 0.05). C and D are based on previously published data sets serving as comparison groups. Before and after 8 weeks without exercise intervention, after oral placebo intake (n = 19) (50) (C), and cross-sectionally in healthy weight (n = 17) and overweight/obese (n = 17) individuals at a single time point (13) (D). In the plot, the box indicates the first and third quartile (25th and 75th percentile), the line in the box marks the median, and whiskers above and below indicate 1.5 × interquartile range. CBF, cerebral blood flow. *PFWE < 0.05 SVC.
Figure 3
Figure 3. Improved brain insulin action after an 8-week exercise intervention in the right hippocampus.
(A) Image shows cluster (in blue) in the right hippocampus with an increase in functional connectivity to the anterior medial prefrontal cortex (region in yellow) of the default mode network from before to after the exercise intervention (PFWE < 0.05 SVC). Color map in red to yellow corresponds to group averaged default mode network at fMRI-1 (t test, PFWE < 0.05). (B) Box plot shows change in functional connectivity between the right hippocampus and medial prefrontal cortex from before to after insulin nasal spray (fMRI-2 – fMRI-1) before and after 8-week exercise intervention (n = 21; PFWE < 0.05). (C) Change in brain insulin action after an 8-week exercise intervention associates with cognitive function. The y axis displays the change in insulin action from before to after the exercise intervention (ΔFCpost-8-week– ΔFCpre), and the x axis shows the TMT B score in seconds.
Figure 4
Figure 4. Change in brain insulin action after an 8-week exercise intervention associates with hunger ratings and metabolic measures.
(A) The y axis displays the change in right putamen blood flow in response to intranasal insulin from before to after the exercise intervention (ΔCBFpost-8-week – ΔCBFpre). The x axis shows the change in hunger ratings in response to intranasal insulin (ΔVASpost-8-week – ΔVASpre). (B) The fold change of visceral adipose tissue from before to after the 8-week exercise intervention. (C) The fold change of maximal coupled skeletal muscle mitochondrial respiration in skeletal muscle fibers from before to after the 8-week exercise intervention. CBF, cerebral blood flow; VAS, visual analogue scale.
Figure 5
Figure 5. Model of exercise-promoted central insulin action as a mediator between changes in peripheral metabolism and central insulin modulated feeling of hunger from before to after an 8-week exercise intervention.
Path coefficients and CIs are shown next to arrows. All variables relate to changes from before to after the 8-week exercise intervention. Brain template at the top right of the graph shows region in the striatum (i.e., right putamen), revealing a significant exercise-induced increase in central insulin action (ΔCBFpost-8-week – ΔCBF pre). In the model on the top left, path ab indicates the indirect effect of the change in maximal coupled mitochondrial respiration in skeletal muscle fibers on the change in VAT via the exercise-induced change in putamen insulin action. In the model on the bottom left, path ab indicates the indirect effect of the change in maximal coupled mitochondrial respiration in skeletal muscle fibers on the change in hunger (ΔVASpost-8-week – ΔVASpre) via the exercise-induced change in right putamen insulin action. In the model on the bottom right, path ab indicates the indirect effect of the change in VAT on hunger via the exercise-induced change in putamen insulin action. CBF, cerebral blood flow; O2, oxygen flux for mitochondrial respiration; VAS, visual analogue scale for hunger ratings; VAT, visceral adipose tissue.

References

    1. DeFronzo RA, et al. Type 2 diabetes mellitus. Nat Rev Dis Primers. 2015;1:15019. doi: 10.1038/nrdp.2015.19. - DOI - PubMed
    1. Kullmann S, et al. Central nervous pathways of insulin action in the control of metabolism and food intake. Lancet Diabetes Endocrinol. 2020;8(6):524–534. doi: 10.1016/S2213-8587(20)30113-3. - DOI - PubMed
    1. Koch L, et al. Central insulin action regulates peripheral glucose and fat metabolism in mice. J Clin Invest. 2008;118(6):2132–2147. doi: 10.1172/JCI31073. - DOI - PMC - PubMed
    1. Bruning JC, et al. Role of brain insulin receptor in control of body weight and reproduction. Science. 2000;289(5487):2122–2125. doi: 10.1126/science.289.5487.2122. - DOI - PubMed
    1. Hill JM, et al. Autoradiographic localization of insulin receptors in rat brain: prominence in olfactory and limbic areas. Neuroscience. 1986;17(4):1127–1138. doi: 10.1016/0306-4522(86)90082-5. - DOI - PubMed

Publication types

Associated data