. 2022 Sep 22;7(18):e160348.
doi: 10.1172/jci.insight.160348.

A gut-oral microbiome-driven axis controls oropharyngeal candidiasis through retinoic acid

Affiliations

A gut-oral microbiome-driven axis controls oropharyngeal candidiasis through retinoic acid

Felix Ey Aggor et al. JCI Insight. .

Abstract

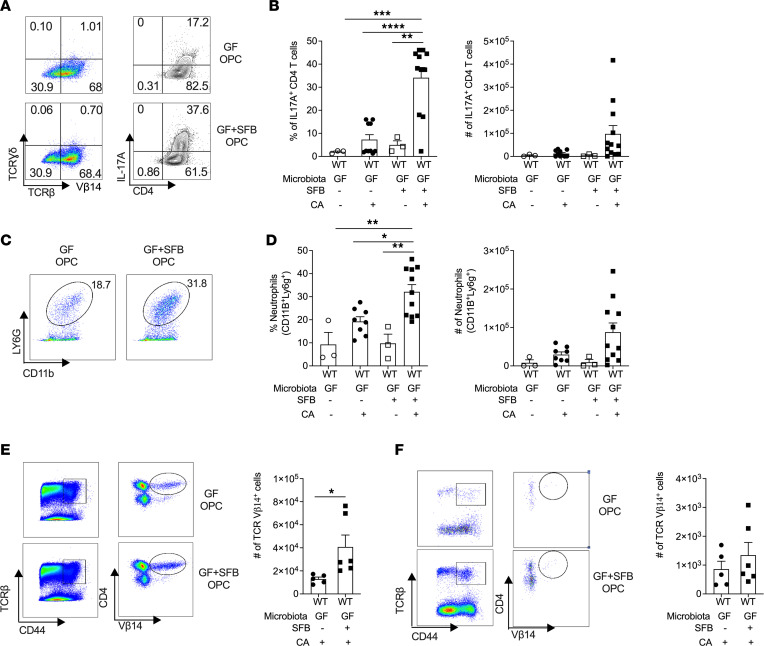
A side effect of antibiotics is outgrowth of the opportunistic fungus Candida albicans in the oropharynx (oropharyngeal candidiasis, OPC). IL-17 signaling is vital for immunity to OPC, but how the microbiome impacts antifungal immunity is not well understood. Mice in standard specific pathogen-free (SPF) conditions are resistant to OPC, whereas we show that germ-free (GF) or antibiotic-treated mice are susceptible. Oral type 17 cells and IL-17-dependent responses were impaired in antibiotic-treated and GF mice. Susceptibility could be rescued in GF mice by mono-colonization with segmented filamentous bacterium (SFB), an intestine-specific constituent of the microbiota. SFB protection was accompanied by restoration of oral IL-17+CD4+ T cells and gene signatures characteristic of IL-17 signaling. Additionally, RNA-Seq revealed induction of genes in the retinoic acid (RA) and RA receptor-α (RARα) pathway. Administration of RA rescued immunity to OPC in microbiome-depleted or GF mice, while RAR inhibition caused susceptibility in immunocompetent animals. Surprisingly, immunity to OPC was independent of serum amyloids. Moreover, RAR inhibition did not alter oral type 17 cytokine levels. Thus, mono-colonization with a component of the intestinal microflora confers protection against OPC by type 17 and RA/RARα, which act in parallel to promote antifungal immunity. In principle, manipulation of the microbiome could be harnessed to maintain antifungal immunity.

Keywords: Cytokines; Fungal infections; Immunology.


Conflict of interest statement

Conflict of interest: The authors have declared that no conflict of interest exists.

Figures

Figure 1
Figure 1. Microbiome depletion impairs type 17 responses in OPC.
(A and B) WT mice in SPF conditions (WT-SPF), ages 6–9 weeks, both sexes, were treated with or without antibiotics in drinking water for 7 days and infected orally by a 75-minute sublingual exposure to C. albicans or PBS (n = 9–12 mice/group). RNA from whole tongue prepared at day 2 p.i. was subjected to quantitative PCR (qPCR) for the indicated genes normalized to Gapdh. Graphs show mean ± SEM. Data are pooled from 2 independent experiments. Mice were infected and on day 2 p.i. tongue homogenates were analyzed by flow cytometry to assess (C) IL-17A production (CD4+IL17A+, gated on live CD45+ cells) and (D) neutrophils (CD11b+Ly6G+ gated on live CD45+ cells). (E) Mice were infected as in A, and on day 5 p.i. fungal burdens were assessed in tongue homogenates by plating and CFU enumeration. Graphs show geometric mean ± SD. Dashed line indicates limit of detection. Data were pooled from 2 independent experiments. (F) Mice treated as in A were administered recombinant IL-17A and IL-22 i.p. Fungal burdens were assessed at day 5. Dashed line indicates limit of detection. Data were pooled from 2 independent experiments. Data analyzed by ANOVA with Tukey’s multiple comparisons test (AD) or Mann-Whitney U test (E and F). *P < 0.05, ** < 0.01, *** < 0.001, **** < 0.0001.
Figure 2
Figure 2. Mono-colonization with SFB induces protective responses to oral candidiasis in GF mice.
(A) The indicated mice (SPF or GF) were gavaged with SFB or PBS. After 14 days, mice were infected orally with C. albicans and fungal burdens assessed at day 5 by plating and CFU enumeration. n = 4–15 mice/group. Left: Geometric mean ± SD and analyzed by ANOVA and Tukey’s multiple comparisons test. Data pooled from 3 experiments. Right: Percentage clearance (number of mice with detectable fungal load/total mice). (B) WT-SPF mice were treated with antibiotics in drinking water or left untreated for 7 days. Fecal SFB content was analyzed by qPCR and normalized against total fecal bacterial content. Data from 1 experiment. (C and D) RNA from whole tongue at day 2 p.i. was subjected to qPCR for the indicated genes. Graphs show mean ± SEM and data were analyzed by ANOVA and Tukey’s multiple comparisons test. Data pooled from 2 experiments. *P < 0.05, ** < 0.01, *** < 0.001, **** < 0.0001.
Figure 3
Figure 3. SFB mono-colonization in OPC triggers Th17 expansion and neutrophil recruitment.
WT-GF mice were gavaged with PBS or SFB for 14 days followed by sublingual inoculation with C. albicans. Tongue homogenates were prepared at day 2 p.i., and (A and B) CD45+ cells were stained for TCRγδ, TCRβ, CD4, and intracellular IL-17A. (A) Representative FACS plot showing CD45+CD4+IL-17A+ cells. (B) Percentages and total numbers of CD4+IL-17A+ T cells. (C) Representative FACS plot showing CD45+CD11b+Ly6G+ cells. (D) Percentage and number of neutrophils. (E and F) CD45+ cells were stained for TCRβ, CD44, CD4, and Vβ14. Left: Representative FACS plot showing TCRβ+CD44+CD4+TCR Vβ14+ cells. Right: Total numbers of TCRβ+CD44+CD4+TCR Vβ14+ cells. Data from 1 experiment, n = 5–6. Graphs show mean ± SEM and data were analyzed by Student’s t test or ANOVA and Tukey’s multiple comparisons test. *P < 0.05, ** < 0.01, *** < 0.001, **** < 0.0001.
Figure 4
Figure 4. SFB mono-colonization modulates oral transcriptional responses during OPC.
Whole tongue mRNA from GF and SFB–mono-colonized mice infected orally with C. albicans was harvested at day 2 p.i. and subjected to RNA-Seq analysis. (A) Volcano plot of transcriptional changes in sham (uninfected) GF versus sham (uninfected) SFB–mono-colonized mice at baseline. (B) Gene expression was normalized between GF-OPC and GF-Sham mice and SFB-OPC and SFB-Sham mice, respectively. Venn diagram of differentially regulated genes in C. albicans–infected SFB–mono-colonized versus GF mice. LFC, log fold change. (C) g:Profiler analysis of the top 15 GO biological processes inferred from differentially regulated genes in groups 1 and 2 (from B). (D) Heatmap of type 17 pathway genes in SFB-OPC versus GF-OPC groups normalized against their respective sham controls. (E) Heatmap of genes in epithelial repair and keratinization pathways in SFB-OPC versus GF-OPC groups normalized against their respective sham controls.
Figure 5
Figure 5. The RA pathway is induced by SFB mono-colonization and promotes immunity to OPC.
(A) Heatmap showing selected genes in the RA/RAR pathway comparing GF-OPC and SFB-OPC mouse groups normalized to respective sham controls. (B) WT-SPF mice were given Abx for 7 days and infected orally with C. albicans. Mice were administered RA or vehicle i.p. starting day –6 relative to infection until day 5 p.i. Fungal burdens were assessed by plating and CFU enumeration. Data are from 2 independent experiments. Graphs show geometric mean ± SD analyzed by Mann-Whitney U test. (C) GF mice were administered RA or vehicle by oral gavage on alternating days starting day –6 until day 5 p.i. Fungal burdens were assessed by plating and CFU enumeration. Data are from 2 independent experiments. Graphs show geometric mean ± SD analyzed by Mann-Whitney U test. (D) WT-SPF mice were treated with Abx 7 days. Mice were administered RA or vehicle i.p. starting on day –6 until day 2 p.i. RNA from whole tongue at day 2 p.i. was analyzed by qPCR for indicated genes normalized to Gapdh. Graphs show mean ± SEM analyzed by ANOVA and Tukey’s multiple comparisons test. (E) WT-SPF mice were infected orally with C. albicans for 2 days. Tongue cryosections were stained for DAPI, K14, and RARα. Data representative of 3–5 mice per group. (F) WT-SPF mice were treated with RAR inhibitor (RARI; BMS493) or vehicle. Fungal burdens were assessed by plating and CFU enumeration. Graphs show geometric mean ± SD, analyzed by Mann-Whitney U test. Data pooled from 2 experiments. (G) WT-SPF mice were administered RARI or vehicle and infected orally with C. albicans. RNA from whole tongue at day 2 p.i. was subjected to qPCR for the indicated genes normalized to Gapdh. Graphs show mean ± SEM, analyzed by ANOVA and Tukey’s multiple comparisons test. Data pooled from 2 experiments. *P < 0.05, ** < 0.01, *** < 0.001, **** < 0.0001.

References

    1. Fidel PL, Jr Candida-host interactions in HIV disease: implications for oropharyngeal candidiasis. Adv Dent Res. 2011;23(1):45–49. doi: 10.1177/0022034511399284. - DOI - PMC - PubMed
    1. Lionakis MS, Levitz SM. Host control of fungal infections: lessons from basic studies and human cohorts. Annu Rev Immunol. 2018;36:157–191. doi: 10.1146/annurev-immunol-042617-053318. - DOI - PubMed
    1. Delsing CE, et al. Association of esophageal candidiasis and squamous cell carcinoma. Med Mycol Case Rep. 2012;1(1):5–8. doi: 10.1016/j.mmcr.2012.02.003. - DOI - PMC - PubMed
    1. Zhu F, et al. Autoreactive T cells and chronic fungal infection drive esophageal carcinogenesis. Cell Host Microbe. 2017;21(4):478–493. doi: 10.1016/j.chom.2017.03.006. - DOI - PMC - PubMed
    1. Lanternier F, et al. Primary immunodeficiencies underlying fungal infections. Curr Opin Pediatr. 2013;25(6):736–747. doi: 10.1097/MOP.0000000000000031. - DOI - PMC - PubMed

Publication types