

In Silico Identification and Validation of Cuproptosis-Related LncRNA Signature as a Novel Prognostic Model and Immune Function Analysis in Colon Adenocarcinoma
- PMID: 36135086
- PMCID: PMC9497598
- DOI: 10.3390/curroncol29090517
In Silico Identification and Validation of Cuproptosis-Related LncRNA Signature as a Novel Prognostic Model and Immune Function Analysis in Colon Adenocarcinoma
Abstract
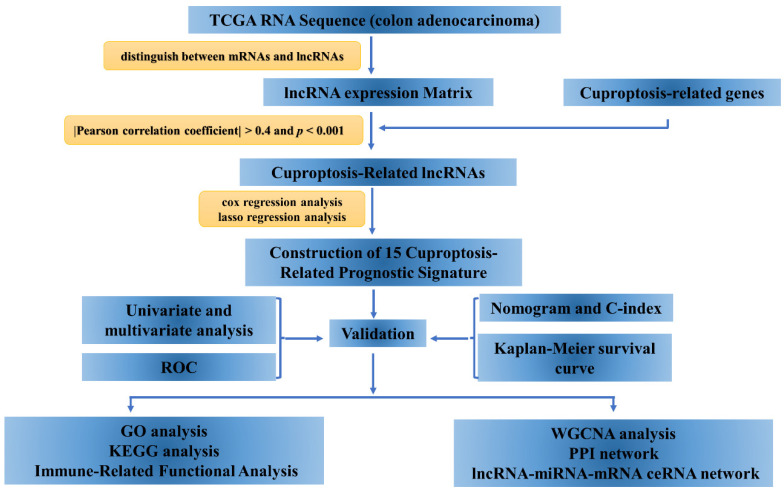
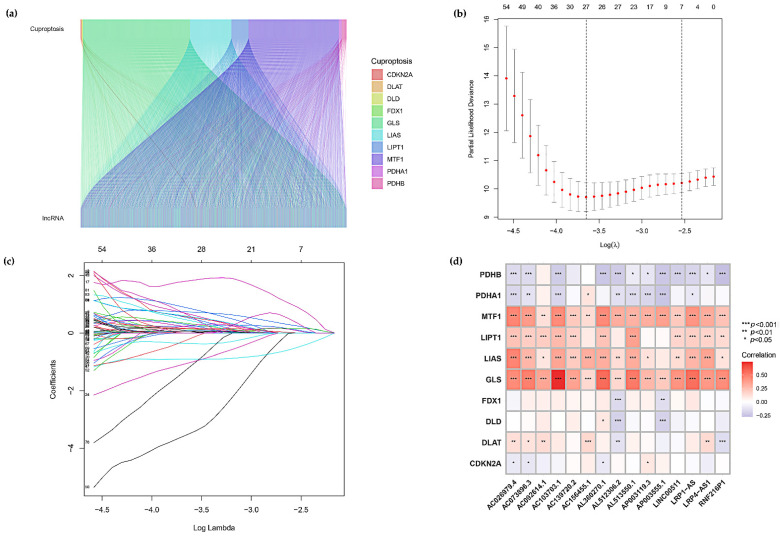
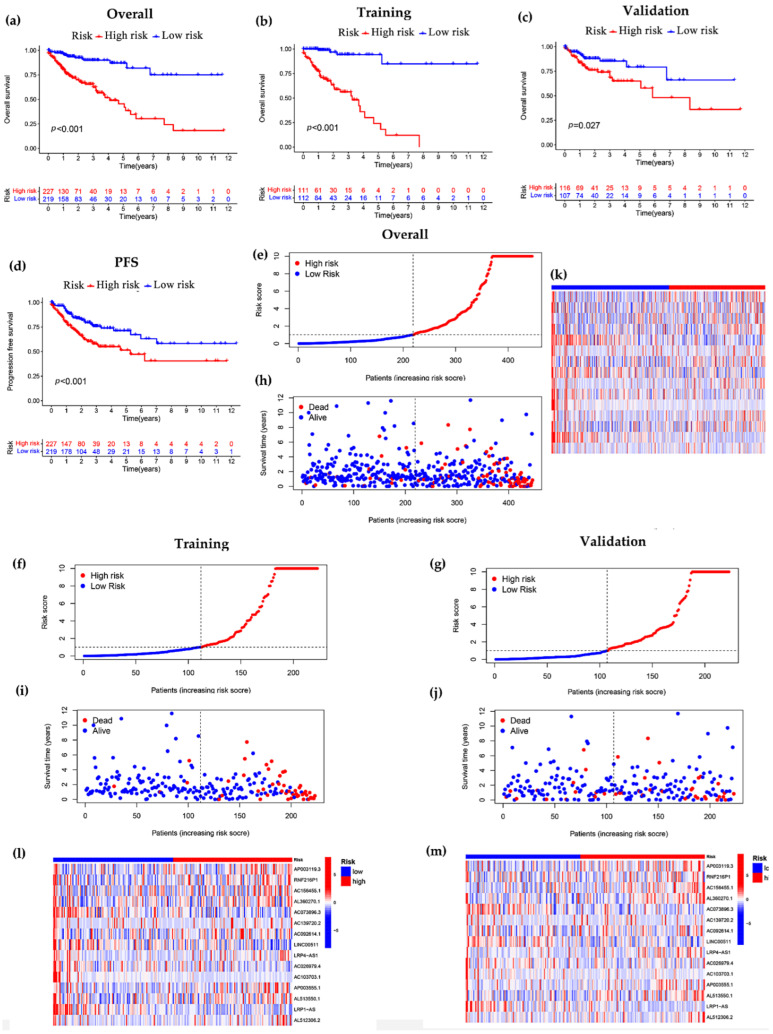
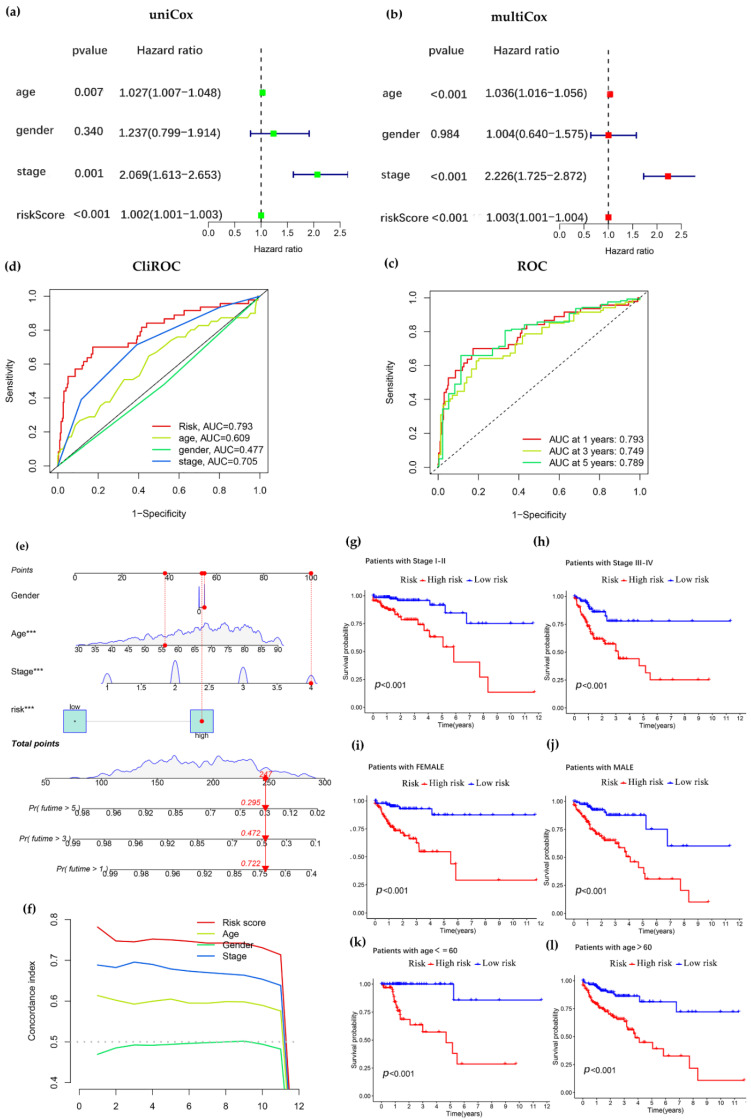
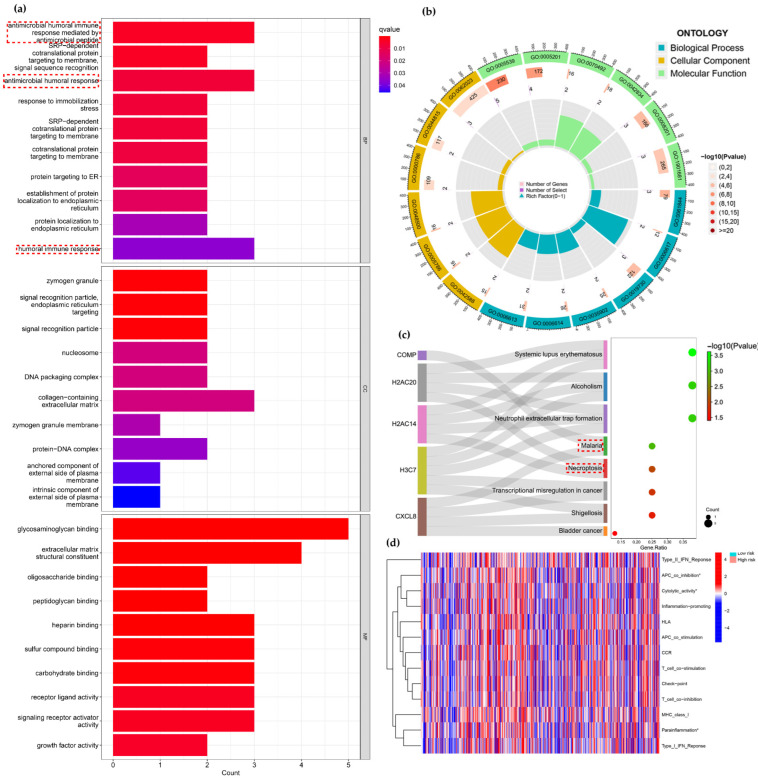
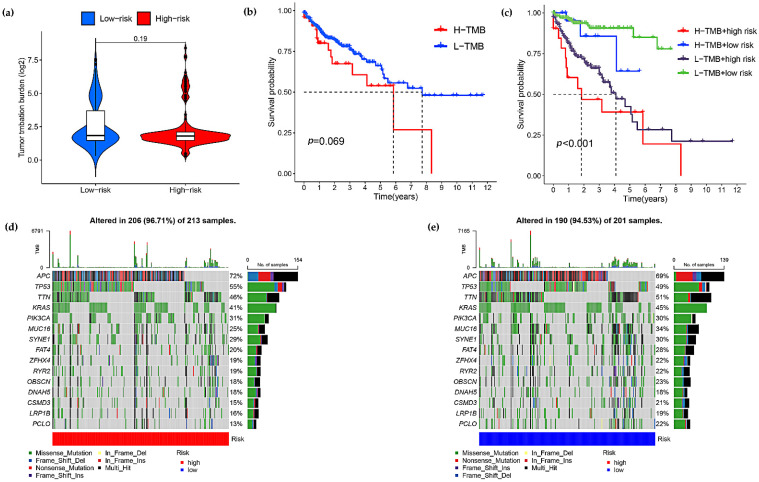
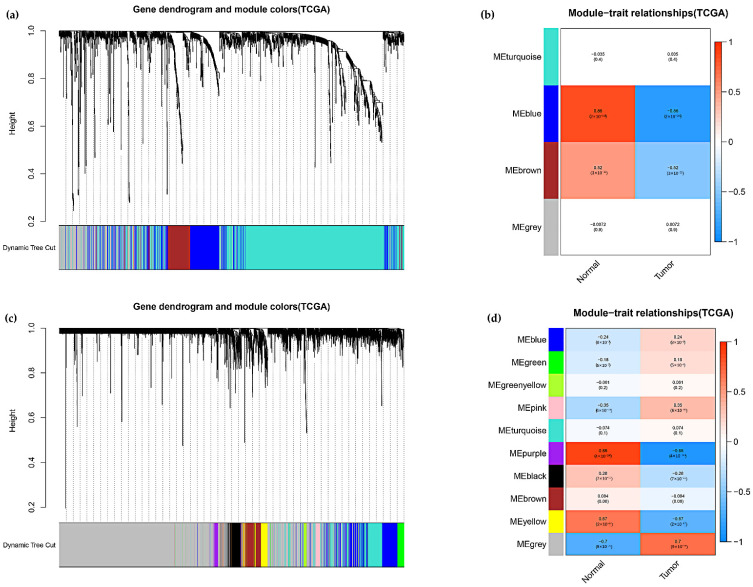
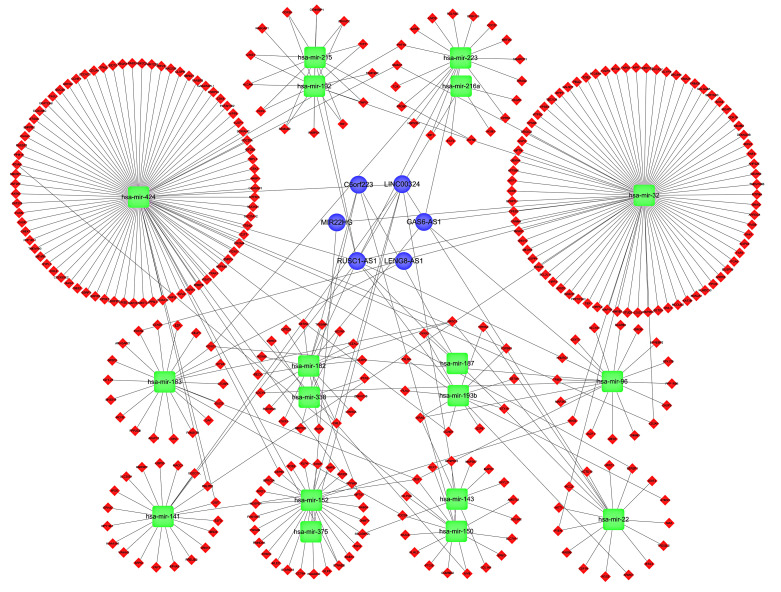
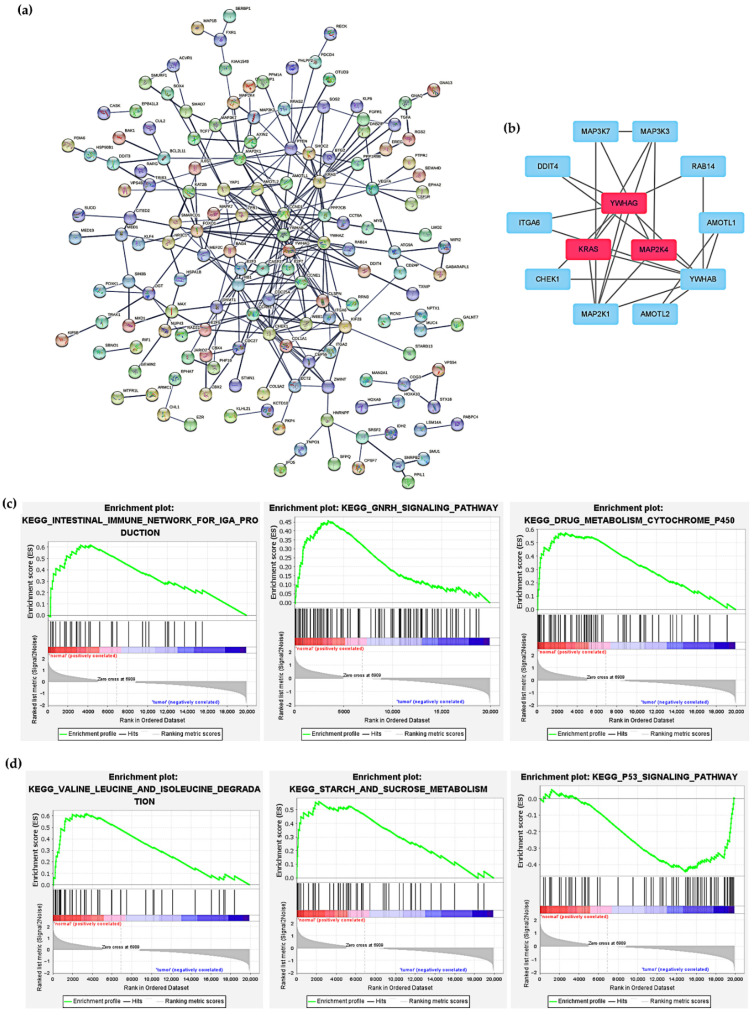
Background: Colon adenocarcinoma (COAD) is the most common subtype of colon cancer, and cuproptosis is a recently newly defined form of cell death that plays an important role in the development of several malignant cancers. However, studies of cuproptosis-related lncRNAs (CRLs) involved in regulating colon adenocarcinoma are limited. The purpose of this study is to develop a new prognostic CRLs signature of colon adenocarcinoma and explore its underlying biological mechanism. Methods: In this study, we downloaded RNA-seq profiles, clinical data and tumor mutational burden (TMB) data from the TCGA database, identified cuproptosis-associated lncRNAs using univariate Cox, lasso regression analysis and multivariate Cox analysis, and constructed a prognostic model with risk score based on these lncRNAs. COAD patients were divided into high- and low-risk subgroups based on the risk score. Cox regression was also used to test whether they were independent prognostic factors. The accuracy of this prognostic model was further validated by receiver operating characteristic curve (ROC), C-index and Nomogram. In addition, the lncRNA/miRNA/mRNA competing endogenous RNA (ceRNA) network and protein−protein interaction (PPI) network were constructed based on the weighted gene co-expression network analysis (WGCNA). Results: We constructed a prognostic model based on 15 cuproptosis-associated lncRNAs. The validation results showed that the risk score of the model (HR = 1.003, 95% CI = 1.001−1.004; p < 0.001) could serve as an independent prognostic factor with accurate and credible predictive power. The risk score had the highest AUC (0.793) among various factors such as risk score, stage, gender and age, also indicating that the model we constructed to predict patient survival was better than other clinical characteristics. Meanwhile, the possible biological mechanisms of colon adenocarcinoma were explored based on the lncRNA/miRNA/mRNA ceRNA network and PPI network constructed by WGCNA. Conclusion: The prognostic model based on 15 cuproptosis-related lncRNAs has accurate and reliable predictive power to effectively predict clinical outcomes in colon adenocarcinoma patients.
Keywords: colon adenocarcinoma; cuproptosis; lncRNA; prognostic model.
Conflict of interest statement
The authors declare no conflict of interest.
Figures
Similar articles
-
Construction and validation of a cuproptosis-related lncRNA signature as a novel and robust prognostic model for colon adenocarcinoma.Front Oncol. 2022 Jul 28;12:961213. doi: 10.3389/fonc.2022.961213. eCollection 2022. Front Oncol. 2022. PMID: 35965536 Free PMC article.
-
Identification of a PANoptosis-related long noncoding rna risk signature for prognosis and immunology in colon adenocarcinoma.BMC Cancer. 2025 Apr 10;25(1):662. doi: 10.1186/s12885-025-14021-2. BMC Cancer. 2025. PMID: 40211224 Free PMC article.
-
Identification of a pyroptosis-related lncRNA risk model for predicting prognosis and immune response in colon adenocarcinoma.World J Surg Oncol. 2022 Apr 12;20(1):118. doi: 10.1186/s12957-022-02572-8. World J Surg Oncol. 2022. PMID: 35413978 Free PMC article.
-
A novel prognostic signature for lung adenocarcinoma based on cuproptosis-related lncRNAs: A Review.Medicine (Baltimore). 2022 Dec 9;101(49):e31924. doi: 10.1097/MD.0000000000031924. Medicine (Baltimore). 2022. PMID: 36626411 Free PMC article. Review.
-
lncRNAs as prognostic markers and therapeutic targets in cuproptosis-mediated cancer.Clin Exp Med. 2024 Sep 26;24(1):226. doi: 10.1007/s10238-024-01491-0. Clin Exp Med. 2024. PMID: 39325172 Free PMC article. Review.
Cited by
-
Construction and validation of a novel lysosomal signature for hepatocellular carcinoma prognosis, diagnosis, and therapeutic decision-making.Sci Rep. 2023 Dec 18;13(1):22624. doi: 10.1038/s41598-023-49985-3. Sci Rep. 2023. PMID: 38114725 Free PMC article.
-
Subtype cluster analysis unveiled the correlation between m6A- and cuproptosis-related lncRNAs and the prognosis, immune microenvironment, and treatment sensitivity of esophageal cancer.Front Immunol. 2025 Feb 17;16:1539630. doi: 10.3389/fimmu.2025.1539630. eCollection 2025. Front Immunol. 2025. PMID: 40034693 Free PMC article.
-
High expression levels of S1PR3 and PDGFRB indicates unfavorable clinical outcomes in colon adenocarcinoma.Heliyon. 2024 Jul 31;10(15):e35532. doi: 10.1016/j.heliyon.2024.e35532. eCollection 2024 Aug 15. Heliyon. 2024. PMID: 39170287 Free PMC article.
-
Machine learning and bioinformatics-based insights into the potential targets of saponins in Paris polyphylla smith against non-small cell lung cancer.Front Genet. 2022 Oct 28;13:1005896. doi: 10.3389/fgene.2022.1005896. eCollection 2022. Front Genet. 2022. PMID: 36386821 Free PMC article.
-
Cuproptosis: mechanisms and links with cancers.Mol Cancer. 2023 Mar 7;22(1):46. doi: 10.1186/s12943-023-01732-y. Mol Cancer. 2023. PMID: 36882769 Free PMC article. Review.
References
-
- Pita-Fernández S., González-Sáez L., López-Calviño B., Seoane-Pillado T., Rodríguez-Camacho E., Pazos-Sierra A., González-Santamaría P., Pértega-Díaz S. Effect of diagnostic delay on survival in patients with colorectal cancer: A retrospective cohort study. BMC Cancer. 2016;16:664. doi: 10.1186/s12885-016-2717-z. - DOI - PMC - PubMed
Publication types
MeSH terms
Substances
LinkOut - more resources
Full Text Sources
