. 2022 Sep 1;11(9):17.
doi: 10.1167/tvst.11.9.17.

Biological Correlations and Confounders for Quantification of Retinal Ganglion Cells by Optical Coherence Tomography Based on Studies of Outbred Mice

Affiliations

Biological Correlations and Confounders for Quantification of Retinal Ganglion Cells by Optical Coherence Tomography Based on Studies of Outbred Mice

Adam Hedberg-Buenz et al. Transl Vis Sci Technol. .

Abstract

Purpose: Despite popularity of optical coherence tomography (OCT) in glaucoma studies, it's unclear how well OCT-derived metrics compare to traditional measures of retinal ganglion cell (RGC) abundance. Here, Diversity Outbred (J:DO) mice are used to directly compare ganglion cell complex (GCC) thickness measured by OCT to metrics of retinal anatomy measured ex vivo with retinal wholemounts and optic nerve histology.

Methods: J:DO mice (n = 48) underwent fundoscopic and OCT examinations, with automated segmentation of GCC thickness. RGC axons were quantified from para-phenylenediamine-stained optic nerve cross-sections and somas from BRN3A-immunolabeled retinal wholemounts, with total inner retinal cellularity assessed by TO-PRO and subsequent hematoxylin staining.

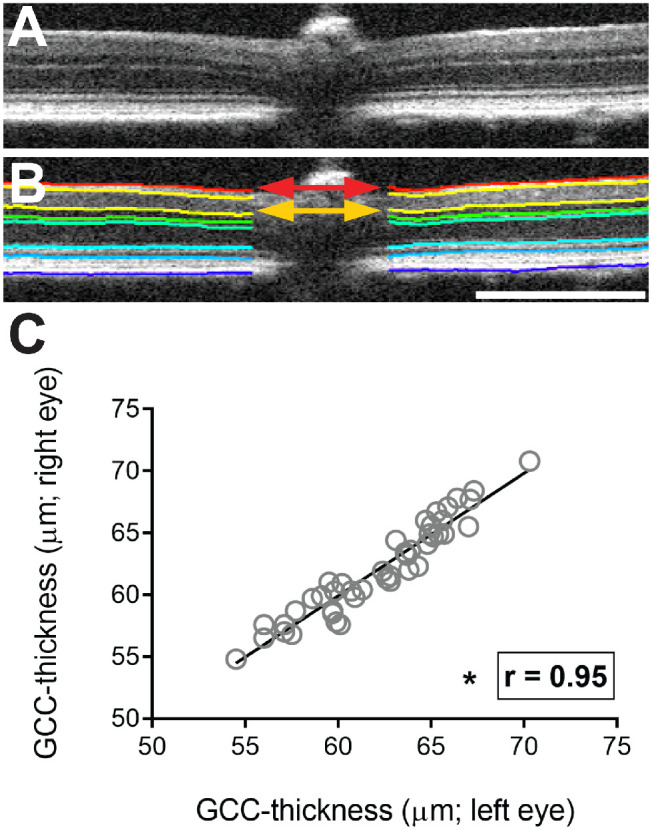
Results: J:DO tissues lacked overt disease. GCC thickness, RGC abundance, and total cell abundance varied broadly across individuals. GCC thickness correlated significantly to RGC somal density (r = 0.58) and axon number (r = 0.44), but not total cell density. Retinal area and nerve cross-sectional area varied widely. No metrics were significantly influenced by sex. In bilateral comparisons, GCC thickness (r = 0.95), axon (r = 0.72), and total cell density (r = 0.47) correlated significantly within individuals.

Conclusions: Amongst outbred mice, OCT-derived measurements of GCC thickness correlate significantly to RGC somal and axon abundance. Factors limiting correlation are likely both biological and methodological, including differences in retinal area that distort sampling-based estimates of RGC abundance.

Translational relevance: There are significant-but imperfect-correlations between GCC thickness and RGC abundance across genetic contexts in mice, highlighting valid uses and ongoing challenges for meaningful use of OCT-derived metrics.


Conflict of interest statement

Disclosure: A. Hedberg-Buenz, None; K.J. Meyer, None; C.J. van der Heide, None; W. Deng, None; K. Lee, None; D.A. Soukup, None; M. Kettelson, Digital Diagnostics, Inc. (E, I); D. Pellack, None; H. Mercer, None; K. Wang, None; M.K. Garvin, approach used to segment retinal layers (P); M.D. Abramoff, Digital Diagnostics Inc. (F, I, C, P); M.G. Anderson, None

Figures

Figure 1.
Figure 1.
Retinal ganglion cell complex thickness is variable across individual J:DO mice but conserved within individuals. Image scans from in vivo retinal scans obtained by OCT, were analyzed using custom algorithms to segment and quantify thickness of retinal layers, and specifically the retinal GCC. Correlation testing of GCC thickness between the left and right eyes of the same mouse within the study cohort of J:DO mice. A representative OCT image of retina in (A) raw and (B) analyzed form. After analysis of the raw image, the analyzed form contains inset lines to denote segmentation of the different layers (by differing color) within the retina. The GCC consists of the nerve fiber, ganglion cell, and inner plexiform layers combined, and its thickness is the sum of these layers (vertical distance between red and gold arrows). Scale bar: 0.5 mm. (C) Graph plotting thickness of the right versus left GCC, showing a strong correlation (r = 0.89) of GCC thickness between eyes of the same individual in a cohort of J:DO mice. Each dot represents mean GCC thickness of the right (y-axis) versus left (x-axis) eye from an individual J:DO mouse (n = 45 mice, 90 retinas), inset line represents the best-fit line, Pearson's correlation coefficient (r), and the asterisk represents a P < 0.05 using a two-tailed Student t-test.
Figure 2.
Figure 2.
Quantitative analyses of neuronal features in retinas and optic nerves from J:DO mice. Representative micrographs of stained wholemount retinas and optic nerve cross-sections collected from adult J:DO mice used in quantitative analyses of neuronal features. Images in raw format (first column, X0) are of native size and magnification, whereas those in analyzed format are magnified and cropped down to better enable visualization of the neuronal features, both before (second column, X1) and after (third column; features with inset contours or highlights, X2) analyses. Confocal micrographs acquired from the same microscopy field of retina (A0-2) immunolabeled with an antibody targeting an RGC-specific marker (BRN3A, in green) and (B0-2) counterstained with TO-PRO (nuclei, in blue). Light micrographs from a (C0-2) retina stained with hematoxylin and eosin (nuclei, violet; extracellular space, pink) and (D0-2) optic nerve stained with PPD (myelin sheath, black). Scale bars: 100 µm (A0–C0), 25 µm (A1,2-C1,2), 10 µm (D0), and 2 µm (D1,2). Graphs relating quantifications of (E) total nuclei density (cells/mm2; n = 22 mice) in the inner neural layers of retina and (F) axons (extrapolated number; n = 31 mice) in optic nerve between the left and right nerves of the same individual among the population of J:DO mice. Each dot represents data from both retinas or nerves of one mouse, inset line represents best-fit line, Pearson's correlation coefficient (r), and asterisks represent a P < 0.05 using a two-tailed Student t-test.
Figure 3.
Figure 3.
Relating cellular features to retinal structure in the ganglion cell complex of J:DO mice. Graphs relating how measurements of cellularity from retinal wholemounts relate to structural thickness by OCT of GCC thickness in adult J:DO mice. Dot plots showing the relationship between structural thickness of the GCC (y-axis) versus the overall cell density of all types residing in these layers, whether stained by (A) H&E (with analysis by RetFM-J) or (B) TO-PRO (with analyses using a custom macro for Image-J), (C) density of retinal ganglion cells (with BRN3A immunolabeling and analysis using a custom macro for Image-J), or (D) extrapolated axon number. Note that the relationship between GCC thickness and overall cell density is relatively poor and not statistically significant, whereas those with RGC density and axon number are stronger and achieve significance. Each dot represents data from both eyes or nerves (n = 47 for A and n = 48 for D) or from one eye (n = 27 for B and C) of one mouse, inset line represents best-fit line, Pearson's correlation coefficient (r), and asterisks represent P < 0.05 using a two-tailed Student t-test.
Figure 4.
Figure 4.
Relating cellular features in the ganglion cell complex to overall retinal area in J:DO mice. Image and graphical data relating how measurements of total area relate to cellular features collected from the same retinal wholemounts in adult J:DO mice. Representative light microscopy images of relatively (A) small and (B) large H&E-stained retinas collected from the J:DO cohort. Scale bar: 500 µm. (C) Graph showing the distribution of area measurements for all retinas (n = 49) included in the study. Each dot represents data from one retina, inset horizontal and vertical lines represent the mean ± SD area for all retinas, respectively. Dot plots relating the (D) density of TO-PRO+ nuclei and (E) density of BRN3A+ nuclei versus retinal area, respectively, and (F) density of BRN3A+ nuclei versus total axon number. Each dot represents data from the left eye/nerve pair from one mouse (n = 27 pairs for D; n = 28 pairs for E and F), inset solid and dotted lines represent the best-fit and 95% confidence interval, respectively, Pearson's correlation coefficient (r), and inset asterisk to represent a P < 0.05 using a two-tailed Student t-test.
Figure 5.
Figure 5.
Relating variability in axon number with optic nerve structure in J:DO mice. Light micrograph pairs of PPD-stained optic nerve cross-sections of three representative optic nerves, presented in their entirety (top row) and magnified (bottom row), collected from adult J:DO mice. These micrographs were collected from optic nerves with the (A, D) smallest, (B, E) median, and (C, F) largest cross-sectional areas in the study cohort. Scale bars: 100 µm (total magnification ×100; A–C) and 5 µm (×1000; D–F). (G) Graph showing the distribution of cross-sectional area (CSA) measurements for all nerves included in the study. Each dot represents data from one nerve, inset horizontal and vertical lines represent the mean ± SD area for all nerves, respectively. Dot plots relating (H) total axon number, (I) mean axon density, and (J) retinal surface area to the CSA of the corresponding optic nerve. Each dot represents data from one optic nerve (n = 61) or nerve/retina pair (as in J; n = 46), inset solid and dotted lines represent the best-fit and 95% confidence interval, respectively, Pearson's correlation coefficient (r), and asterisks represent P < 0.05 using a two-tailed Student t-test.

Similar articles

Cited by

References

    1. Weinreb RN, Aung T, Medeiros FA.. The pathophysiology and treatment of glaucoma: a review. JAMA. 2014; 311: 1901–1911. - PMC - PubMed
    1. Sohn EH, van Dijk HW, Jiao C, et al. .. Retinal neurodegeneration may precede microvascular changes characteristic of diabetic retinopathy in diabetes mellitus. Proc Natl Acad Sci USA. 2016; 113: E2655–2664. - PMC - PubMed
    1. Dehabadi MH, Davis BM, Wong TK, Cordeiro MF.. Retinal manifestations of Alzheimer's disease. Neurodegener Dis Manag. 2014; 4: 241–252. - PubMed
    1. Nishioka C, Liang HF, Barsamian B, Sun SW.. Sequential phases of RGC axonal and somatic injury in EAE mice examined using DTI and OCT. Mult Scler Relat Disord. 2019; 27: 315–323. - PMC - PubMed
    1. Walter SD, Ishikawa H, Galetta KM, et al. .. Ganglion cell loss in relation to visual disability in multiple sclerosis. Ophthalmology .2012; 119: 1250–1257. - PMC - PubMed

Publication types