. 2022 Sep 1;14(9):613.
doi: 10.3390/toxins14090613.

Experimental Bothropsatrox Envenomation: Blood Plasma Proteome Effects after Local Tissue Damage and Perspectives on Thromboinflammation

Affiliations

Experimental Bothropsatrox Envenomation: Blood Plasma Proteome Effects after Local Tissue Damage and Perspectives on Thromboinflammation

Joeliton S Cavalcante et al. Toxins (Basel). .

Abstract

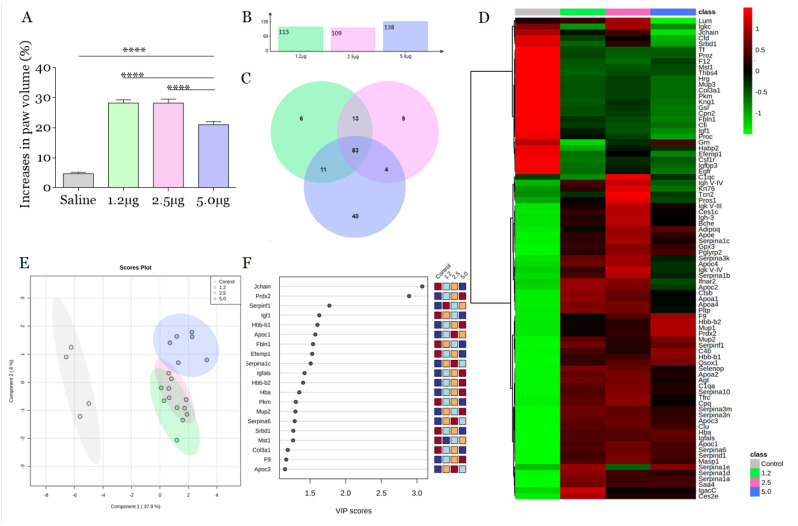
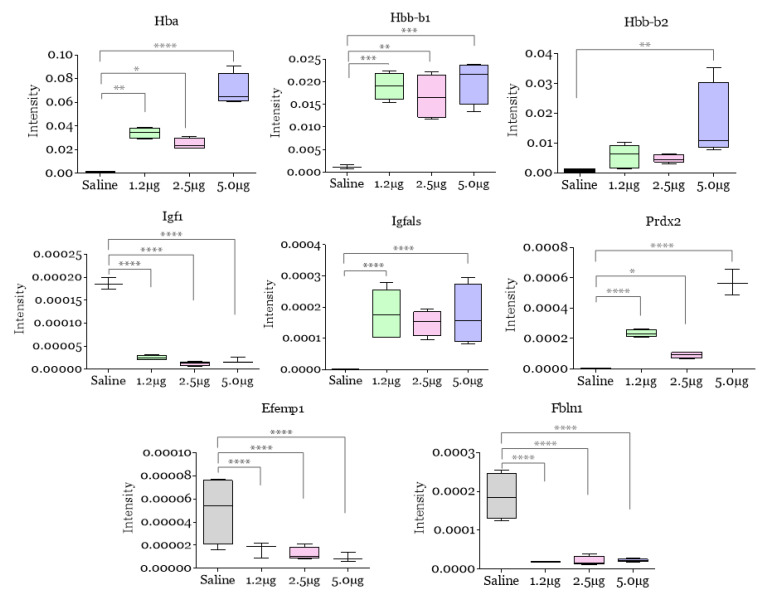
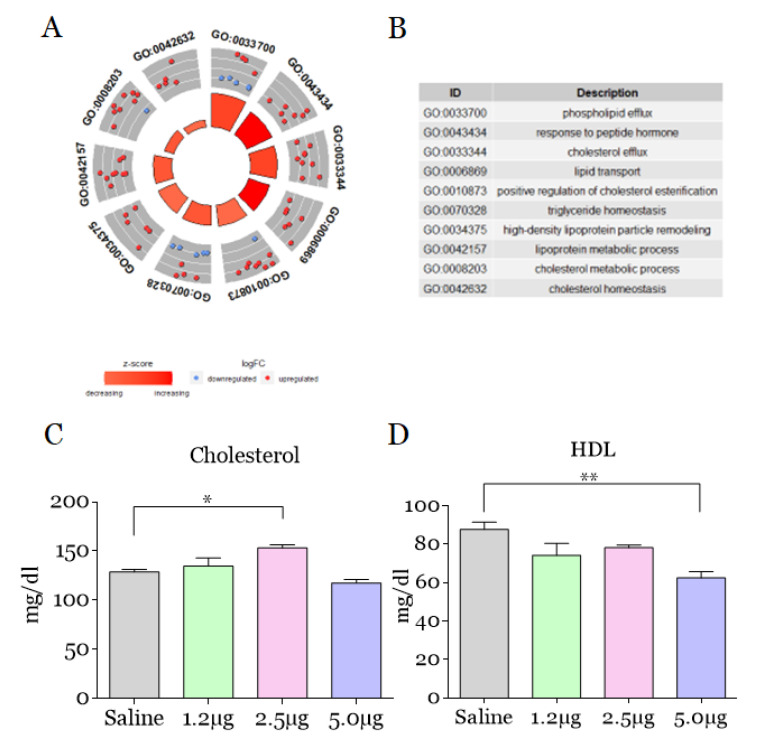
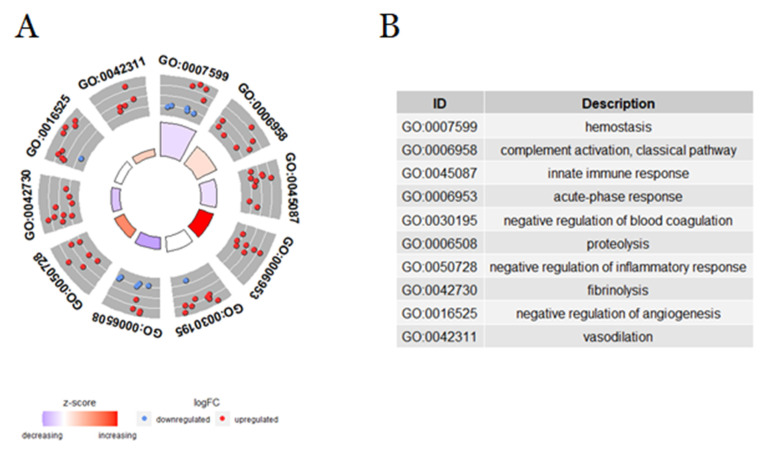
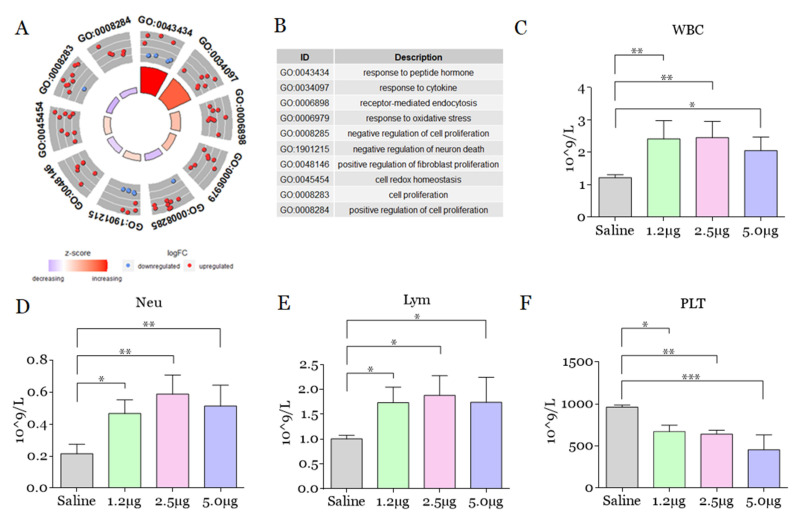
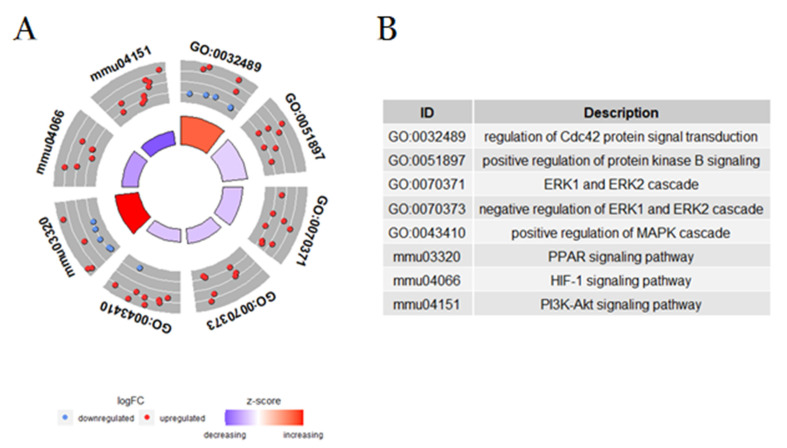
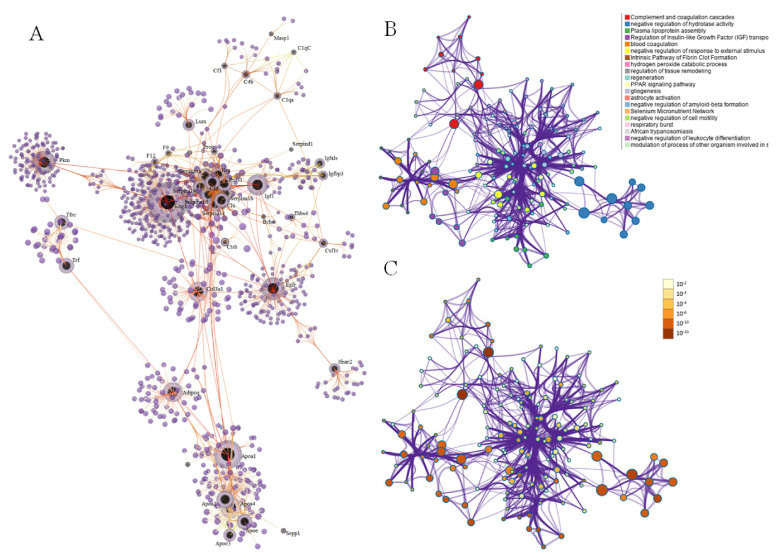
The clinical manifestations of Bothrops atrox envenoming involve local and systemic changes, among which edema requires substantial attention due to its ability to progress to compartmental syndromes and sometimes cause tissue loss and amputations. However, the impact of edema on the poisoned body's system has not been explored. Thus, the present study aimed to explore the systemic pathological and inflammatory events that are altered by intraplantar injection of B. atrox venom in a mouse model through hematologic, lipidic, and shotgun proteomics analysis. Plasma samples collected showed a greater abundance of proteins related to complement, coagulation, lipid system, platelet and neutrophil degranulation, and pathways related to cell death and ischemic tolerance. Interestingly, some proteins, in particular, Prdx2 (peroxiredoxin 2), Hba (hemoglobin subunit alpha), and F9 (Factor IX), increased according to the amount of venom injected. Our findings support that B. atrox venom activates multiple blood systems that are involved in thromboinflammation, an observation that may have implications for the pathophysiological progression of envenomations. Furthermore, we report for the first time a potential role of Prdx2, Hba, and F9 as potential markers of the severity of edema/inflammation in mice caused by B. atrox.

Keywords: Bothrops atrox; edema; inflammation; proteomic analysis; snake venom; thromboinflammation.


Conflict of interest statement

The authors declare no conflict of interest.

Figures

Figure 1
Figure 1
B. atrox venom induces edema and changes in the blood plasma proteome of mice. (A) Edematogenic profile of B. atrox venom by dose-response. B. atrox venom was injected i.pl. in the right hind paw of male swiss mice (n = 6). Paw edema 30 min after injection with venom with the aid of a digital caliper and expressed in % increase in relation to the initial thickness. The columns represent the mean ± SD (n = 6/group). **** p < 0.0005 for the comparisons indicated (one-way ANOVA). (B) Number of proteins with differential abundance (DAPs) (log-FC ≥ 1) identified in each group. (C) Venn diagram describing the distribution of DAPs among groups. (D) Heatmap shows the turnover of common plasma proteins (CPP) obtained from mice injected with 1.2, 2.5, and 5.0 μg of B. atrox venom. High protein abundance is shown in shades of red and low abundance is shown in shades of green. The abundance of each protein was normalized by the internal standard to generate a data matrix consisting of signal intensity values followed by scaling data centered on the mean and generalized logarithmic transformation. Values are presented as the mean of each experimental group. (E) Partial Least Squares Discriminant Analysis (PLS-DA) imp. features, p < 0.05 of the proteome of blood plasma mice (n = 6: three biological pools/replicas × two technical replicas). (F) The variable importance projection (VIP) plot displays the top 20 most important protein resources identified by the PLS-DA. The colored boxes on the right indicate the relative abundance of the corresponding protein for plasma samples from mice injected with venom. VIP is a weighted sum of squares of the PLS-DA loads taking into account the amount of Y variable explained in each dimension.
Figure 2
Figure 2
Comparative analysis of hemoglobin and subunits (Hba, Hbb-b1/b2), peroxiredoxin 2 (Prdx2), factor IX (F9), insulin-like growth factor 1 (Igf1), epidermal growth factor containing fibulin-like extracellular matrix protein 1 (Efemp1) and fibulin (Fbln1) level alterations in mice 30 min after intraplantar injection with B. atrox venom. Trends of a few selected differentially abundant proteins in blood plasma proteome alterations identified by mass spectrometry. Data are represented by the normalized intensity of proteins captured by an extracted ion chromatogram (XIC). The Y-axis of the box plots were normalized (log-fold) intensity. The columns represent the mean ± SD (n = 6/group). * p < 0.05, ** p < 0.01, *** p < 0.005, and **** p < 0.0005 for the comparisons indicated (one-way ANOVA).
Figure 3
Figure 3
Principal biological processes related to the lipid system that enriched blood plasma of mice 30 min after intraplantar injection with B. atrox venom. (A) Identification of the main differentially regulated ontological (GO) gene terms, graphically displayed according to significance, with a measure of overall up- or down-regulation for category after experimental envenomation using B. atrox venom. The outer circle shows the number of proteins whose color of each protein corresponds to the logarithmic change, with red representing the increase in abundance and blue representing the decrease. The inner rectangles represent the p-value of the GO term and are colored according to the z-score to represent the general direction of change for each individual term. (B) The table lists the GO terms. (CD) Cholesterol and HDL values in the serum of mice after injection with 1.2, 2.5, and 5.0 µg of B. atrox. The columns represent the mean ± SD (n = 6/group). * p < 0.05 and ** p < 0.01 for the comparisons indicated (one-way ANOVA).
Figure 4
Figure 4
Principal biological processes related to immune systems and coagulation that were enriched in the blood plasma of mice 30 min after intraplantar injection with B. atrox venom. (A) Identification of the main differentially regulated ontological (GO) gene terms, graphically displayed according to significance, with an overall up- or down-regulation measure for the category after injected with B. atrox venom. The outer circle shows the number of proteins whose color of each protein corresponds to the logarithmic change, with red representing the increase in abundance and blue representing the decrease. The inner rectangles represent the p-value of the GO term and are colored according to the z-score to represent the general direction of change for each individual term. (B) The table lists the GO terms.
Figure 5
Figure 5
Principal biological processes related to blood cells and in mouse leukocyte and platelet counts 30 min after intraplantar injection with B. atrox venom. (A) Identification of the main differentially regulated ontological gene (GO) terms, graphically displayed according to significance, with an overall measure of up- or down-regulation for the category after injection with B. atrox venom. The outer circle shows the number of proteins whose color of each protein corresponds to the logarithmic change, with red representing the increase in abundance and blue representing the decrease. The inner rectangles represent the p-value of the GO term and are colored according to the z-score to represent the general direction of change for each individual term. (B) The table lists the GO terms. (CF) Count of circulating total leukocytes (WBC), neutrophils (Neu), lymphocytes (Lym), and platelets (PLT) in the blood of mice 30 min after injection with 1.2, 2.5, and 5.0 µg of B. atrox. The columns represent the mean ± SD (n = 6/group). * p < 0.05, ** p < 0.01 and *** p < 0.005 for the comparisons indicated (one-way ANOVA).
Figure 6
Figure 6
Principal signaling pathways related to regulation of gene expression and enriched cell cycle in blood plasma of mice 30 min after intraplantar injection with B. atrox venom. (A) Identification of the main differentially regulated ontological gene terms (GO), graphically displayed according to significance, with an overall up- or down-regulation measure for the category after injection with the B. atrox venom. The outer circle shows the number of proteins whose color of each protein corresponds to the logarithmic change, with red representing the increase in abundance and blue representing the decrease. The inner rectangles represent the p-value of the GO term and are colored according to the z-score to represent the general direction of change for each individual term. (B) The table lists the GO terms.
Figure 7
Figure 7
Network of protein-protein interactions and major cluster of altered processes blood plasma of mice 30 min after intraplantar injection with B. atrox venom. (A) Main proteins of the iteration network. (B) Network of enriched terms colored by cluster ID, where nodes that share the same cluster ID are typically close to each other. (C) Network of enriched terms colored by p-value, where terms containing more genes tend to have a more significant p-value.

References

    1. Silva A.M.D., Colombini M., Moura-da-Silva A.M., Souza R.M.D., Monteiro W.M., Bernarde P.S. Epidemiological and clinical aspects of snakebites in the upper Juruá River region, western Brazilian Amazonia. Acta Amaz. 2019;50:90–99. doi: 10.1590/1809-4392201901561. - DOI
    1. Monteiro W.M., Contreras-Bernal J.C., Bisneto P.F., Sachett J., Mendonça da Silva I., Lacerda M., Guimarães da Costa A., Val F., Brasileiro L., Sartim M.A., et al. Bothrops atrox, the most important snake involved in human envenomings in the amazon: How venomics contributes to the knowledge of snake biology and clinical toxinology. Toxicon X. 2020;23:100037. doi: 10.1016/j.toxcx.2020.100037. - DOI - PMC - PubMed
    1. Sousa L.F., Portes-Junior J.A., Nicolau C.A., Bernardoni J.L., Nishiyama M.Y., Jr., Amazonas D.R., Moura-da-Silva A.M. Functional proteomic analyses of Bothrops atrox venom reveals phenotypes associated with habitat variation in the Amazon. J. Proteom. 2017;159:32–46. doi: 10.1016/j.jprot.2017.03.003. - DOI - PubMed
    1. Tasoulis T., Isbister G.K. A Review and Database of Snake Venom Proteomes. Toxins. 2017;9:290. doi: 10.3390/toxins9090290. - DOI - PMC - PubMed
    1. Cavalcante J.D.S., Nogueira Júnior F.A., Bezerra-Jorge R.J., Almeida C. Pain modulated by Bothrops snake venoms: Mechanisms of nociceptive signaling and therapeutic perspectives. Toxicon. 2021;201:105–114. doi: 10.1016/j.toxicon.2021.08.016. - DOI - PubMed

Publication types