. 2022 Sep 2;14(9):614.
doi: 10.3390/toxins14090614.

Characterization of Lung Injury following Abrin Pulmonary Intoxication in Mice: Comparison to Ricin Poisoning

Affiliations

Characterization of Lung Injury following Abrin Pulmonary Intoxication in Mice: Comparison to Ricin Poisoning

Anita Sapoznikov et al. Toxins (Basel). .

Abstract

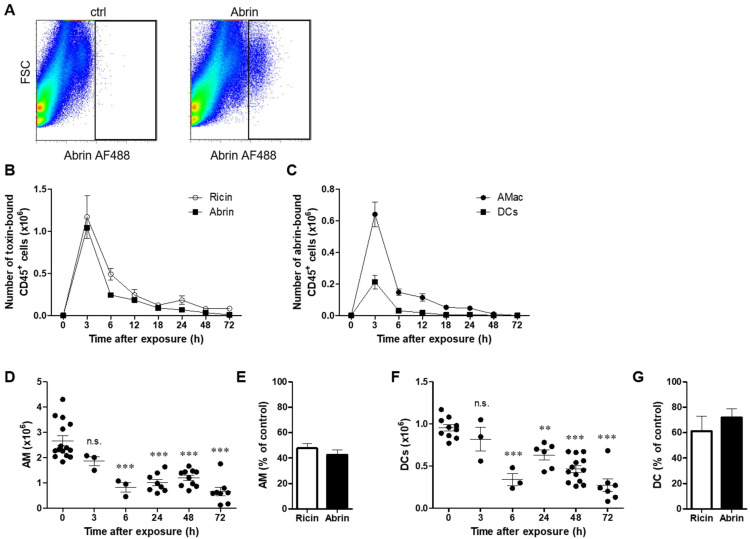
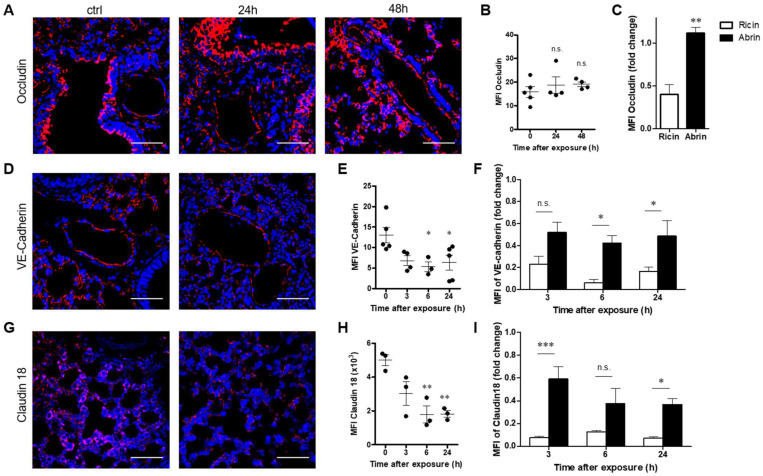
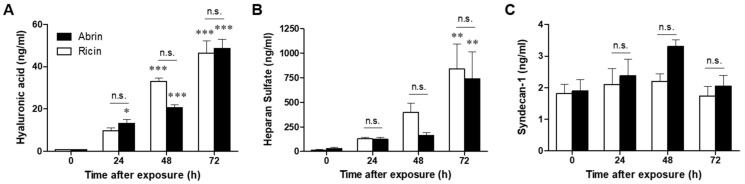
Abrin is a highly toxic protein obtained from the seeds of the rosary pea plant Abrus precatorius, and it is closely related to ricin in terms of its structure and chemical properties. Both toxins inhibit ribosomal function, halt protein synthesis and lead to cellular death. The major clinical manifestations following pulmonary exposure to these toxins consist of severe lung inflammation and consequent respiratory insufficiency. Despite the high similarity between abrin and ricin in terms of disease progression, the ability to protect mice against these toxins by postexposure antibody-mediated treatment differs significantly, with a markedly higher level of protection achieved against abrin intoxication. In this study, we conducted an in-depth comparison between the kinetics of in vivo abrin and ricin intoxication in a murine model. The data demonstrated differential binding of abrin and ricin to the parenchymal cells of the lungs. Accordingly, toxin-mediated injury to the nonhematopoietic compartment was shown to be markedly lower in the case of abrin intoxication. Thus, profiling of alveolar epithelial cells demonstrated that although toxin-induced damage was restricted to alveolar epithelial type II cells following abrin intoxication, as previously reported for ricin, it was less pronounced. Furthermore, unlike following ricin intoxication, no direct damage was detected in the lung endothelial cell population following abrin exposure. Reduced impairment of intercellular junction molecules following abrin intoxication was detected as well. In contrast, similar damage to the endothelial surface glycocalyx layer was observed for the two toxins. We assume that the reduced damage to the lung stroma, which maintains a higher level of tissue integrity following pulmonary exposure to abrin compared to ricin, contributes to the high efficiency of the anti-abrin antibody treatment at late time points after exposure.

Keywords: abrin; alveolar epithelial type II cells; alveolar–capillary barrier; glycocalyx; intranasal; junction proteins; lungs; neutrophils; ricin.


Conflict of interest statement

The authors declare no conflict of interest.

Figures

Figure 1
Figure 1
Kinetics of abrin binding to hematopoietic cells and alteration in cell populations in the lung. Mice were intranasally exposed to fluorescent abrin or ricin AF488 (20 or 14 µg/kg body weight, respectively), and lung cells were isolated at 3, 6, 12, 18, 24, 48 and 72 h after exposure and analyzed by flow cytometry for toxin binding by detection of AF488+ cells and different cell population counts in the lungs. (A) Dot plots represent abrin AF488 staining in lung cells isolated 3 h after abrin intoxication or in cells isolated from control mice. (B) Quantification of toxin-bound CD45+ cells at different time points following intoxication. A comparison between ricin and abrin intoxications (n = 3–9 mice in each group). (C) Quantification of abrin-bound AMs and DCs at different time points following abrin intoxication (n = 3–6 mice in each group). Quantification of AM (D) and DC (F) population sizes at different time points following abrin intoxication (10 µg/kg, n = 3–15 mice in each group; each point indicates individual mice). The results are depicted as the means ± SEMs. ** p < 0.01, *** p < 0.001 in comparison to nonintoxicated mice; n.s., not significant. Comparison between abrin and ricin [25] AMs (E) and DCs (G) (% of control) at 24 h postexposure to toxins.
Figure 2
Figure 2
Kinetics of abrin binding to parenchymal cells and alteration in cell populations in the lung. Mice were intranasally exposed to fluorescent abrin or ricin AF488 (20 or 14 µg/kg body weight, respectively), and lung cells were isolated at 24, 48 and 72 h and analyzed by flow cytometry for toxin binding by detection of AF488+ cells and for different cell population counts in the lungs. (A) Quantification of toxin-bound CD45 cells at different time points following intoxication. Comparison between ricin and abrin intoxications (n = 3 mice per group). (B) Mice were intranasally exposed to abrin (10 µg/kg), lungs were removed at indicated time points, and endothelial and epithelial (D) numbers were determined by flow cytometry (n = 6–9 mice in each group). Comparison between the percent of endothelial (C) or epithelial (E) cells at 48 h post abrin exposure to the percent of these cells at the same time point after ricin intoxication [25]. (F) Quantification of alveolar epithelial type I (ATI) and alveolar epithelial type II (ATII) (G) cell populations at 48 h post abrin exposure (n = 8–17 mice in each group). (H) Immunofluorescence analysis of ATI (T1α, red) and ATII (pro-SPC, green) or endothelial cell (CD31, green) staining of lung tissue in nonintoxicated mice (control) versus abrin 48 h postexposed mice (blue, 4′,6-diamidino-2-phenylidole (DAPI) staining of nuclei). Scale bar: 50 µm. The results are depicted as the means ± SEMs. * p < 0.05, ** p < 0.01, *** p < 0.001; n.s., not significant. (A,C,E) Comparison between intoxications at each time point; (B,D,F,G) comparison with nonintoxicated mice.
Figure 3
Figure 3
Effect of exposure to abrin on neutrophils and lung permeability. Mice were intranasally exposed to fluorescent abrin AF488 (20 µg/kg body weight), and lung cells were isolated at 3, 6, 24, 48 and 72 h and analyzed for neutrophils by flow cytometry. (A) Dot plots represent abrin AF488 staining in neutrophils isolated 3 h after abrin intoxication or in cells isolated from control mice. (B) Abrin AF488 binding to neutrophils (black histograms) and AMs (red histograms) at different time points following abrin intoxication. (AMs are autofluorescent in the lungs and exhibit high background in control mice.) (C) MFI of abrin AF488 binding to neutrophils (n = 3–7 mice in each group). (D) Neutrophil count in the lungs at different time points following abrin intoxication. (E) Comparison between the increase in neutrophils after abrin and ricin [25] intoxication (n = 3–15 mice in each group). (F) Lung EBD extravasation following abrin intoxication. Control or abrin-intoxicated mice were intravenously injected with 50 mg/kg EBD at the indicated time points, and lungs were monitored for EBD content (n = 4–10 mice in each group). The results are depicted as the means ± SEMs. *** p < 0.001; n.s., not significant. In (D,F), comparison with nonintoxicated mice.
Figure 4
Figure 4
Alterations in occludin, VE-cadherin and claudin 18 in the lungs of abrin-intoxicated mice. Lungs of abrin-intoxicated (10 µg/kg body weight) mice were harvested at the indicated time points, and junction proteins were quantified by immunohistochemical analysis of lung sections. (A,D,G) Confocal microscopy scans of lung sections stained for occludin, VE-cadherin and claudin 18 (red), respectively, and identification of nuclei by DAPI (blue). (B,E,H) Scatterplots represent the immunofluorescence staining intensities of occludin, VE-cadherin and claudin 18, expressed as MFI (n = 3–5 mice in each group). Scale bar: 50 µm. (C,F,I) Comparison between the abrin- and ricin-induced reduction in occludin (at 48 h), VE-cadherin and claudin 18 [27]. The results are depicted as the means ± SEMs. * p < 0.05, ** p < 0.01, *** p < 0.001; n.s., not significant. In (B,E,H), comparison with nonintoxicated mice.
Figure 5
Figure 5
Alterations in connexin 43 and claudin 5 in the lungs of abrin-intoxicated mice. Lungs of abrin-intoxicated (10 µg/kg body weight) mice were harvested at the indicated time points, and junction proteins were quantified by immunohistochemical analysis of lung sections. (A,D) Confocal microscopy scans of lung sections stained for connexin 43 and claudin 5 (red) and identification of nuclei by DAPI (blue). (B,E) Scatterplots represent the immunofluorescence staining intensities of connexin 43 and claudin 5, expressed as MFI (n = 3–4 mice in each group). Scale bar: 50 µm. (C,F) Comparison between the abrin- and ricin-induced reduction in connexin 43 and claudin 5 [27]. The results are depicted as the means ± SEMs. *** p < 0.001. In (B,E), comparison with nonintoxicated mice; n.s., not significant.
Figure 6
Figure 6
Degradation of the glycocalyx in abrin- and ricin-exposed mice. Levels of soluble hyaluronic acid (A), heparan sulfate (B) and syndecan-1 (C) were determined in the BALF collected from abrin- and ricin (10 or 7 µg/kg body weight, respectively)-exposed mice at the indicated time points (n = 4–9 mice in each group). The results are depicted as the means ± SEMs. * p < 0.05, ** p < 0.01, *** p < 0.001; n.s., not significant. The comparison of each column with nonintoxicated mice and between abrin and ricin at each time point.

References

    1. Di Maro A., Citores L., Russo R., Iglesias R., Ferreras J.M. Sequence comparison and phylogenetic analysis by the Maximum Likelihood method of ribosome-inactivating proteins from angiosperms. Plant Mol. Biol. 2014;85:575–588. doi: 10.1007/s11103-014-0204-y. - DOI - PubMed
    1. Landi N., Ruocco M.R., Ragucci S., Aliotta F., Nasso R., Pedone P.V., Di Maro A. Quinoa as source of type 1 ribosome inactivating proteins: A novel knowledge for a revision of its consumption. Food Chem. 2021;342:128337. doi: 10.1016/j.foodchem.2020.128337. - DOI - PubMed
    1. Stirpe F., Gilabert-Oriol R. In: Ribosome-Inactivating Proteins: An Overview. Carlini C.R., Ligabue-Braun R., editors. Springer; Berlin/Heidelberg, Germany: 2015. pp. 153–182. Plant Toxins.
    1. Girbés T., Ferreras J.M., Arias F.J., Stirpe F. Description, distribution, activity and phylogenetic relationship of ribosome-inactivating proteins in plants, fungi and bacteria. Mini Rev. Med. Chem. 2004;4:461–476. doi: 10.2174/1389557043403891. - DOI - PubMed
    1. Ng T. Peptides and proteins from fungi. Peptides. 2004;25:1055–1073. doi: 10.1016/j.peptides.2004.03.013. - DOI - PubMed

Publication types