Observational Study
. 2022 Nov 8;7(21):e158402.
doi: 10.1172/jci.insight.158402.

Lower SARS-CoV-2-specific humoral immunity in people living with HIV-1 recovered from nonhospitalized COVID-19

Affiliations
Observational Study

Lower SARS-CoV-2-specific humoral immunity in people living with HIV-1 recovered from nonhospitalized COVID-19

Daniel J Schuster et al. JCI Insight. .

Abstract

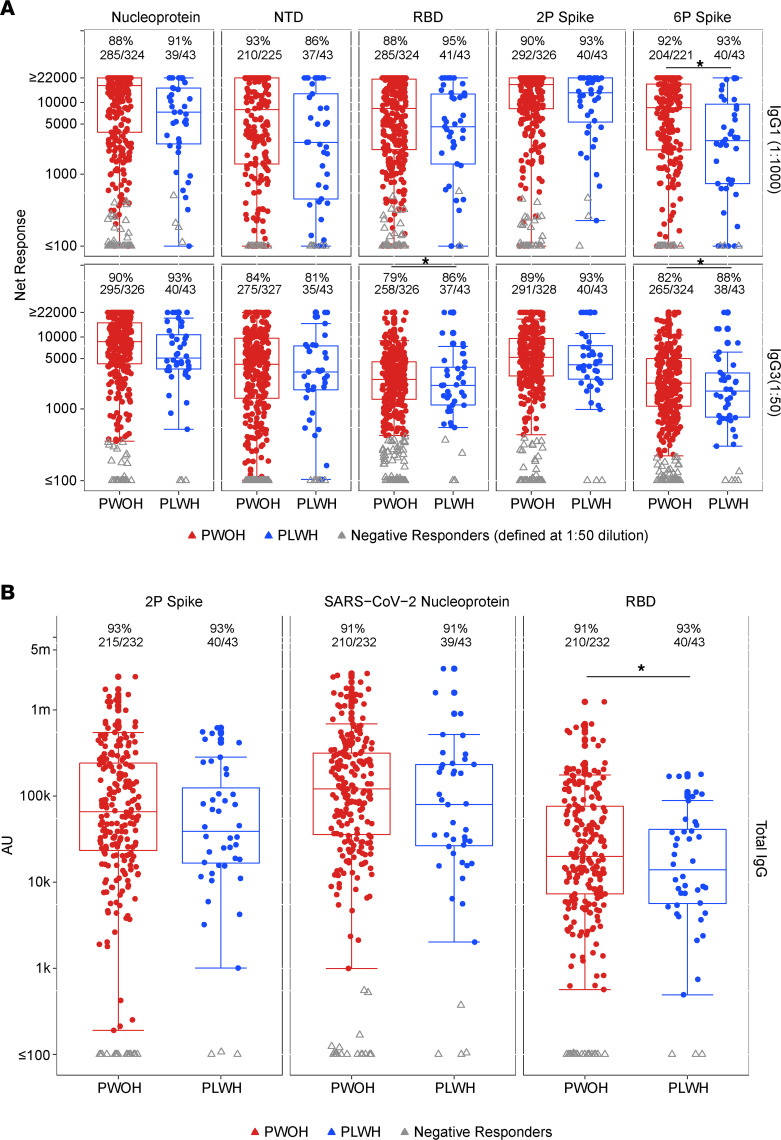
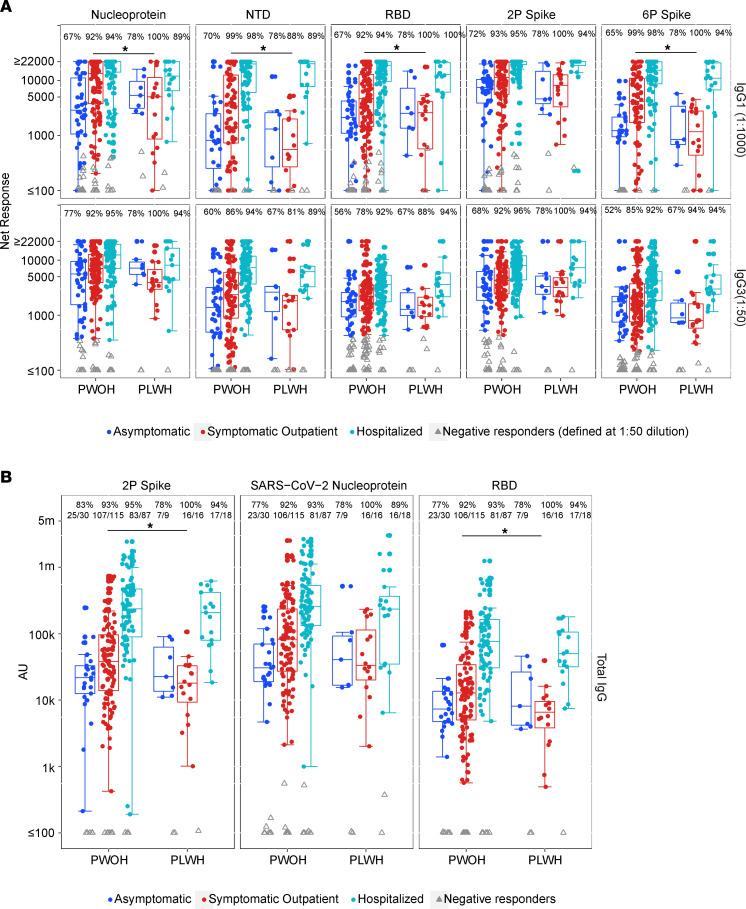
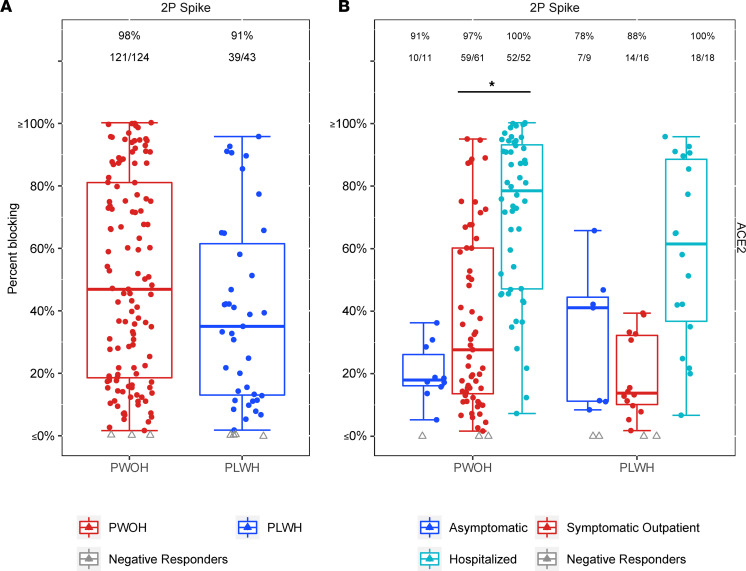
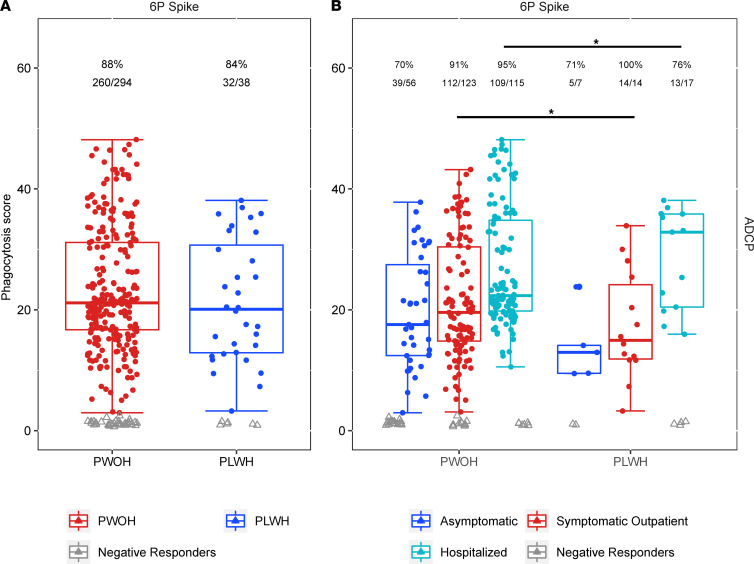
People living with HIV-1 (PLWH) exhibit more rapid antibody decline following routine immunization and elevated baseline chronic inflammation than people without HIV-1 (PWOH), indicating potential for diminished humoral immunity during SARS-CoV-2 infection. Conflicting reports have emerged on the ability of PLWH to maintain humoral protection against SARS-CoV-2 coinfection during convalescence. It is unknown whether peak COVID-19 severity, along with HIV-1 infection status, associates with the quality and quantity of humoral immunity following recovery. Using a cross-sectional observational cohort from the United States and Peru, adults were enrolled 1-10 weeks after SARS-CoV-2 infection diagnosis or symptom resolution. Serum antibodies were analyzed for SARS-CoV-2-specific response rates, binding magnitudes, ACE2 receptor blocking, and antibody-dependent cellular phagocytosis. Overall, (a) PLWH exhibited a trend toward decreased magnitude of SARS-CoV-2-specific antibodies, despite modestly increased overall response rates when compared with PWOH; (b) PLWH recovered from symptomatic outpatient COVID-19 had comparatively diminished immune responses; and (c) PLWH lacked a corresponding increase in SARS-CoV-2 antibodies with increased COVID-19 severity when asymptomatic versus symptomatic outpatient disease was compared.

Keywords: AIDS/HIV; COVID-19; Immunoglobulins.


Figures

Figure 1
Figure 1. SARS-CoV-2–specific IgG1, IgG3, and total IgG response rates and magnitudes at enrollment by HIV serostatus.
Response rates are shown above each box plot along with the number tested. RBD- and 6P spike–specific IgG3 response rates are significantly increased for PLWH (RBD: 86% vs. 79%, OR 2.81, P = 0.039; 6P spike: 88% vs. 82%, OR 3.23, P = 0.033). Colored dots, positive responders; red, PWOH; blue, PLWH; gray triangles, nonresponders. Box plots represent the distribution of magnitudes for the positive responders only. Prespecified IgG1 antigen-specific MFI positivity calls at 1:50 dilution were: RBD, 676; 2P spike, 1,967; 6P spike, 607; nucleoprotein, 1,666; NTD, 175. Instances of overlapping seropositive and seronegative responses at 1:1,000 dilution are below the positivity thresholds, and the positive responses at 1:50 are shown in Supplemental Figure 1. Response magnitude is shown as net response in mean fluorescence intensity (MFI) in A and as arbitrary units (AU) in B. 6P spike–specific IgG1 is significantly decreased for PLWH (geometric mean ratio [GMR] 0.63, P = 0.05, q = 0.138), and RBD-specific total IgG is significantly decreased for PLWH (GMR 0.63, P = 0.021, q = 0.093). Log-linear regression adjusting for peak COVID-19 symptom severity, diabetes, hypertension, chronic obstructive pulmonary disease (COPD)/emphysema/asthma, current and ever smoking, age, sex, BMI, race/ethnicity, region, and days since SARS-CoV-2 diagnosis was used. Asterisks and solid lines on top of response rates and box plots denote significant differences in response rate and response magnitude, respectively, at the P ≤ 0.05 and q ≤ 0.2 levels.
Figure 2
Figure 2. SARS-CoV-2–specific IgG1, IgG3, and total IgG response rates and magnitudes at enrollment by HIV serostatus and peak COVID-19 symptom severity.
Response rates are shown at the top of each box plot. Colored dots/boxes designate peak symptom severity (blue, asymptomatic; red, symptomatic outpatient; teal, hospitalized). Gray triangles, nonresponders. Box plots represent the distribution for the positive responders only (number tested: PLWH IgG1 and IgG3 all antigens, n = 9 asymptomatic, n = 16 symptomatic outpatient, n = 18 hospitalized; PWOH IgG1 asymptomatic/symptomatic outpatient/hospitalized: N 64/130/130, NTD 40/82/103, RBD 63/131/130, 2P 64/133/129, 6P 40/79/102; PWOH IgG3 asymptomatic/symptomatic outpatient/hospitalized: N 64/131/131, NTD 65/131/131, RBD 64/131/131, 2P 65/132/131, 6P 63/130/131). Response magnitude is shown as net response in MFI in A and as AU in B. Prespecified IgG1 antigen-specific MFI positivity calls at 1:50 dilution were: RBD, 676; 2P spike, 1,967; 6P spike, 607; nucleoprotein, 1,666, NTD, 175. Instances of overlapping seropositive and seronegative responses at 1:1,000 dilution are below the positivity thresholds, and the positive responses at 1:50 are shown in Supplemental Figure 1. (A) IgG1 and IgG3. (B) Total IgG. PLWH recovered from symptomatic outpatient COVID-19 have significantly decreased response magnitudes for nucleoprotein-, NTD-, RBD-, and 6P spike–specific IgG1 (N: GMR 0.38, P = 0.004, q = 0.02; NTD: GMR 0.23, P < 0.001, q = 0.003; RBD: GMR 0.41, P = 0.005, q = 0.02; 6P spike: GMR 0.25, P < 0.001, q = 0.001) and 2P spike– and RBD-specific total IgG (2P: GMR 0.41, P =0.012, q = 0.054; RBD: GMR 0.43, P = 0.006, q = 0.053). Response rate differences are not present by HIV serostatus within symptom severity groups. Log-linear regression adjusting for peak COVID-19 symptom severity, diabetes, hypertension, COPD/emphysema/asthma, current and ever smoking, age, sex, BMI, race/ethnicity, region, and days since SARS-CoV-2 diagnosis was used. Asterisks and solid lines denote significant differences in response magnitude between PLWH and PWOH at P ≤ 0.05 and q ≤ 0.2 levels.
Figure 3
Figure 3. SARS-CoV-2 2P spike–specific percentage ACE2 receptor blocking by serum at enrollment as a function of HIV serostatus and peak COVID-19 symptom severity.
Colored dots, positive responders; gray triangles, nonresponders. Box plots represent the distribution for positive responders only. (A) Response rates and the number tested are above each box plot (red, PWOH; blue, PLWH). (B) Response rates are above each box plot. Peak COVID-19 symptom severity is listed as: blue, asymptomatic; red, symptomatic outpatient; teal, hospitalized. No significant differences were detected between PLWH and PWOH. However, percentage blocking increased for hospitalized PWOH compared with symptomatic outpatient PWOH (OR 3.37, P = 0.005). Logistic regression adjusting for peak COVID-19 symptom severity, diabetes, hypertension, COPD/emphysema/asthma, current and ever smoking, age, sex, BMI, race/ethnicity, region, and days since SARS-CoV-2 diagnosis was used. Asterisks and solid lines denote significant differences at P ≤ 0.05 level. For within-group significant differences between peak COVID-19 symptom severities, see Supplemental Table 5.
Figure 4
Figure 4. SARS-CoV-2 spike–specific ADCP by HIV serostatus and peak COVID-19 symptom severity.
6P spike is the antigenic target. Response rate is presented at the top of each box plot along with the number tested. (A) ADCP response rate and phagocytosis score as a function of HIV serostatus (red, PWOH; blue, PLWH; gray triangles, nonresponders). (B) ADCP response rate and phagocytosis score as a function of both HIV serostatus and peak COVID-19 symptom severity (blue, asymptomatic; red, symptomatic outpatient; teal, hospitalized). PLWH recovered from symptomatic outpatient COVID-19 have significantly decreased phagocytosis compared with PWOH (GMR 0.77, P = 0.045), while PLWH recovered from hospitalized COVID-19 have a significantly decreased response rate compared with PWOH (76% vs. 95%, OR 0.23, P = 0.039). Both PWOH and PLWH demonstrated significant response rate increases within their respective serostatus groups with increased severity from asymptomatic to symptomatic participants (PWOH: OR 4.44, P = 0.002; PLWH: OR 19.3, P = 0.049). For additional within-group significant differences between peak COVID-19 symptom severities, see Supplemental Table 8. Log-linear regression adjusting for peak COVID-19 symptom severity, diabetes, hypertension, COPD/emphysema/asthma, current and ever smoking, age, sex, BMI, race/ethnicity, region, and days since SARS-CoV-2 diagnosis was used. Asterisks and solid lines on top of response rate and box plots denote significant differences in response rate and response magnitude, respectively, between PLWH and PWOH at P ≤ 0.05 level.

References

    1. Ambrosioni J, et al. Overview of SARS-CoV-2 infection in adults living with HIV. Lancet HIV. 2021;8(5):e294–e305. doi: 10.1016/S2352-3018(21)00070-9. - DOI - PMC - PubMed
    1. Fung M, Babik JM. COVID-19 in immunocompromised hosts: what we know so far. Clin Infect Dis. 2021;72(2):340–350. doi: 10.1093/cid/ciaa863. - DOI - PMC - PubMed
    1. UNAIDS. Global HIV & AIDS Statistics — Fact Sheet. https://www.unaids.org/en/resources/fact-sheet Accessed September 20, 2022.
    1. Galipeau Y, et al. Humoral responses and serological assays in SARS-CoV-2 infections. Front Immunol. 2020;11:610688. doi: 10.3389/fimmu.2020.610688. - DOI - PMC - PubMed
    1. Atyeo C, et al. Distinct early serological signatures track with SARS-CoV-2 survival. Immunity. 2020;53(3):524–532. doi: 10.1016/j.immuni.2020.07.020. - DOI - PMC - PubMed

Publication types

Substances