. 2022 Nov 15;132(22):e146095.
doi: 10.1172/JCI146095.

Neonatal hyperoxia in mice triggers long-term cognitive deficits via impairments in cerebrovascular function and neurogenesis

Affiliations

Neonatal hyperoxia in mice triggers long-term cognitive deficits via impairments in cerebrovascular function and neurogenesis

Marissa A Lithopoulos et al. J Clin Invest. .

Abstract

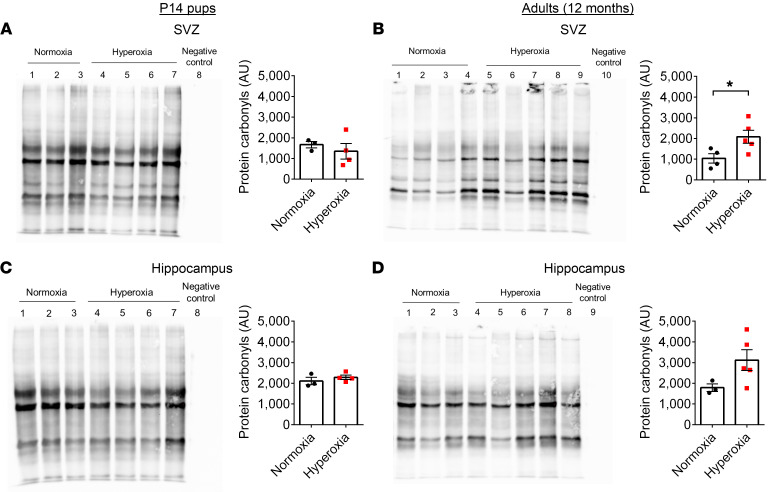
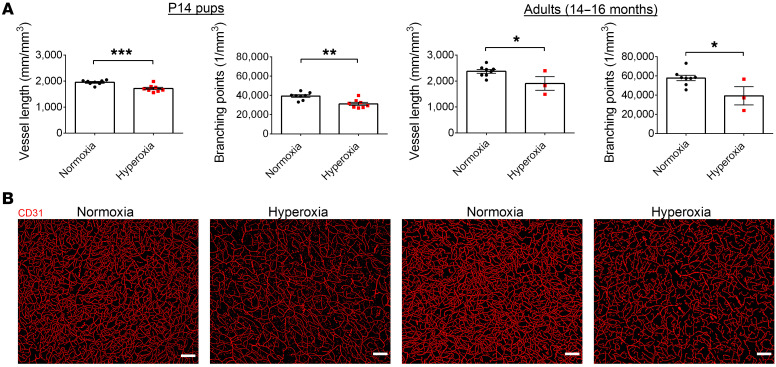
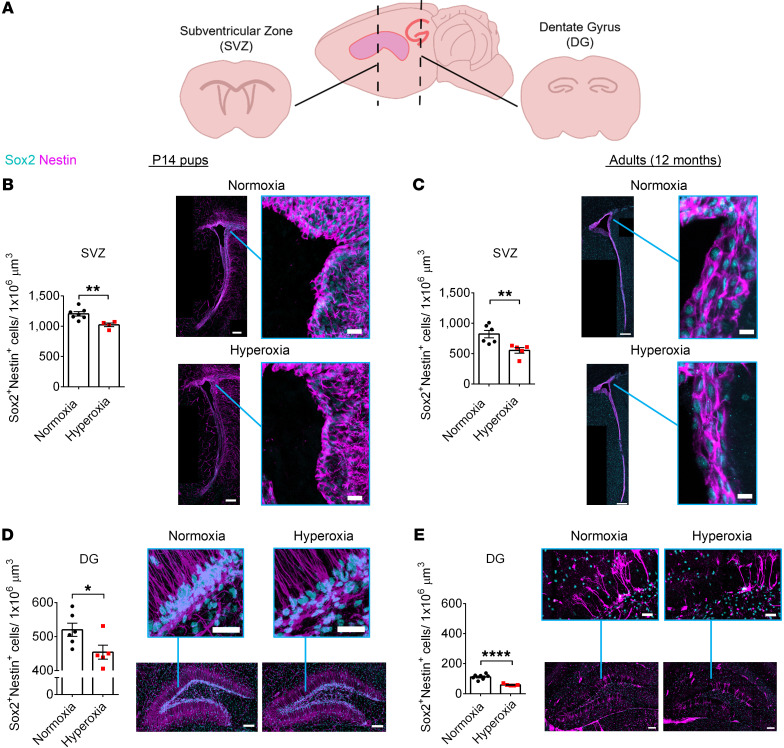
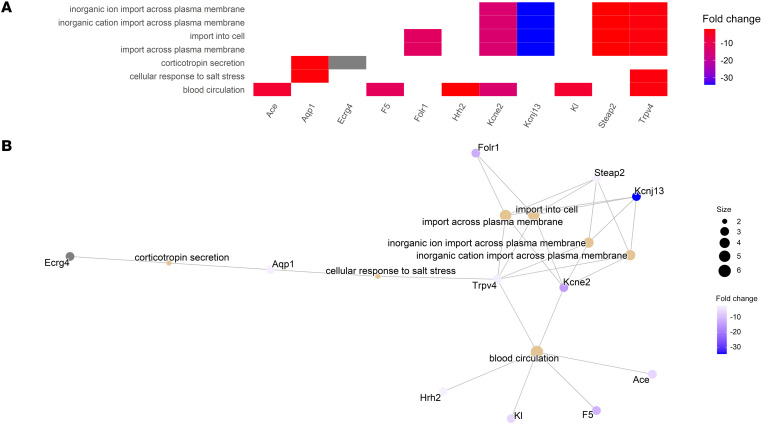
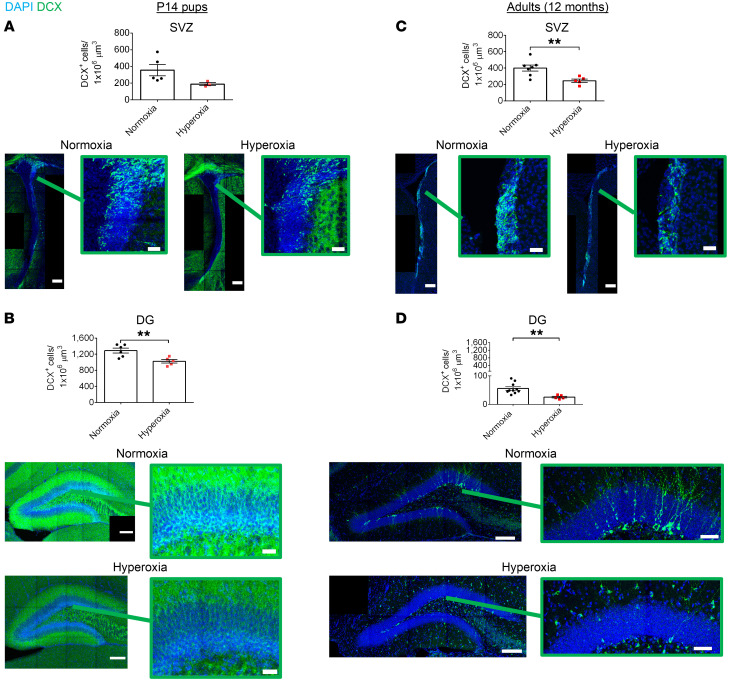
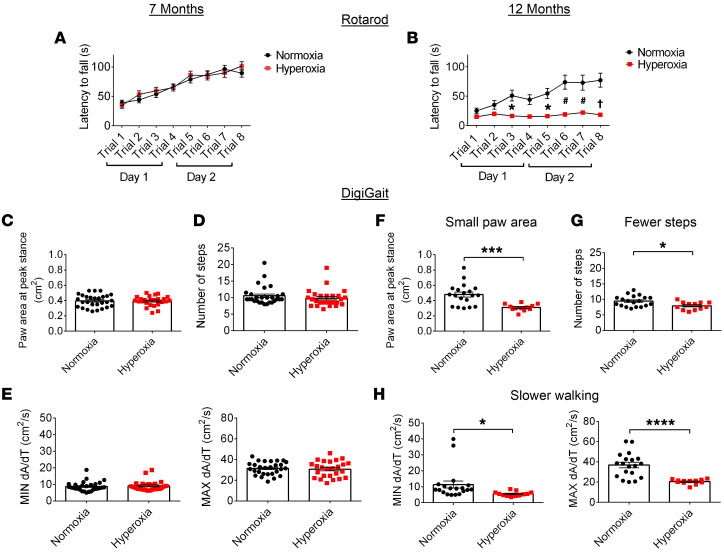
Preterm birth is the leading cause of death in children under 5 years of age. Premature infants who receive life-saving oxygen therapy often develop bronchopulmonary dysplasia (BPD), a chronic lung disease. Infants with BPD are at a high risk of abnormal neurodevelopment, including motor and cognitive difficulties. While neural progenitor cells (NPCs) are crucial for proper brain development, it is unclear whether they play a role in BPD-associated neurodevelopmental deficits. Here, we show that hyperoxia-induced experimental BPD in newborn mice led to lifelong impairments in cerebrovascular structure and function as well as impairments in NPC self-renewal and neurogenesis. A neurosphere assay utilizing nonhuman primate preterm baboon NPCs confirmed impairment in NPC function. Moreover, gene expression profiling revealed that genes involved in cell proliferation, angiogenesis, vascular autoregulation, neuronal formation, and neurotransmission were dysregulated following neonatal hyperoxia. These impairments were associated with motor and cognitive decline in aging hyperoxia-exposed mice, reminiscent of deficits observed in patients with BPD. Together, our findings establish a relationship between BPD and abnormal neurodevelopmental outcomes and identify molecular and cellular players of neonatal brain injury that persist throughout adulthood that may be targeted for early intervention to aid this vulnerable patient population.

Keywords: Behavior; Neurodevelopment; Neuronal stem cells; Neuroscience; Stem cells.


Conflict of interest statement

Conflict of interest: The authors have declared that no conflict of interest exists.

Figures

Figure 1
Figure 1. Early developmental hyperoxia exposure induces a lung injury phenotype reminiscent of BPD yet does not lead to arterial hypoxia.
(A) Representation of the experimental design. WT C57BL/6 mice were exposed to 85% O2 from P0 to P14. (B) Percentage survival of mice after 14 days of room air exposure (normoxia) or 85% O2 exposure (hyperoxia) (normoxia, n = 115; hyperoxia, n = 147; ***P < 0.001; log-rank test). (C) Percentage survival of mice 12 months after exposure to neonatal normoxia or hyperoxia (normoxia, n = 62; hyperoxia, n = 43; log-rank test). (D) Blood oxygen saturation measurements of the femoral artery at rest at P14 (normoxia, n = 16; hyperoxia, n = 13; 2-way ANOVA with Šidák’s post hoc test for group comparisons). (E) Representative images of H&E-stained lung sections of mice at P14. (F) Representative H&E-stained lung sections of 14-month-old mice. (G) Total duration spent on the metabolic treadmill (normoxia, n = 20, hyperoxia, n = 17; **P < 0.01; unpaired Student’s t test). (H) Maximum speed reached on the metabolic treadmill (normoxia, n = 20, hyperoxia, n = 17; **P < 0.01; unpaired Student’s t test). (I) Three outcome measurements were assessed for 12- to 14-month-old mice following exercise: blood oxygen saturation of the femoral artery; heart rate (bpm); and respiratory rate (breaths per minute [brpm]) (normoxia, n = 20; hyperoxia, n = 17; *P < 0.05; 2-way ANOVA with Šidák’s post hoc test for group comparisons). Scale bars: 1,000 μm (full lung sections); 100 μm (high magnification fields of view). Data are represented as mean (solid line) ± SEM (shaded area around line).
Figure 2
Figure 2. Early developmental hyperoxia exposure leads to neurovascular uncoupling.
(A) Methods used to measure CBF in P14 and 10-month-old mice. (B) Baseline CBF (AU) and percentage change in CBF after whisker stimulation (P14 mice, normoxia, n = 9, hyperoxia, n = 9; 10-month-old mice, normoxia, n = 10, hyperoxia, n = 10; **P < 0.01; ***P < 0.001; unpaired Student’s t test). (C) Mean systolic blood pressure of 10-month-old mice (normoxia, n = 8, hyperoxia, n = 5; unpaired Student’s t test). Data are represented as mean ± SEM.
Figure 3
Figure 3. The neurogenic niche regions of hyperoxia-exposed mice show an increase in oxidative stress with age.
(A) OxyBlot and quantification of protein carbonyls in the SVZ of P14 mice (normoxia, n = 3; hyperoxia, n = 4; unpaired Student’s t test). (B) OxyBlot and quantification of protein carbonyls in the SVZ of 12-month-old mice (normoxia, n = 4; hyperoxia, n = 5; *P < 0.05; unpaired Student’s t test). (C) OxyBlot and quantification of protein carbonyls in the hippocampus of P14 mice (normoxia, n = 3; hyperoxia, n = 4; unpaired Student’s t test). (D) OxyBlot and quantification of protein carbonyls in the hippocampus of 12-month-old mice (normoxia, n = 3; hyperoxia, n = 5; unpaired Student’s t test).
Figure 4
Figure 4. Neurovascular uncoupling within the cortex of hyperoxia-exposed mice correlates with significant vascular remodelling.
(A) Average vessel length and number of branching points from cortical layers II/III, IV, and V for P14 and 14- to 16-month-old mice (P14 mice, normoxia, n = 8, hyperoxia, n = 8; 14- to 16-month-old mice, normoxia, n = 8, hyperoxia, n = 3; *P < 0.05; **P < 0.01; ***P < 0.001, unpaired Student’s t test). (B) Representative images of cortical layers in P14 and 14- to 16-month-old mice. Scale bars: 100 μm. Data are represented as mean ± SEM.
Figure 5
Figure 5. Early developmental hyperoxia exposure leads to long-term NPC reduction.
(A) Schematic of the NPC niche regions, the SVZ and DG. (B and C) Quantification and representative images of NPCs (Sox2+, nestin+) in the SVZ of P14 mice (B, normoxia, n = 7, hyperoxia, n = 4; unpaired Student’s t test) and 12-month-old mice (C, normoxia, n = 6, hyperoxia, n = 5; unpaired Student’s t test). **P < 0.01. Scale bars: 150 μm (whole ventricle); 20 μm (magnified images, P14 mice); 12 μm (magnified images, 12-month-old mice). (D and E) Quantification and representative images of NPCs (Sox2+, nestin+) in the DG of P14 mice (D, normoxia, n = 6, hyperoxia, n = 5; *P < 0.05; unpaired Student’s t test) and 12-month-old mice (E, normoxia, n = 7, hyperoxia, n = 5; ****P < 0.0001; unpaired Student’s t test). Scale bars: 100 μm (whole DG); 30 μm (magnified images). Data are represented as mean ± SEM.
Figure 6
Figure 6. Long-term reduction in NPC anchorage to CD31+ vessels in the DG of hyperoxia-exposed mice.
(A and B) Quantification and representative images of the anchorage points of NPC processes (nestin+) connecting to vascular ECs (CD31+) in the DG of P14 mice (A, normoxia, n = 5; hyperoxia, n = 5; unpaired Student’s t test, **P < 0.01) and 12-month-old mice (B, normoxia, n = 7; hyperoxia, n = 5; unpaired Student’s t test, **P < 0.01). Scale bars: 30 μm (lower magnification images); 12 μm (magnified images, P14 DG); 10 μm (magnified images, 12-month DG). White arrows indicate a nestin anchorage point onto CD31+ vessels. White numbers indicate total number of anchorage points in the representative field of view. Data are represented as mean ± SEM.
Figure 7
Figure 7. Neonatal hyperoxia exposure leads to varying transcriptional signatures dependent on brain region and age.
(A) Quantity of DEGs filtered by a fold change of more than 2 or less than –2 and a P value of < 0.05. (B) DEGs for the SVZ and hippocampus of P14 pups and 12-month-old adults exposed to normoxia versus hyperoxia in early life.
Figure 8
Figure 8. Early developmental hyperoxia exposure leads to increased Ctla2a expression in neurogenic niche regions.
(A) Microarray analysis of Ctla2a expression in the SVZ of P14 mice (normoxia, n = 5; hyperoxia, n = 5; ***P < 0.001; empirical Bayes test). (B) Quantification and representative images of Ctla2a expression in the SVZ of P14 mice (normoxia, n = 4, hyperoxia, n = 4; *P < 0.05; unpaired Student’s t test). (C) Microarray analysis of Ctla2a expression in the DG of P14 mice (normoxia, n = 5; hyperoxia, n = 5; ****P < 0.0001; empirical Bayes test). (D) Quantification and representative images of Ctla2a expression in the DG of P14 mice (normoxia, n = 4, hyperoxia, n = 4; **P < 0.01; unpaired Student’s t test). Scale bars: 10 μm. Representative images show the combined Ctla2a and DAPI channels as well as the individual Ctla2a channel. White arrows indicate examples of Ctla2a+ cells. Data are represented as mean ± SEM. LV, lateral ventricle; HI, hilus.
Figure 9
Figure 9. GO enrichment analysis of SVZ tissue from 12-month-old mice reveals that early life hyperoxia exposure leads to long-term transcriptional changes involved in many biological processes, including vascular autoregulation, brain development, and neurotransmission.
(A) Heatmap plot of the top 50 enrichment terms from the SVZ tissue of normoxia- versus hyperoxia-exposed 12-month-old mice. (B) Network plot of the of the top 15 enrichment terms from the SVZ tissue of normoxia- versus hyperoxia-exposed 12-month-old mice.
Figure 10
Figure 10. GO enrichment analysis of hippocampal tissue from 12-month-old mice reveals that early life hyperoxia exposure leads to long-term transcriptional changes involved in biological processes relating to vascular autoregulation, transfer across plasma membranes, and response to salt stress.
(A) Heatmap plot of the enrichment terms from the hippocampal tissue of normoxia- versus hyperoxia-exposed 12-month-old mice. (B) Network plot of the enrichment terms from the hippocampal tissue of normoxia- versus hyperoxia-exposed 12-month-old mice.
Figure 11
Figure 11. Neonatal hyperoxia exposure leads to a long-term reduction in the SVZ neural stem and progenitor population and impairs these cells’ ability to proliferate during adulthood.
(A) Quantification of type B neural stem cells (Sox2+Tbr2Ki67), proliferating type B neural stem cells (Sox2+Tbr2Ki67+), immature type C NPCs (Sox2+Tbr2+Ki67), proliferating immature type C NPCs (Sox2+Tbr2+Ki67+), mature type C NPCs (Sox2Tbr2+Ki67), and proliferating mature type C NPCs (Sox2Tbr2+Ki67+) in the SVZ of 12-month-old mice (normoxia, n = 6; hyperoxia n = 5; *P < 0.05; unpaired Student’s t test). (B) Representative images of the SVZ region of normoxia- versus hyperoxia-exposed mice. Scale bars: 15 μm (composite images); 10 μm (single-channel images). Data are represented as mean ± SEM.
Figure 12
Figure 12. Hyperoxia-induced NPC reduction is associated with impaired NPC self-renewal.
(AD) Quantification of neurospheres formed by NPCs from the SVZ of P14 (A and B) and 14-month-old (C and D) mice (normoxia, n = 5; hyperoxia, n = 5; *P < 0.05, **P < 0.01; unpaired Student’s t test). (E and F) Representative images of neurospheres formed by NPCs from P14 (E) and 14-month-old (F) mice. Scale bars: 100 μm. Data are represented as mean ± SEM.
Figure 13
Figure 13. Hyperoxia-exposed preterm baboon–derived NPCs form fewer and smaller neurospheres compared with term control NPCs.
(A) Quantification of primary and secondary neurospheres formed by NPCs from the SVZ and DG of neonatal baboons (term control, n = 3; preterm O2, n = 3; *P < 0.05; unpaired Student’s t test). (B) Quantification and representative images of the average primary and secondary neurosphere diameter formed by NPCs from the SVZ and DG of neonatal baboons (term control, n = 3; preterm O2, n = 3; *P < 0.05; unpaired Student’s t test). Scale bars: 100 μm. Data are represented as mean ± SEM.
Figure 14
Figure 14. Early developmental hyperoxia exposure leads to reduced neurogenesis that persists into adulthood.
(A) Quantification and representative images of newborn neurons (DCX+) in the SVZ of P14 mice (normoxia, n = 5; hyperoxia, n = 3; Student’s t test). Scale bars: 150 μm (whole ventricles); 30 μm (magnified images). (B) Quantification and representative images of newborn neurons (DCX+) in the DG of P14 mice (normoxia, n = 6; hyperoxia, n = 5; **P < 0.01; unpaired Student’s t test). Scale bars: 150 μm (whole DG); 30 μm (magnified images). (C) Quantification and representative images of newborn neurons (DCX+) in the SVZ of 12-month-old mice (normoxia, n = 7; hyperoxia, n = 5; **P < 0.01; unpaired Student’s t test). Scale bars: 150 μm (whole ventricles); 30 μm (magnified images). (D) Quantification and representative images of newborn neurons (DCX+) in the DG of 12-month-old mice (normoxia, n = 10; hyperoxia, n = 5; **P < 0.01; unpaired Student’s t test). Scale bars: 150 μm (whole DG); 50 μm (magnified images). Data are represented as mean ± SEM.
Figure 15
Figure 15. Motor decline with age as a result of developmental hyperoxia exposure.
(A and B) Latency to fall(s) on the rotarod test for 7-month-old mice (A, normoxia, n = 28; hyperoxia, n = 25) and 12-month-old mice (B, normoxia, n = 19; hyperoxia, n = 12). *P < 0.05, #P < 0.001; P < 0.0001. Two-way ANOVA with Šidák’s post hoc test for group comparisons. (CE) Quantification of DigiGait outcomes for 7-month-old mice (normoxia, n = 28, hyperoxia, n = 25; unpaired Student’s t test), including paw area (cm2) at peak stance (C), number of steps on the treadmill (D), and maximal rate of change in paw area during the propulsion phase (MIN dA/dT) and braking phase (MAX dA/dT) of walking (E). (FH) Quantification of DigiGait outcome measures for 12-month-old mice (normoxia, n = 19, hyperoxia, n = 12; *P < 0.05; ***P < 0.001; ****P < 0.0001; unpaired Student’s t test). Data are represented as mean ± SEM.
Figure 16
Figure 16. Long-term cognitive deficits following developmental hyperoxia exposure.
(A and B) Quantification of the context fear conditioning task for 7-month-old mice (A, normoxia/hyperoxia, n = 25) and 12-month-old mice (B, context first 3 minutes, normoxia, n = 19; hyperoxia, n = 12; context last 3 minutes, normoxia, n = 17; hyperoxia, n = 12). (C and D) Quantification of the auditory tone fear conditioning task of 7-month-old mice (C, normoxia, n = 28, hyperoxia, n = 25) and 12-month-old mice (D, pre-cue [no tone], normoxia, n = 19; hyperoxia, n = 12; cue [tone], normoxia, n = 17; hyperoxia, n = 12). *P < 0.05, ***P < 0.001; ****P < 0.0001; unpaired Student’s t test. Data are represented as mean ± SEM.

References

    1. Lawn JE, Kinney M. Preterm birth: now the leading cause of child death worldwide. Sci Transl Med. 2014;6(263):263ed21. - PubMed
    1. Stoll BJ, et al. Trends in care practices, morbidity, and mortality of extremely preterm neonates, 1993-2012. JAMA. 2015;314(10):1039–1051. doi: 10.1001/jama.2015.10244. - DOI - PMC - PubMed
    1. Jobe AH, Bancalari E. Bronchopulmonary dysplasia. Am J Respir Crit Care Med. 2001;163(7):1723–1729. doi: 10.1164/ajrccm.163.7.2011060. - DOI - PubMed
    1. Jobe AH. The new bronchopulmonary dysplasia. Curr Opin Pediatr. 2011;23(2):167–172. doi: 10.1097/MOP.0b013e3283423e6b. - DOI - PMC - PubMed
    1. Thébaud B, et al. Bronchopulmonary dysplasia. Nat Rev Dis Primers. 2019;5(1):78. doi: 10.1038/s41572-019-0127-7. - DOI - PMC - PubMed

Publication types

Grants and funding