. 2022 Nov 15;132(22):e157101.
doi: 10.1172/JCI157101.

CBFA2T3-GLIS2 model of pediatric acute megakaryoblastic leukemia identifies FOLR1 as a CAR T cell target

Affiliations

CBFA2T3-GLIS2 model of pediatric acute megakaryoblastic leukemia identifies FOLR1 as a CAR T cell target

Quy Le et al. J Clin Invest. .

Abstract

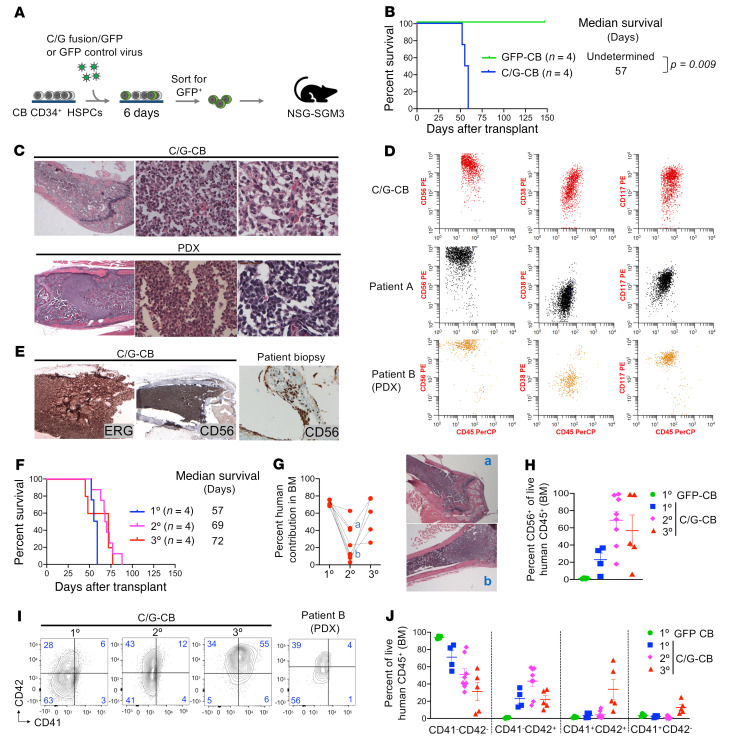
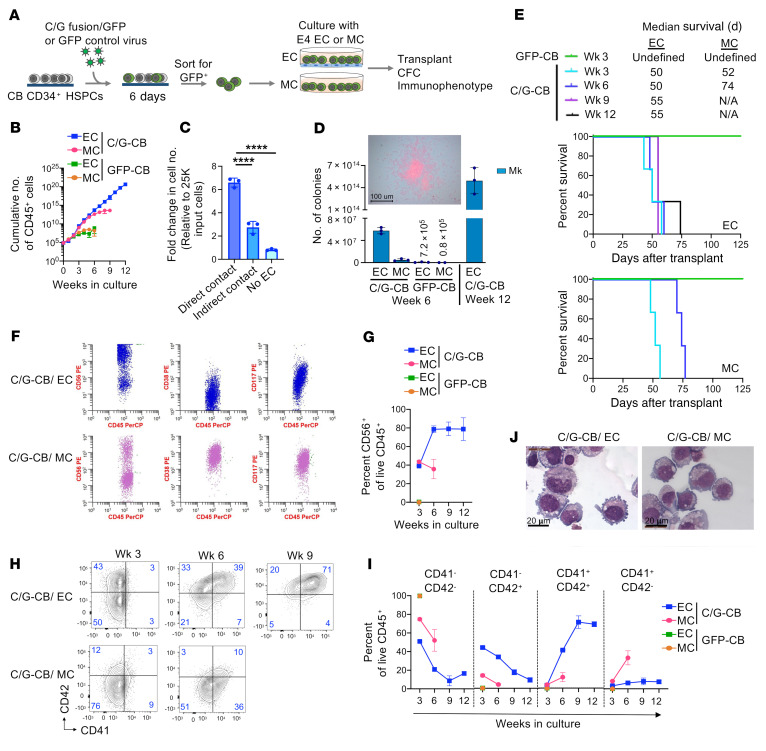
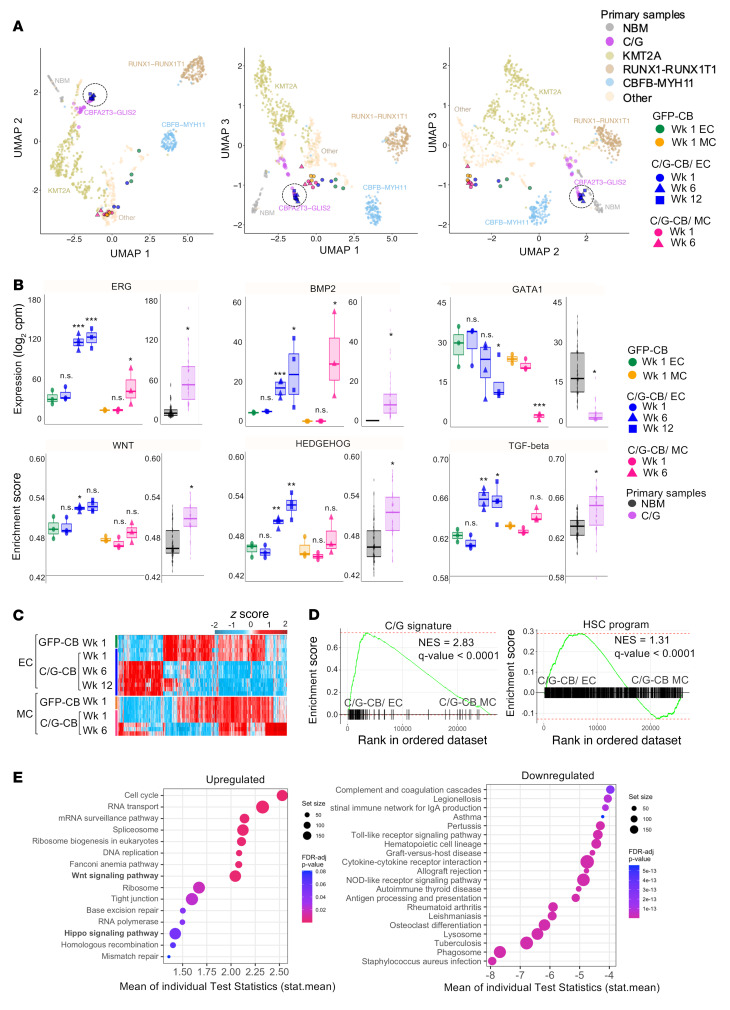
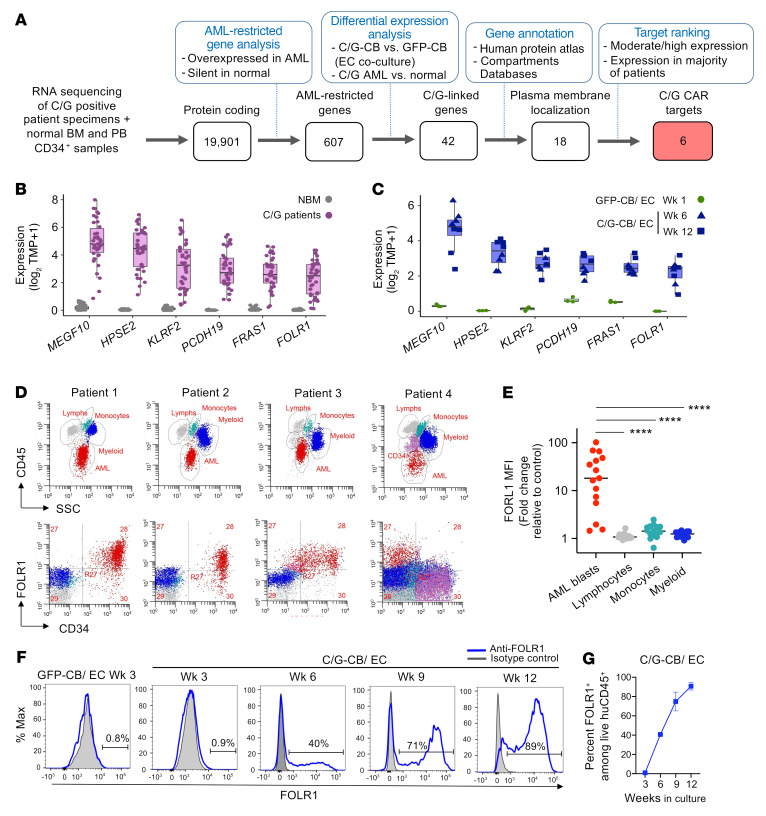
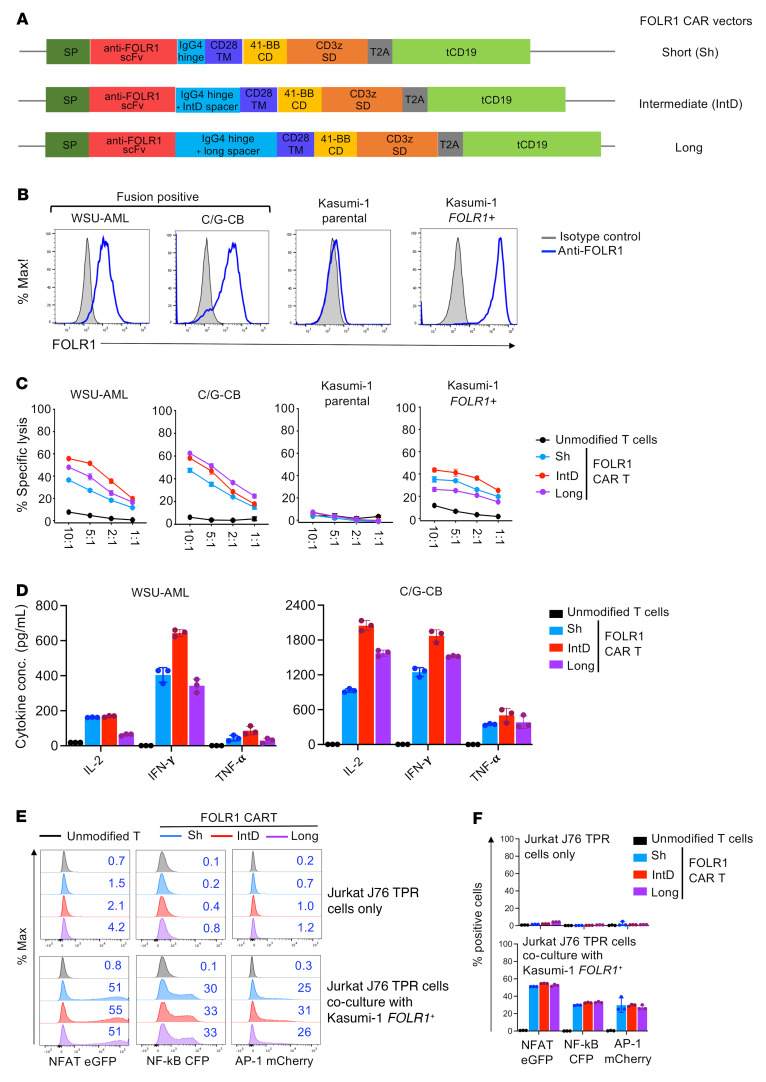
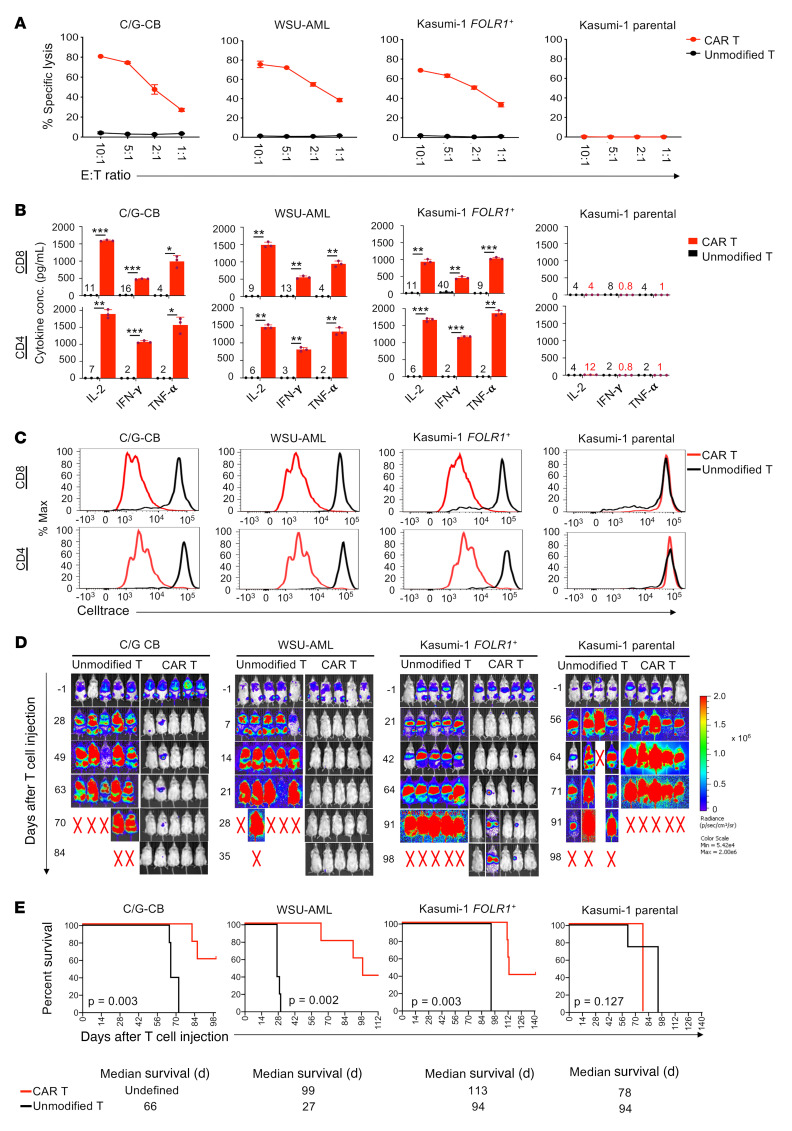
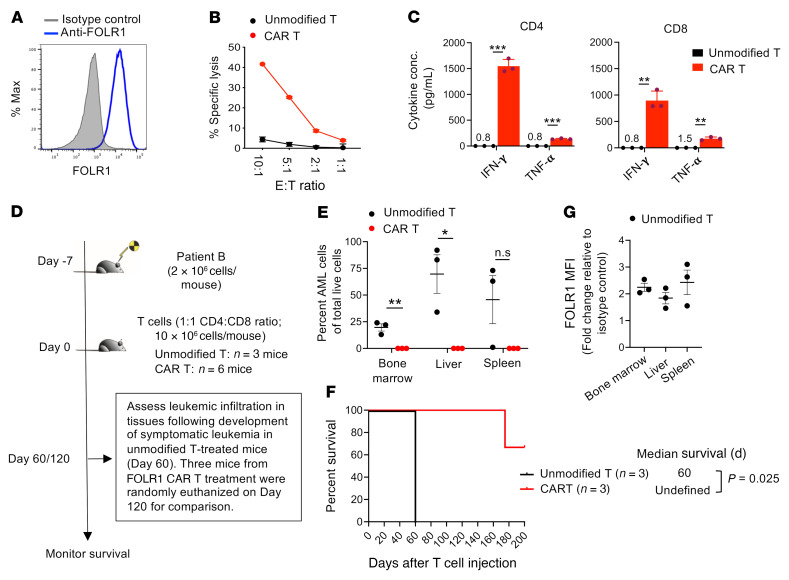
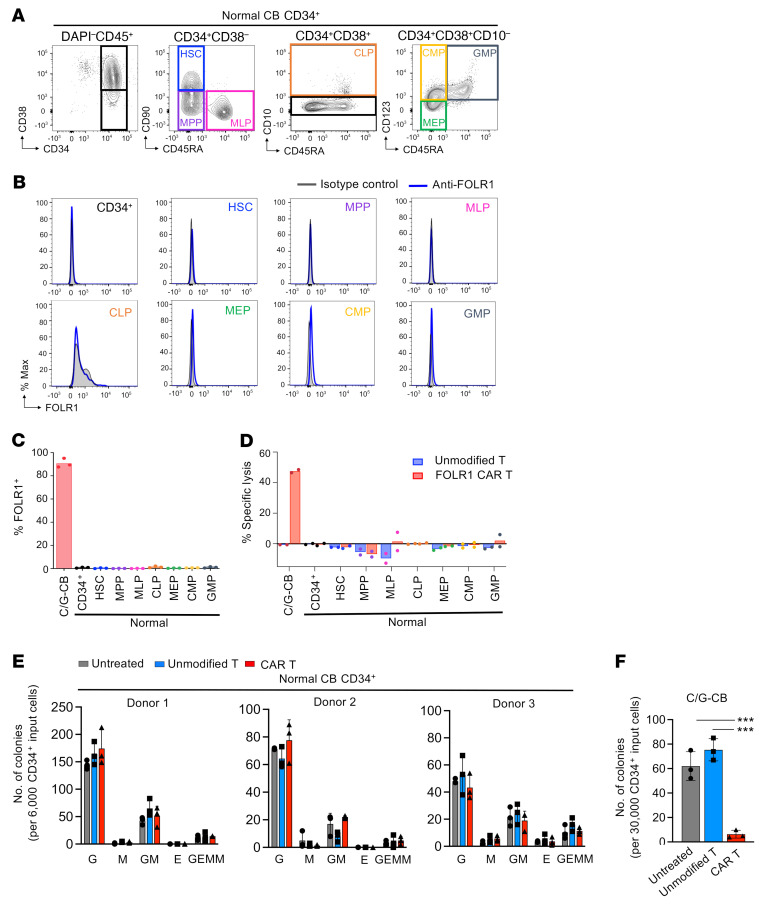
The CBFA2T3-GLIS2 (C/G) fusion is a product of a cryptic translocation primarily seen in infants and early childhood and is associated with dismal outcome. Here, we demonstrate that the expression of the C/G oncogenic fusion protein promotes the transformation of human cord blood hematopoietic stem and progenitor cells (CB HSPCs) in an endothelial cell coculture system that recapitulates the transcriptome, morphology, and immunophenotype of C/G acute myeloid leukemia (AML) and induces highly aggressive leukemia in xenograft models. Interrogating the transcriptome of C/G-CB cells and primary C/G AML identified a library of C/G-fusion-specific genes that are potential targets for therapy. We developed chimeric antigen receptor (CAR) T cells directed against one of the targets, folate receptor α (FOLR1), and demonstrated their preclinical efficacy against C/G AML using in vitro and xenograft models. FOLR1 is also expressed in renal and pulmonary epithelium, raising concerns for toxicity that must be addressed for the clinical application of this therapy. Our findings underscore the role of the endothelial niche in promoting leukemic transformation of C/G-transduced CB HSPCs. Furthermore, this work has broad implications for studies of leukemogenesis applicable to a variety of oncogenic fusion-driven pediatric leukemias, providing a robust and tractable model system to characterize the molecular mechanisms of leukemogenesis and identify biomarkers for disease diagnosis and targets for therapy.

Keywords: Cancer immunotherapy; Leukemias; Oncogenes; Oncology; Therapeutics.


Conflict of interest statement

Conflict of interest: L Pardo, LB, and MRL are employees of Hematologics, Inc and MRL has equity ownership in Hematologics, Inc.

Figures

Figure 1
Figure 1. C/G-CB cells induce leukemia, recapitulating primary disease.
(A) Diagram of experimental design. (B) Kaplan-Meier survival curves of NSG-SGM3 mice transplanted with GFP-CB control and C/G-CB cells. Statistical differences in survival were evaluated using the Mantel-Cox log-rank test. n = 4 mice per group. (C) Representative histology of H&E stain of femur taken from a mouse transplanted with C/G-CB cells (top) and cells from a C/G-positive patient sample (bottom) after development of leukemia. Original magnification, ×2.5 (left), ×40 (middle), and ×63 (right). See Supplemental Figure 1 for all H&E stains from C/G-CB–transplanted mice. n = 4 mice for C/G-CB cells and n = 2 mice for PDX. (D) Expression of the RAM immunophenotype in C/G-CB cells harvested from the bone marrow (BM) of a representative mouse at necropsy compared to a primary patient sample and PDX marrow xenograft cells. In all 3 samples, malignant cells were gated based on human CD45 expression and SSC. n = 4 mice for C/G-CB cells, n = 2 mice for PDX derived from BM cells of patient B. (E) Left and middle: Representative immunohistochemistry showing high expression of ERG (×10 magnification) and CD56 (×5 magnification) in the femur of a representative mouse transplanted with C/G-CB cells. Right: Small aggregates of blasts with high CD56 expression detected in a BM biopsy of a chemotherapy-refractory C/G-fusion-positive patient, consistent with residual, adherent, patchy disease distribution (×100 magnification). n = 4 mice. (F) Kaplan-Meier plot showing survival in primary (1°, n = 4 mice), secondary (2°, n = 7 mice), and tertiary (3°, n = 5 mice) transplantations of C/G-CB cells. (G) Engraftment of C/G-CB cells in the BM at time of symptomatic leukemia, shown as percentage human CD45+ cells. Images on the right are H&E stain of femurs taken from mice indicated by “a” and “b.” See Supplemental Figure 1 for all H&E stains from C/G-CB–transplanted mice. (H) Quantification of CD56+ cells among human CD45+ cells isolated from the BM at necropsy following development of symptomatic leukemia. (I) Expression of AMKL markers, CD41 and CD42, in C/G-CB and PDX cells harvested from the BM at necropsy. C/G-CB cells were gated on human CD45+ cells. PDX cells were gated on human CD45+CD56+ cells. (J) Quantification of CD41/CD42 subsets described in I. Bars indicate mean ± SEM. (GJ) 1°, n = 4 mice per group; 2°, n = 7 mice; and 3°, n = 5 mice.
Figure 2
Figure 2. ECs enhance the proliferative potential and promote leukemic progression of C/G-CB cells.
(A) Diagram of experimental design. This experiment was performed twice using 2 separate CB units. See Supplemental Figure 4 for the repeat experiment. (B) Growth kinetics of C/G-CB and GFP-CB cells in EC coculture or MC. (C) C/G-CB cells expanded in EC coculture for 9 weeks were reseeded in EC coculture either directly (direct contact) or in EC Transwells (indirect contact) or placed in liquid culture containing SFEM II (with SCF, FLT3L, and TPO). After 7 days, the number of GFP+ cells was quantified by flow cytometry. Data in B and C presented as mean ± SD from 3 technical replicates. Statistical significance was determined by 1-way ANOVA. ****P < 0.00005. (D) At 6 and 12 weeks, a fraction of each culture was transferred to MegaCult cultures. Colonies derived from megakaryocytic (Mk) progenitors were scored and enumerated. Data were normalized to the 500 input cells at the start of the EC coculture or MC culture. A representative colony stained with anti–human CD41 and an alkaline phosphatase detection system is shown. Data shown are the average of 3 technical replicates. Error bars denote SD. (E) Equivalent number of C/G-CB and GFP-CB cells in EC coculture or MC were transplanted into NSG-SGM3 mice at indicated time points (5 × 10⁶/mouse at week 3, and 1 × 10⁷/mouse at weeks 6, 9, and 12). Due to insufficient expansion, GFP-CB cells were not transplanted after 3 weeks in either condition, similarly for C/G-CB cells after 6 weeks in MC culture. Median survival and Kaplan-Meier survival curve are shown. C/G-CB (n = 3 mice/group), GFP-CB (n = 2 mice/group). (F) Expression of the RAM immunophenotype in C/G-CB cells after 6 weeks in EC coculture or MC. Data are pooled from 3 technical replicates. (G) Quantification of CD56+ cells among live CD45+ cells over weeks in culture. (H and I) Expression of CD41 and CD42 (H) and quantification of CD41/CD42 subsets (I) at indicated time points in EC coculture or MC. Data in H and I presented as mean ± SD from 3 technical replicates. (J) Morphological evaluation of the C/G-CB cells cultured with ECs or in MC for 9 weeks showed features of megakaryocytic differentiation, including open chromatin, prominent nucleoli, and abundant focal, basophilic, and vacuolated cytoplasm with cytoplasmic blebbing. Results shown are representative of 3 technical replicates. Scale bars: 100 μm (D) and 20 μm (J).
Figure 3
Figure 3. Transcriptional profile of C/G-CB cells in EC coculture recapitulates primary C/G AML.
(A) Unsupervised clustering by uniform manifold and projection (UMAP) analysis of C/G-CB and GFP-CB cells in reference to primary AML samples. Dashed circle indicates C/G-CB cells cocultured with ECs at week 6 and 12 time points. Normal bone marrow (NBM, n = 68); KMT2A (n = 319); RUNX1-RUNX1T1 (n = 157); CBFB-MYH11 (n = 120); other (n = 444); CBFA2T3-GLIS2 (n = 39). Primary patient data are described in Smith et al. (8). For cultured cells, n = 4 technical replicates for C/G-CB cells in EC coculture at week; n = 3 technical replicates for all other groups. (B) Top: Expression of ERG, BMP2, and GATA1 in GFP-CB versus C/G-CB cells over weeks in EC and MC conditions as well as in C/G-fusion-positive primary versus NBM samples. Bottom: Single-sample gene set enrichment (ssGSEA) scores of Hedgehog, TGF-β, and WNT signaling pathways for GFP-CB versus C/G-CB cells and NBM samples versus primary-fusion-positive samples. CBFA2T3-GLIS2 primary samples (n = 39); NBM samples (n = 68). For cultured cells, n = 4 technical replicates for C/G-CB cells in EC coculture at week; n = 3 technical replicates for all other groups. *P ≤ 0.05, **P ≤ 0.01, ***P ≤ 0.001 by unpaired, 2-sided, nonparametric Wilcoxon’s rank-sum test, analyzing differences in expression between C/G-CB in EC or MC conditions and GFP controls in EC or MC conditions, and differences between primary C/G AML samples and healthy NBM. (C) Heatmap of differentially expressed genes in C/G-CB versus GFP-CB cells in EC coculture or MC. (D) GSEA plots of C/G and HSC signature genes comparing C/G-CB cells in EC coculture versus MC at week 6 of culture. (E) Pathways that are upregulated (left) and downregulated (right) in C/G-CB cells in EC coculture compared with MC. (CE) n = 4 technical replicates for C/G-CB cells in EC coculture at week 6; n = 3 technical replicates for all other groups.
Figure 4
Figure 4. Integrative transcriptomics of primary samples and C/G-CB identify FOLR1 therapeutic target.
(A) Diagram of computational workflow to identify C/G-specific CAR targets. See Methods and Supplemental Figure 6 for details. Normal tissues include bulk bone marrow (BM) samples and peripheral blood (PB) CD34+ samples. (B and C) Expression of C/G-specific CAR targets in primary-fusion-positive patients versus normal BM (NBM) (B) and C/G-CB versus GFP-CB cells (C). CBFA2T3-GLIS2 primary samples (n = 39); NBM samples (n = 68). For cultured cells, n = 4 technical replicates for C/G-CB cells in EC coculture at week; n = 3 technical replicates for all other groups. (D) Top: Gating strategies used to identify AML cells and normal lymphocytes, monocytes, and myeloid cells in 4 representative patients based on CD45 expression and SSC. Bottom: FOLR1 expression in the AML blast subpopulation versus normal cells. (E) Quantification of FOLR1 expression (geometric mean fluorescent intensity, MFI) among AML blasts and their normal counterparts across n = 15 patients. Autofluorescence was used as control. ****P < 0.00005 by 1-way ANOVA. (F and G) Expression of FOLR1 (F) and quantification of FOLR1+ cells (G) among GFP-CB and C/G-CB over weeks in EC coculture. Data presented as mean ± SD from 3 technical replicates.
Figure 5
Figure 5. FOLR1 CAR constructs and reactivity of short, intermediate, and long FOLR1 CAR T cells.
(A) Schematic diagram of second-generation FOLR1 CAR constructs with different IgG4 spacer lengths. SP, GM-CSFR signal peptide; scFv, single-chain variable fragment; TM, transmembrane domain; CD, costimulatory domain; SD, stimulatory domain; tCD19, transduced marker truncated CD19. (B) Expression of FOLR1 in C/G-CB, M07e, WSU-AML, Kasumi-1 FOLR1+, and Kasumi-1 parental cells. Blue = stained with PE-labeled anti-FOLR1; gray = isotype control. (C) Cytolytic activity of CD8+ T cells unmodified or transduced with short, intermediate, or long FOLR1 CAR construct against C/G-CB (cells taken >9 weeks in EC coculture), M07e, WSU-AML, Kasumi-1 FOLR1+, and Kasumi-1 parental cells in a 6-hour assay. Shown is the mean percentage specific lysis ± SD from 3 technical replicates at indicated effector/target (E:T) ratios. Data are representative of 3 donors. (D) Concentration of secreted IL-2, IFN-γ, and TNF-α in the supernatant following 24 hours of CD8+ T cell/AML coculture at 1:1 E:T ratio. Mean ± SD from 3 technical replicates is shown. Data are representative of 3 donors. (E) Representative flow plots showing expression of NFAT, NF-κB, and AP-1 in Jurkat J76 TPR reporter cells transduced with FOLR1 CAR constructs cultured alone (top) or coincubated with Kasumi-1 FOLR1+ target cells for 24 hours at 1:1 E:T ratio (bottom). Kasumi-1 FOLR1+ cells were labeled with CellTrace Violet cell proliferation dye to differentiate from Jurkat cells. Transduced Jurkat cells were gated based on tCD19 expression. Number in top right corner indicates the percentage of positive cells. Analysis was performed on day 4 after transduction. (F) Quantification of percentage of NFAT+, NF-κB+, and AP-1+ cells in E. This experiment was repeated once.
Figure 6
Figure 6. Preclinical efficacy of FOLR1 CAR T cells against C/G AML cells.
(A) Cytolytic activity of CD8+ T cells unmodified or transduced with FOLR1 CAR following 6 hours of coculture with C/G-CB (cells taken after >9 weeks in EC coculture), WSU-AML, Kasumi-1 FOLR1+, and Kasumi-1 parental cells. Data presented are mean leukemia specific lysis ± SD from 3 technical replicates at indicated effector/target (E:T) ratios. Data are representative of 3 donors. (B) Concentration of secreted IL-2, IFN-γ, and TNF-α in the supernatant following 24 hours of T cell/AML coculture at 1:1 E:T ratio as measured by ELISA. Data are representative of 2 donors and are presented as mean ± SD from 3 technical replicates. Where concentrations of cytokines were too low to discern, the number above the x axis indicates the average concentration. Statistical significance was determined by unpaired, 2-tailed Student’s t test. *P < 0.05, **P < 0.005, ***P < 0.0005. Data are representative of 2 donors. (C) Representative flow cytometric analysis of cell proliferation of cell proliferation dye–labeled (CellTrace-labeled) unmodified and FOLR1 CAR T cells after 4-day coculture with target cells at a 1:1 E:T ratio. CAR T cells divided rapidly and diluted their CellTrace fluorescence after 4-hour coincubation with FOLR1+ AML cells. Data are representative of 2 donors. (D) Bioluminescence imaging of C/G-CB, WSU-AML, Kasumi-1 FOLR1+, and Kasumi-1 leukemias in mice treated with unmodified or FOLR1 CAR T cells at 5 × 10⁶ T cells per mouse. n = 5 mice/group. Radiance scale indicates an increase in leukemia from blue to red; X indicates death. (E) Kaplan-Meier survival curves of xenografts treated with unmodified or FOLR1 CAR T cells. n = 5 per group. Statistical differences in survival were evaluated using Mantel-Cox log-rank test. Note: 2 C/G-CB–bearing mice treated with CAR T cells died without leukemia and T cells present in bone marrow, spleen, and liver tissues and in peripheral blood as determined by flow cytometric analysis. n = 5 mice/group.
Figure 7
Figure 7. In vitro and in vivo assessment of FOLR1 CAR T cells against primary AML cells derived from a C/G-positive patient.
(A) Expression of FOLR1 in primary AML cells from C/G-positive patient B (see Figure 1 for details on this patient). Blue = stained with PE-labeled anti-FOLR1; gray = isotype control. (B) Cytolytic activity of CD8+ T cells unmodified or transduced with FOLR1 CAR following 6 hours of coculture with patient B AML cells. Data presented are mean leukemia-specific lysis ± SD from 3 technical replicates at indicated effector/target (E:T) ratios. Shown is representative experiment out of 3 experiments (see Supplemental Figure 14 for results from 2 additional donors). (C) Concentration of secreted IFN-γ and TNF-α in the supernatant following 24 hours of T cell/AML coculture at a 1:1 E:T ratio as measured by ELISA. Data are presented as mean ± SD from 3 technical replicates. Where concentrations of cytokines were too low to discern, the number above the x axis indicates the average concentration. Statistical significance was determined by unpaired, 2-tailed Student’s t test. **P < 0.005, ***P < 0.0005. Shown is representative experiment out of 2 experiments. (D) Schematic of experiment evaluating in vivo efficacy of FOLR1 CAR T cells against primary AML cells from patient B. Only 1 experiment was performed due to limited sample. (E) Bone marrow, liver, and spleen were harvested from control mice at necropsy following development of leukemia (60 days after T cell injection) as well as from 3 FOLR1 CAR T cell–treated mice selected at random 120 days after T cell injection. Percentage AML cells (defined as CD45dimCD56+) in the bone marrow, liver, and spleen are shown. n = 3 mice per group. Error bars denote ± SEM. Statistical significance was determined by unpaired, 2-tailed Student’s t test, assuming unequal variances. *P < 0.05, **P < 0.005. (F) Expression of FOLR1 among AML cells in the bone marrow, liver, and spleen from mice treated with unmodified T cells at necropsy. n = 3 mice per group. Error bars denote ± SEM. (G) Kaplan-Meier survival curves of PDX mice treated with unmodified or FOLR1 CAR T cells. Statistical differences in survival were evaluated using Mantel-Cox log-rank test. Only 1 experiment was performed for in vivo assessment. n = 3 mice per group.
Figure 8
Figure 8. FOLR1-directed CAR T cells effectively eliminate C/G-CB cells without affecting viability of HSPCs.
(A) Gating strategy used to identify HPSC subsets from a representative CD34-enriched bone marrow sample from a healthy donor. Shown is representative of 3 donors. Immunophenotype of the HSPCs is as follows: CD34+CD38CD90+CD45RA (hematopoietic stem cells, HSCs); CD34+CD38CD90CD45RA (multipotent progenitors, MPPs); CD34+CD38CD90CD45RA+ multilymphoid progenitors, MLPs); CD34+CD38+CD10+ (common lymphoid progenitors, CLPs); CD34+CD38+CD10CD123CD45RA (megakaryocyte-erythroid progenitors, MEPs); CD34+CD38+CD10CD123+CD45RA (common myeloid progenitors, CMPs); CD34+CD38+CD10CD123+CD45RA+ (granulocyte monocyte progenitors, GMPs). (B) Histogram of FOLR1 expression in normal HSPC subsets. (C) Quantification of percentage FOLR1+ among C/G-CB cells (>12 weeks of EC coculture) and HSPC subsets from 3 CD34-enriched samples from healthy donors. (D) Percentage specific lysis in C/G-CB cells and the HSPC subsets shown in C following 4-hour incubation with unmodified or FOLR1 CAR T cells at a 2:1 E:T ratio. Note that data points for C/G-CB cells are from 2 technical replicates. Only 2 out of 3 normal CD34+ samples were used in this experiment. (E and F) After 4 hours, cocultures of healthy donor CD34+ or C/G-CB cells with either unmodified or FOLR1 CAR T cells at a 2:1 E:T ratio were transferred to methylcellulose with cytokines for colony-forming cell (CFC) assay. (E) Colonies derived from erythroid (E), granulocyte-macrophage (G, M, and GM), and multipotential granulocyte, erythroid, macrophage, megakaryocyte (GEMM) progenitors were scored and enumerated after 7 to 10 days. (F) Total colonies from C/G-CB cells are tabulated. Data are presented as mean ± SD from 3 technical replicates for each donor. No significant difference was detected between cocultures with unmodified T cells versus FOLR1 CAR T cells for normal HSPCs for each colony type. Statistical significance was determined by 1-way ANOVA. ***P < 0.0005.

References

    1. Bolouri H, et al. Publisher Correction: The molecular landscape of pediatric acute myeloid leukemia reveals recurrent structural alterations and age-specific mutational interactions. Nat Med. 2019;25(3):530. - PMC - PubMed
    1. Gruber TA, et al. An Inv(16)(p13.3q24.3)-encoded CBFA2T3-GLIS2 fusion protein defines an aggressive subtype of pediatric acute megakaryoblastic leukemia. Cancer Cell. 2012;22(5):683–697. doi: 10.1016/j.ccr.2012.10.007. - DOI - PMC - PubMed
    1. Salomon-Nguyen F, et al. AML1-MTG16 fusion gene in therapy-related acute leukemia with t(16;21)(q24;q22): two new cases. Leukemia. 2000;14(9):1704–1705. doi: 10.1038/sj.leu.2401885. - DOI - PubMed
    1. Lamar E, et al. Identification of NKL, a novel Gli-Kruppel zinc-finger protein that promotes neuronal differentiation. Development. 2001;128(8):1335–1346. doi: 10.1242/dev.128.8.1335. - DOI - PubMed
    1. Kim YS, et al. The Krüppel-like zinc finger protein Glis2 functions as a negative modulator of the Wnt/beta-catenin signaling pathway. FEBS Lett. 2007;581(5):858–864. doi: 10.1016/j.febslet.2007.01.058. - DOI - PMC - PubMed

Publication types

Substances