. 2022 Sep 22;13(9):814.
doi: 10.1038/s41419-022-05251-4.

Resistance to tyrosine kinase inhibitors promotes renal cancer progression through MCPIP1 tumor-suppressor downregulation and c-Met activation

Affiliations

Resistance to tyrosine kinase inhibitors promotes renal cancer progression through MCPIP1 tumor-suppressor downregulation and c-Met activation

Paulina Marona et al. Cell Death Dis. .

Abstract

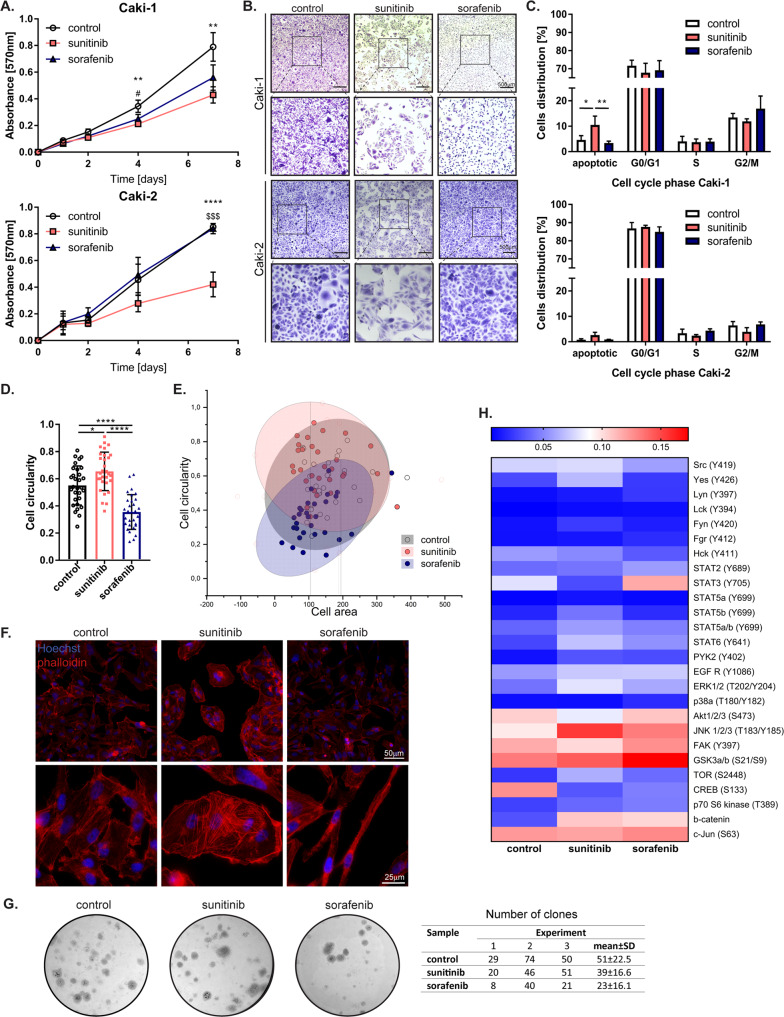
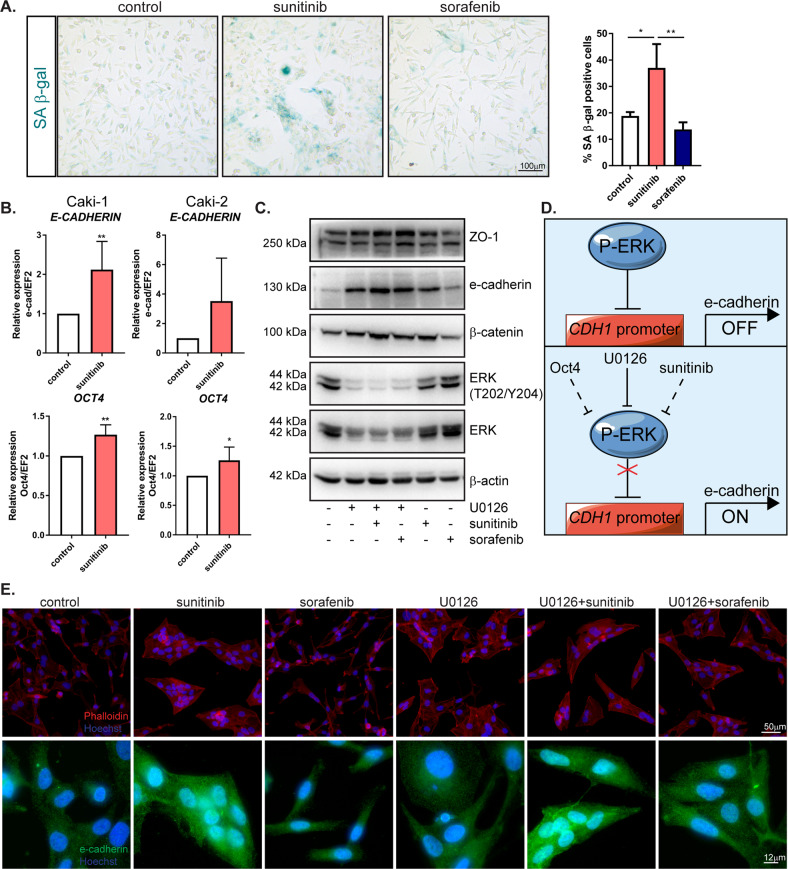
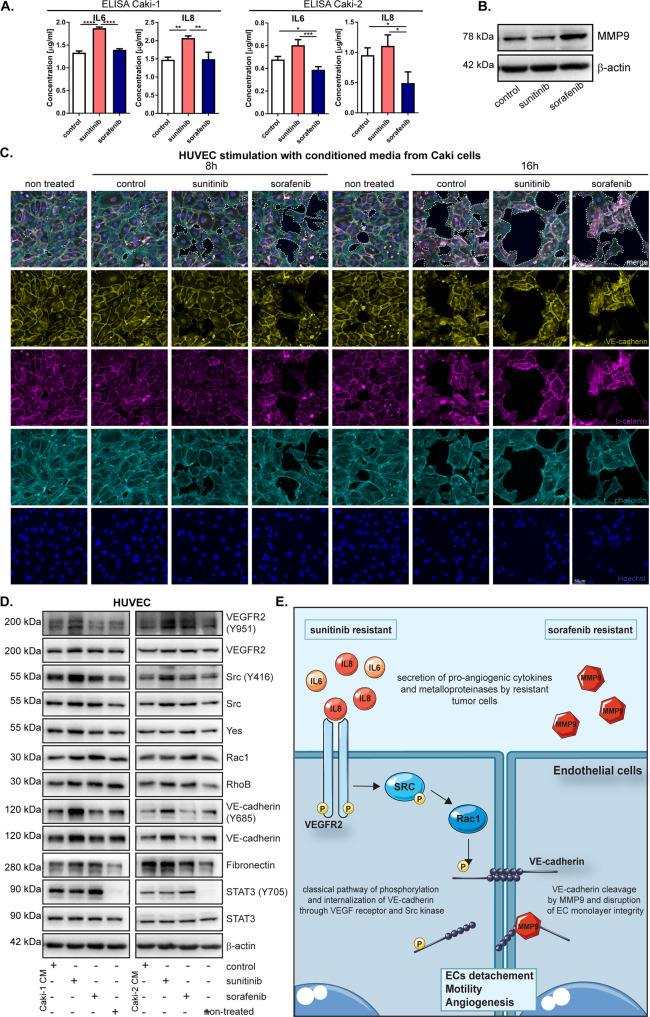
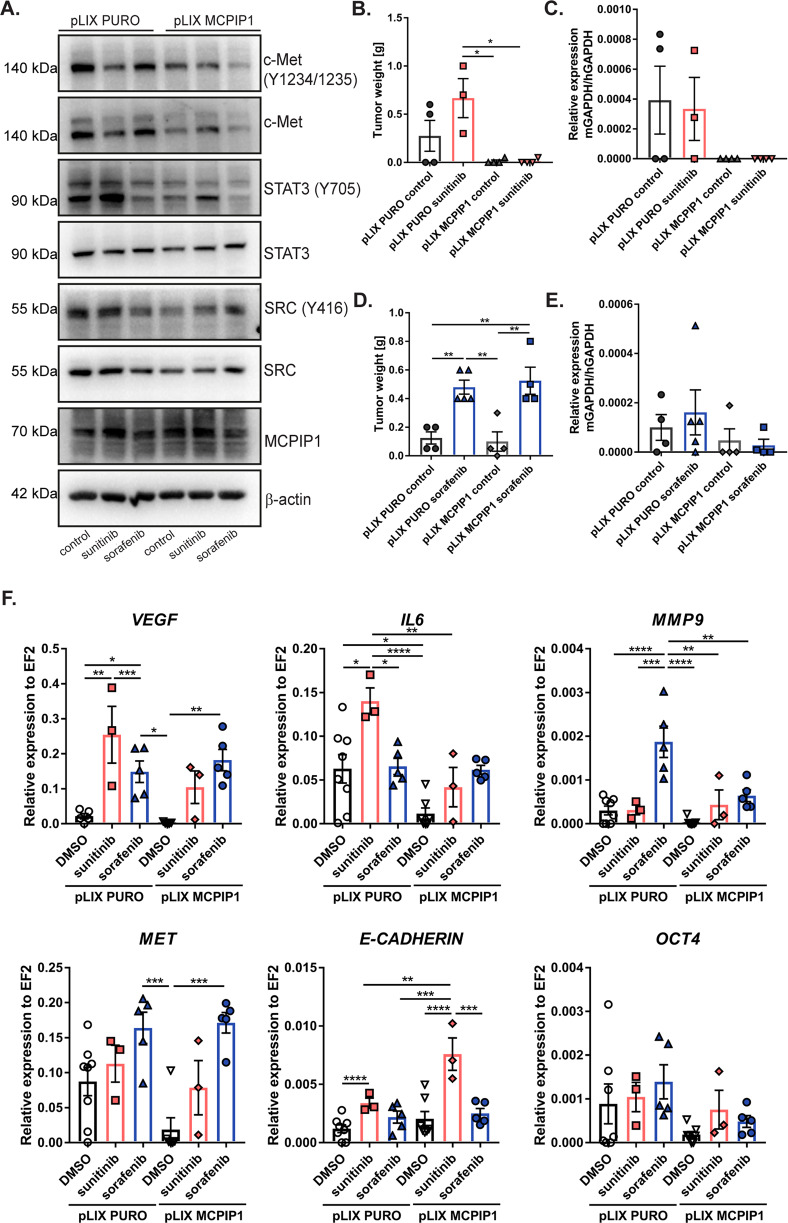
Tyrosine kinase inhibitors (TKIs) are the most commonly used targeted therapeutics in clear-cell renal cell carcinoma (ccRCC); however, drug resistance limits their utility and can lead to tumor "flare-up" and progression. In this study, we show that RCC resistance to sunitinib and sorafenib involves different mechanisms and leads to increased malignancy. Sunitinib decreased tumor growth and cell motility along with increased E-cadherin expression and secretion of the proangiogenic cytokines IL6 and IL8, which activated senescence in ccRCC cells and led to VE-cadherin phosphorylation, enhancing tumor angiogenesis. Sorafenib resistance increased the levels of mesenchymal markers and the secretion of MMP9, which cleaved VE-cadherin and disrupted endothelial cell integrity. Both sunitinib resistance and sorafenib resistance led to activation of the c-Met receptor IRAK1 and downregulation of the tumor suppressor MCPIP1, resulting in an increase in the metastasis of resistant cells, possibly due in part to enhanced vascularization of ccRCC. MCPIP1 overexpression partially overcame resistance to these drugs by decreasing micrometastasis and decreasing the expression of factors involved in tumorigenesis. In tumor samples from ccRCC patients, we observed a significant increase in the level of the c-Met receptor, IRAK1 and a decrease in MCPIP1 with respect to normal kidney tissue. Our results indicate separate novel mechanisms for sunitinib and sorafenib resistance, which both lead to MCPIP1 inhibition and ccRCC progression. The presented study suggests caution in the treatment of RCC with TKIs, which may lead to the unintended outcome of tumor progression.


Conflict of interest statement

The authors declare no competing interests.

Figures

Fig. 1
Fig. 1. Effect of drugs on ccRCC viability, cell cycle, and morphology.
A MTT assay on Caki-1 and Caki-2 cells treated 7 days with DMSO (control), sunitinib or sorafenib. The results are presented as the triplicate mean ± SD of three independent experiments. P values were estimated using one-way ANOVA with post hoc Tukey’s multiple comparison test. #P < 0.05 control vs sorafenib; **P < 0.01; ****P < 0,0001 control vs sunitinib; $$$P < 0,001 sunitinib vs sorafenib. B Representative images of crystal violet stained Caki-1 and Caki-2 cells after 96-h stimulation with drugs. C Calculation of Caki-1 cells distribution between cell-cycle phases. The results are presented as the mean ± SD of three independent experiments. P values were estimated using two-way ANOVA with post hoc Tukey’s multiple comparison test. D Quantification of Caki-1 cell shape after 7 days of treatment. N = 30 per group. The results are presented as the means ± SD. P values were estimated using one-way ANOVA with post hoc Tukey’s multiple comparison test. E Correlation between cell shape and cell area presented with 2D Confidence Ellipse (confidence level 95%). N = 30 per group. F Representative images after immunofluorescence staining for phalloidin and Hoechst, of Caki-1 cells after 7 days stimulation with DMSO, sunitinib or sorafenib. G Representative images of clones formed by resistant Caki-1 cells, stained with crystal violet. Table with the number of clones in three independent experiments. All clones were counted from each cell-culture well. The final result is presented in the last column as mean ± SD. H Heatmap representing mean of densitometric values from proteome-profiler analysis. All experiments were performed three times. *P < 0.05; **P < 0.01; ***P < 0.001; ****P < 0.0001.
Fig. 2
Fig. 2. Effect of sorafenib on EMT.
A Representative images after 0 and 16 h (upper panel) of migratory paths during a 16-h time-lapse recording, N = 18 cells for each treatment (lower panel). B Quantification of the distance traveled by Caki-1 cells during the 16-h experiment. C Quantification of the speed of Caki-1 cells during the 16-h experiment. The results are presented as the mean ± SD of three independent experiments, with the number of cells analyzed for each cell line, N = 55. D mRNA level of EMT markers in Caki-1 cells after 24 h treatment with drugs, quantified with real-time PCR. E mRNA level of EMT markers in Caki-2 cells after 24 h treatment with drugs, quantified with real-time PCR. The results are presented as the mean ± SD of three independent experiments. P values were estimated using One-way ANOVA with post hoc Tukey’s multiple comparison test. *P < 0.05; **P < 0.01; ***P < 0.001; ****P < 0.0001.
Fig. 3
Fig. 3. Mechanism of sunitinib resistance.
A Representative images after SA β-gal staining on Caki-1 cells after 1 week of drug treatment. The graph represents the quantification of SA β-gal positive cells to all cells. B mRNA level of E-CADHERIN and OCT4 in Caki-1 and Caki-2 cells after 24 h treatment with drugs, quantified with real-time PCR. The results are presented as the mean ± SD of three independent experiments. P values were estimated using one-way ANOVA with post hoc Tukey’s multiple comparison test. *P < 0.05; **P < 0.01; ***P < 0.001. C Representative western blot of Caki-1 cells after 24-h treatment with the ERK inhibitor U0126 or in combination with sunitinib or sorafenib. β-actin was used as a loading control. D Schematic representation of the role of ERK in E-cadherin expression. ERK phosphorylation inhibits the CDH1 promoter which leads to decreased E-cadherin expression. ERK activity might be blocked directly by specific inhibitor U0126 or indirectly by Oct4 or sunitinib. E Representative images after immunofluorescence staining of phalloidin and E-cadherin on Caki-1 cells after 24-h treatment with U0126, sunitinib or sorafenib. Hoechst was used to visualize nuclei. Experiments were performed at least three times.
Fig. 4
Fig. 4. Effect of sunitinib and sorafenib resistance on tumor growth, metastasis, and angiogenesis.
A Schematic representation of in vivo experiments. GFP-positive Caki-1 cells were treated with drugs constantly for 3 weeks. After a 7-day break to increase the cell number, cells were treated for the next 7 days. Next, resistant cells were harvested and mixed with wild-type Caki-1 in a 1:1 ratio and injected subcutaneously into NOD-SCID mice. B Effect of drug resistance on tumor volume (left graph) and tumor weight (right graph). control, N = 18; sunitinib, N = 16; sorafenib, N = 18. C mRNA analysis of lung metastasis using real-time PCR. N = 17 for each group except sorafenib, N = 18. D Representative merged images of bright-field and GFP fluorescence (upper panel) or only GFP fluorescence (lower panel) of tumor sections E Percentage quantification of GFP-positive tumor area to total tumor area in tumor sections, N = 6 control; N = 8 sunitinib; N = 7 sorafenib. F Percentage of tumor-free mice after cancer-cell injection. P value summary ** calculated with Log-rank (Mantel–Cox) test, N = 18 per group. G, H Representative images after immunofluorescence staining of CD31 (G) and ICAM-1 (H). I CD31 IHC staining of tumor sections and quantification of functional vessels with a visible lumen. J mRNA level of MMP9 and IL8 in tumors, quantified with real-time PCR. IL8, N = 10 per group, MMP9, N = 5. K The level of secreted IL8 in mouse plasma obtained using ELISA, N = 8 per group. Tumors were collected 6 weeks after s.c. injection of RCC cells. The results are presented as the mean ± SEM. P values were estimated using One-way ANOVA with post hoc Tukey’s multiple comparison test, except MMP9 where the Student’s t test was used. *P < 0.05; **P < 0.01.
Fig. 5
Fig. 5. Effect of conditioned medium from drug-resistant ccRCC cells on endothelial cells activity.
A The levels of secreted IL6 and IL8 in conditioned media from resistant Caki cells, measured by ELISA. B Representative western blot of MMP9 in Caki-1 cells after 7 days treatment with drugs with β-actin as a loading control. C Representative merged images after immunofluorescence staining of HUVEC cells after 8 or 16 h of treatment with conditioned media from Caki-2 cells, treated 7 days with sunitinib or sorafenib. Dotted lines show borders of monolayer disruption. D Representative Western Blot of HUVEC cells, after 3 h stimulation with conditioned media from Caki-1 or Caki-2 cell lines, treated 7 days with drugs. β-actin was used as a loading controls. E Schematic representation of sunitinib and sorafenib resistance. Sunitinib-resistant cells secrete high amounts of IL8 and IL6 which activates a signaling pathway from VEGFR2 through SRC, which leads to VE-cadherin internalization, loss of cell-cell contact and increased motility. Sorafenib-resistant RCC cells secrete high amount of MMP9, which cleaves VE-cadherin and leads to disruption of ECs monolayer integrity.
Fig. 6
Fig. 6. Effect of drugs treatment on MCPIP1, IRAK1, and c-Met receptor.
A Western blot from resistant tumor specimens, collected 6 weeks after resistant RCC cell injections, with GAPDH as the loading control. N = 5 per group. B Densitometric quantification of resistant tumor samples. The results are presented as the mean ± SEM. P-Met, c-Met, MCPIP1 graphs: N = 10 per group; E-cadherin graph: N = 8 per group. C Representative western blot of Caki cells after 3 weeks of treatment with SU11274, sunitinib or sorafenib, with α-tubulin as a loading control. Densitometric analysis of MCPIP1 protein level. D Western blot of Caki cells after 24 h treatment with sunitinib or sorafenib with β-actin as a loading control. Densitometric quantification of western blot results. The results are presented as the mean ± SEM. P values were estimated using one-way ANOVA with post hoc Tukey’s multiple comparison test. *P < 0.05; **P < 0.01; ***P < 0.001; ****P < 0.0001. E Images of immunofluorescence staining of Caki-1 cells after one week of treatment with sunitinib or sorafenib. Nuclei visualized with Hoechst.
Fig. 7
Fig. 7. MCPIP1 in overcoming drug resistance.
A Western blot of MCPIP1-overexpressing Caki-1 cells after 24 h treatment with drugs; β-actin was used as a loading control. B Effect of sunitinib resistance and MCPIP1 overexpression on tumor weight. C mRNA analysis of lung metastasis using real-time PCR. The results are presented as the mean ± SEM. N = 4 for each group except pLIX-PURO-sunitinib, where N = 3. D Effect of sorafenib resistance and MCPIP1 overexpression on tumor weight. E mRNA analysis of lung metastasis using real-time PCR. The results are presented as the mean ± SEM. pLIX-PURO-control, N = 4; pLIX-PURO-sorafenib, N = 5; pLIX-MCPIP1-control, N = 4; pLIX-MCPIP1-sorafenib, N = 4. F mRNA analysis of tumor tissue samples. The results are presented as the mean ± SEM. pLIX-PURO-control, N = 8; pLIX-PURO-sunitinib, N = 3; pLIX-PURO-sorafenib, N = 5; pLIX-MCPIP1-control, N = 8; pLIX-MCPIP1-sunitinib, N = 3; pLIX-MCPIP1-sorafenib, N = 4. In vitro experiments were performed at least three times. P values were estimated using one-way ANOVA with post hoc Tukey’s multiple comparison test. *P < 0.05; **P < 0.01; ***P < 0.001; ****P < 0.0001.
Fig. 8
Fig. 8. The levels of MCPIP1, IRAK1, and c-Met receptor in tumor tissue samples from ccRCC patients.
A Quantification of the protein level of 51 tumor samples (assessed by western blot), divided into four groups according to tumor grade. B Heatmap showing the correlation between western blot and microarray analysis from the same patient tissue samples. Each row represents an individual tissue sample. N I = 14, N II = 14, N III = 10, N IV = 13. C Quantification of the signal from microarray. Statistical analysis was performed using one-way ANOVA between subjects (unpaired) where N = 15 per group. D Western blot analysis of IRAK-1 in patient tissue samples (N - normal tissue; T - tumor tissue) with β-actin as a loading control. E Proteome-profiler analysis from 20 patient tissue samples (N = 5 per each group, except group III where N = 4). Each dot from the arrays represents one sample from grade I/II and grade III/IV patient tumor. P values were estimated using two-tailed unpaired Student’s t test. *P < 0.05; **P < 0.01; ***P < 0.001; ****P < 0.0001.

References

    1. Makhov P, Joshi S, Ghatalia P, Kutikov A, Uzzo RG, Kolenko VM. Resistance to systemic therapies in clear cell renal cell carcinoma: mechanisms and management strategies. Mol Cancer Ther. 2018;17:1355–64. doi: 10.1158/1535-7163.MCT-17-1299. - DOI - PMC - PubMed
    1. Siegel RL, Miller KD, Jemal A. Cancer statistics, 2017. CA Cancer J Clin. 2017;67:7–30. doi: 10.3322/caac.21387. - DOI - PubMed
    1. Motzer RJ, Nosov D, Eisen T, Bondarenko I, Lesovoy V, Lipatov O, et al. Tivozanib versus sorafenib as initial targeted therapy for patients with metastatic renal cell carcinoma: results from a phase III trial. J Clin Oncol. 2013;31:3791–9. doi: 10.1200/JCO.2012.47.4940. - DOI - PMC - PubMed
    1. Motzer RJ, Hutson TE, Cella D, Reeves J, Hawkins R, Guo J, et al. Pazopanib versus sunitinib in metastatic renal-cell carcinoma. N Engl J Med. 2013;369:722–31. doi: 10.1056/NEJMoa1303989. - DOI - PubMed
    1. Motzer RJ, Escudier B, Tomczak P, Hutson TE, Michaelson MD, Negrier S, et al. Axitinib versus sorafenib as second-line treatment for advanced renal cell carcinoma: overall survival analysis and updated results from a randomised phase 3 trial. Lancet Oncol. 2013;14:552–62. doi: 10.1016/S1470-2045(13)70093-7. - DOI - PubMed

Publication types

MeSH terms