Meta-Analysis
. 2022 Sep 23;8(1):73.
doi: 10.1038/s41522-022-00337-5.

A meta-analysis of acetogenic and methanogenic microbiomes in microbial electrosynthesis

Affiliations
Meta-Analysis

A meta-analysis of acetogenic and methanogenic microbiomes in microbial electrosynthesis

Simon Mills et al. NPJ Biofilms Microbiomes. .

Abstract

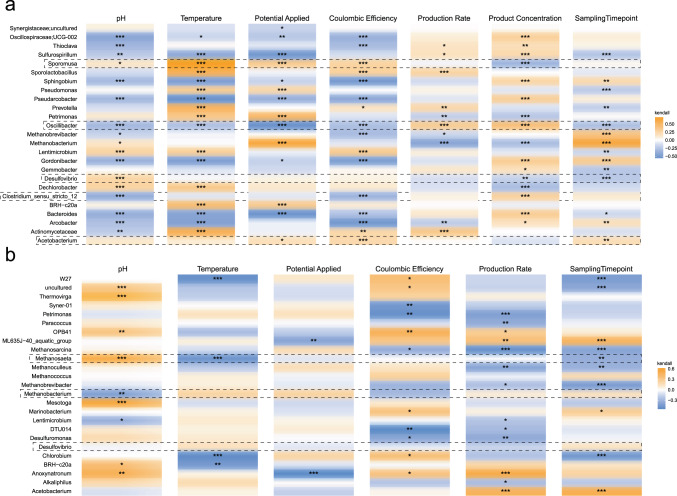
A meta-analysis approach was used, to study the microbiomes of biofilms and planktonic communities underpinning microbial electrosynthesis (MES) cells. High-throughput DNA sequencing of 16S rRNA gene amplicons has been increasingly applied to understand MES systems. In this meta-analysis of 22 studies, we find that acetogenic and methanogenic MES cells share 80% of a cathodic core microbiome, and that different inoculum pre-treatments strongly affect community composition. Oxygen scavengers were more abundant in planktonic communities, and several key organisms were associated with operating parameters and good cell performance. We suggest Desulfovibrio sp. play a role in initiating early biofilm development and shaping microbial communities by catalysing H2 production, to sustain either Acetobacterium sp. or Methanobacterium sp. Microbial community assembly became more stochastic over time, causing diversification of the biofilm (cathodic) community in acetogenic cells and leading to re-establishment of methanogens, despite inoculum pre-treatments. This suggests that repeated interventions may be required to suppress methanogenesis.


Conflict of interest statement

The authors declare no competing interests.

Figures

Fig. 1
Fig. 1. Comparison of cathodic and planktonic microbial communities.
a Alpha Diversity Indices; Pielou’s Evenness, Rarefied Richness and Shannon Entropy for cathodic and planktonic communities in acetogenic and methanogenic cells. In the boxplots, center value lines indicate the median, boxes indicate the lower/upper quartiles (25%/75%) and lines extending parallel from the boxes (whiskers) show the variability outside the upper and lower quartiles. Lines of significance depict significant differences as follows: * (p < 0.05), ** (p < 0.01), or *** (p < 0.001) based on ANOVA. b Principal Component Analysis (Weighted Unifrac) of cathodic and planktonic communities in acetogenic and methanogenic cells, where ellipses were drawn using 95% confidence intervals based on standard deviation. c Heat Trees depicting differential abundances of taxa among the groups in question. The circle size and the colour intensity reflect the species abundance and the log2 median proportion between the two groups respectively.
Fig. 2
Fig. 2. Core microbiomes of acetogenic and methanogenic MES cells.
a Highly prevalent taxa in the core microbiomes of (a) acetogenic cathodic, b methanogenic cathodic and c acetogenic planktonic communities. Detection thresholds (number of reads) are shown on the y-axis.
Fig. 3
Fig. 3. Effect on inoculum pre-treatment on the microbial communities in MES cells.
a Principal Component Analysis (Weighted Unifrac) showing acetogenic and methanogenic samples clustered by pretreatment method where ellipses were drawn using 95% confidence intervals based on standard deviation. b Differential heat tree depicting differently abundant taxa between two groups based on seeding strategy (heat shocked activated sludge Vs BESA treated anaerobic sludge). The circle size and the colour intensity reflect the species abundance and the log2 median proportion between the two groups respectively. c Differential heat tree depicting differently abundant taxa between two groups based on seeding strategy (untreated anaerobic sludge Vs BESA treated anaerobic sludge). The circle size and the colour intensity reflect the species abundance and the log2 median proportion between the two groups respectively. Full size, high-resolution heat trees are provided in the Supplementary Information (Supplementary Figs. 6, 7).
Fig. 4
Fig. 4. Correlation between taxa and environmental parameters.
Correlation heatmap of the 25 most abundant genera from (a) acetogenic, and (b) methanogenic cells with environmental variables. Kendall correlations between the taxa and the environmental variables were calculated. Significance levels are indicated by asterisks as *(p < 0.05), **(p < 0.01) or ***(p < 0.001).
Fig. 5
Fig. 5. Community assembly processes in cathodic acetogenic communities.
a Alpha Diversity Indices; Pielou’s Evenness, Rarefied Richness and Shannon Entropy for cathodic acetogenic communities. In the boxplots, center value lines indicate the median, boxes indicate the lower/upper quartiles (25%/75%) and lines extending parallel from the boxes (whiskers) show the variability outside the upper and lower quartiles. Lines of significance depict significant differences as follows: * (p < 0.05), ** (p < 0.01), or *** (p < 0.001) based on ANOVA. b Normalized stochasticity ratio (NST) using Ružička metric and Taxa-Richness constraints of proportional-fixed (P-F) and proportional-proportional (P-P) which stipulates that the probabilities of taxa occurrence are proportional to the observed occurrence frequencies, and taxon richness in each sample is either fixed or proportional. c Scatter plot indicating winner diversity and winner prevelance for genera exhibiting lottery model-like behaviour (a genera member makes up >90% of the genera’s abundance). Samples in each panel are grouped into four time periods 0–50 d, 51–100 d, 101–200 d and 200 + d.
Fig. 6
Fig. 6. Yearly distribution of articles on MES cells featuring microbial community analysis via high-throughput sequencing (Miseq/Hiseq) with universal primers.
Suitable publicly available data, along with data requested and obtained from the Authors, was included to the meta-data table. Data from 2021 includes only studies published by June.

References

    1. Grim RG, et al. Transforming the carbon economy: challenges and opportunities in the convergence of low-cost electricity and reductive CO2 utilization. Energy Environ. Sci. 2020;13:472–494.
    1. Karthikeyan R, Singh R, Bose A. Microbial electron uptake in microbial electrosynthesis: a mini-review. J. Ind. Microbiol. Biotechnol. 2019;46:1419–1426. - PubMed
    1. Dessì P, et al. Microbial electrosynthesis: Towards sustainable biorefineries for production of green chemicals from CO2 emissions. Biotechnol. Adv. 2021;46:107675. - PubMed
    1. Jourdin L, Freguia S, Flexer V, Keller J. Bringing high-rate, CO2‑based microbial electrosynthesis closer to practical implementation through improved electrode design and operating conditions. Environ. Sci. Technol. 2016;50:1982–1989. - PubMed
    1. Claassens NJ, Cotton CAR, Kopljar D, Bar-Even A. Making quantitative sense of electromicrobial production. Nat. Catal. 2019;2:437–447.

Publication types