. 2022 Nov;28(11):2309-2320.
doi: 10.1038/s41591-022-01980-3. Epub 2022 Sep 22.

Metabolomic profiles predict individual multidisease outcomes

Affiliations

Metabolomic profiles predict individual multidisease outcomes

Thore Buergel et al. Nat Med. 2022 Nov.

Abstract

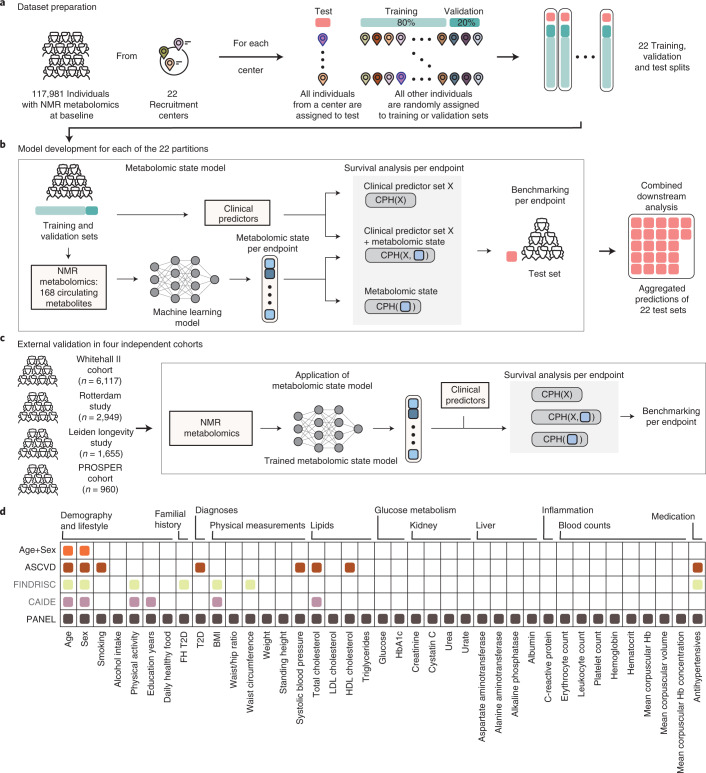
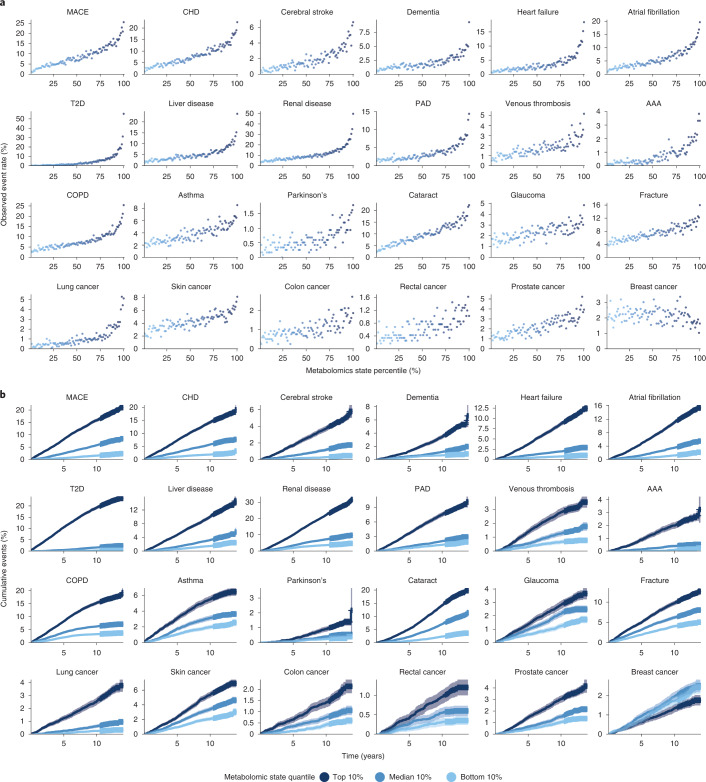
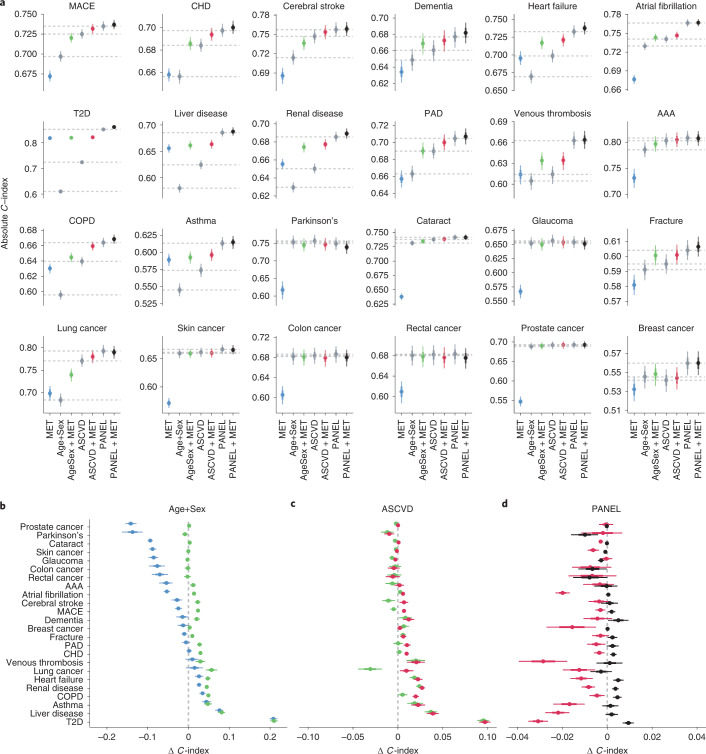
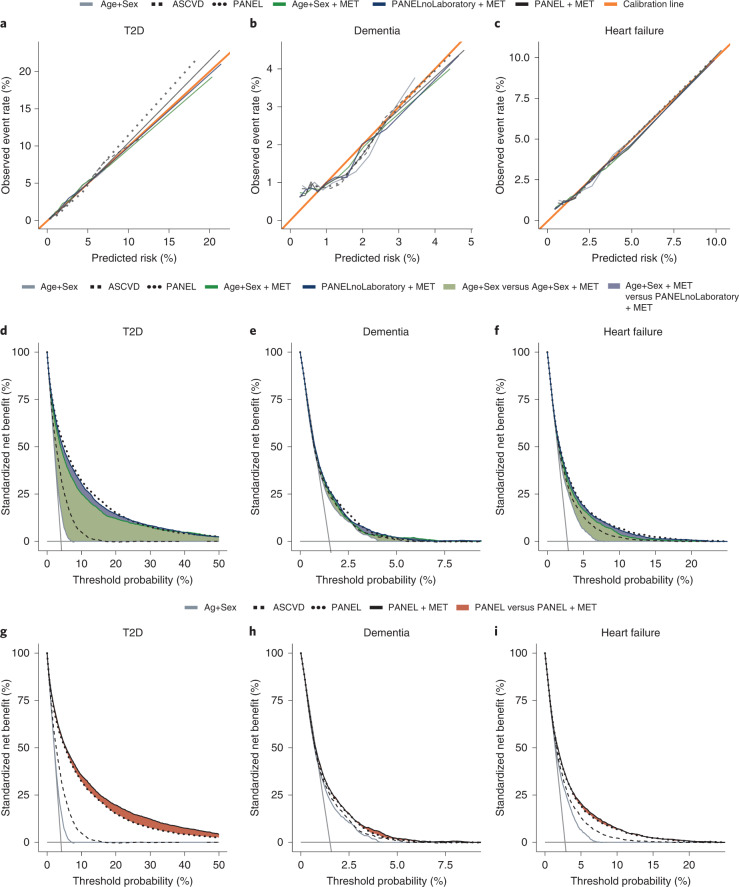
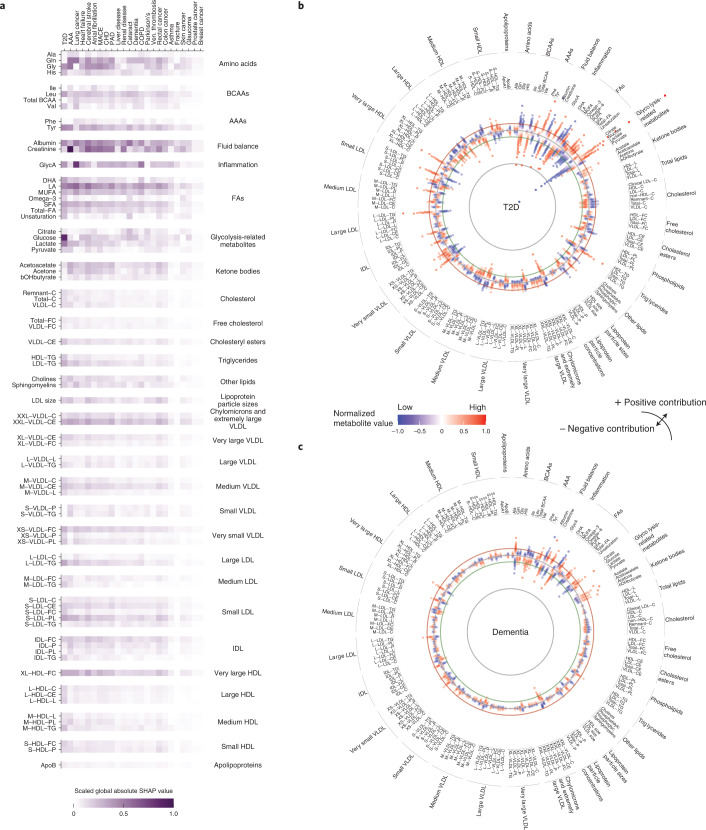
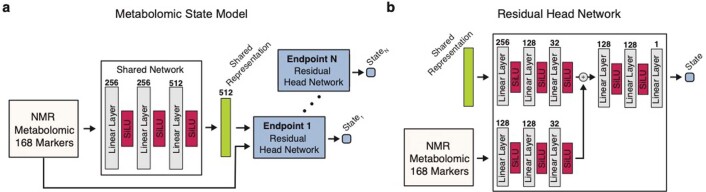
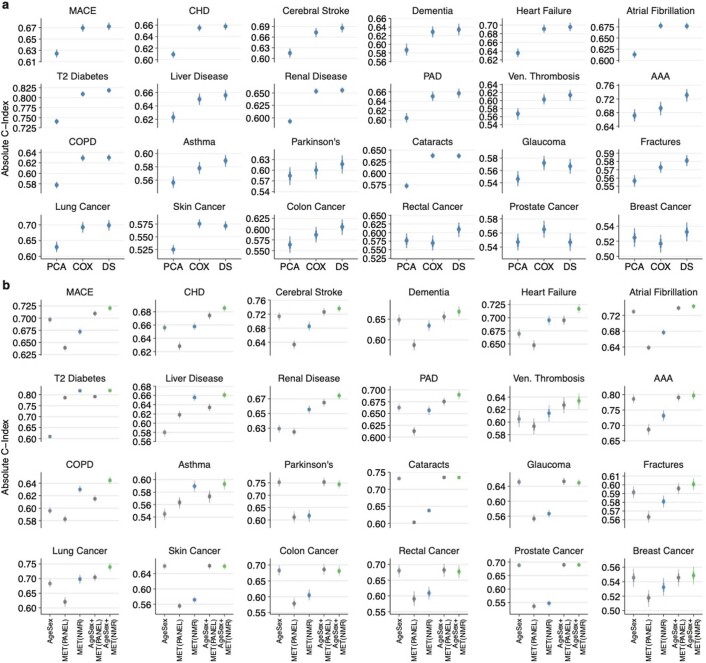
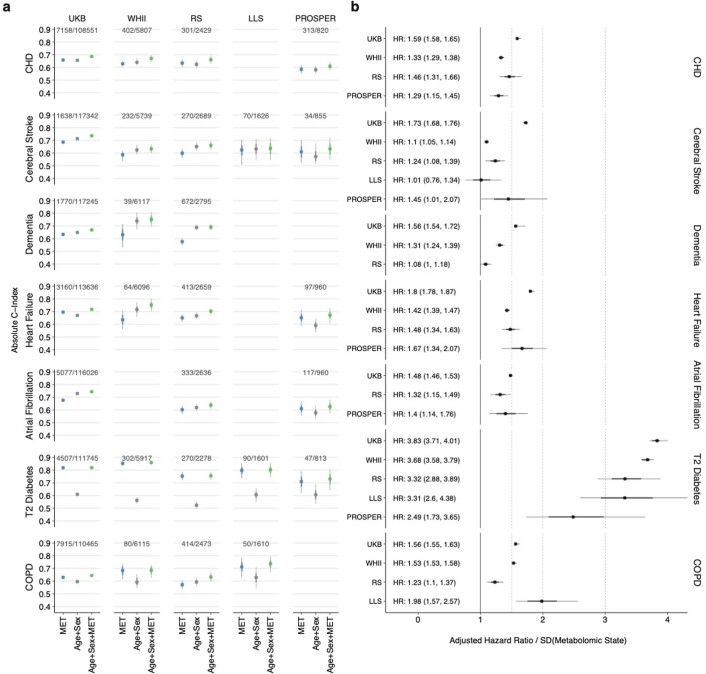
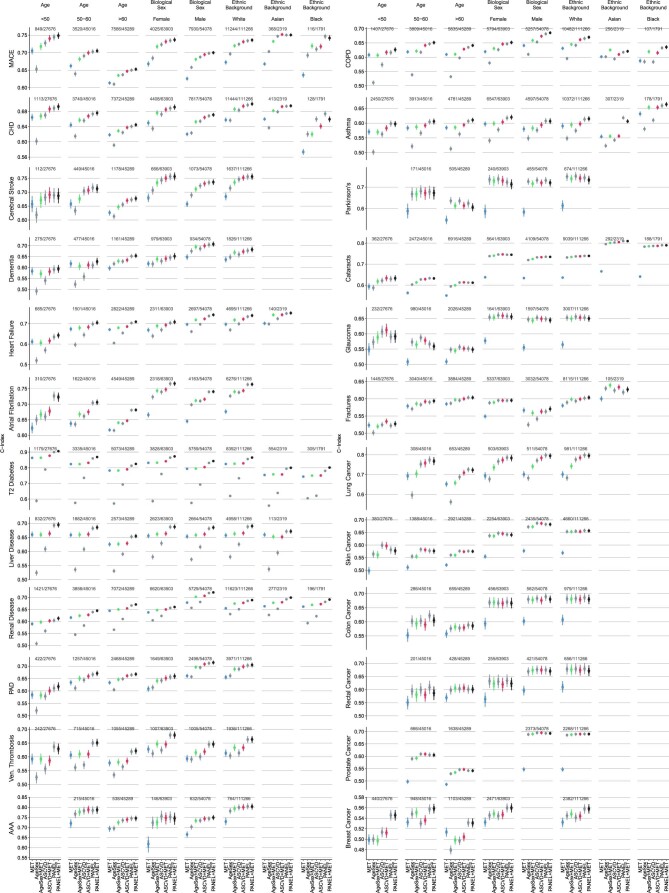
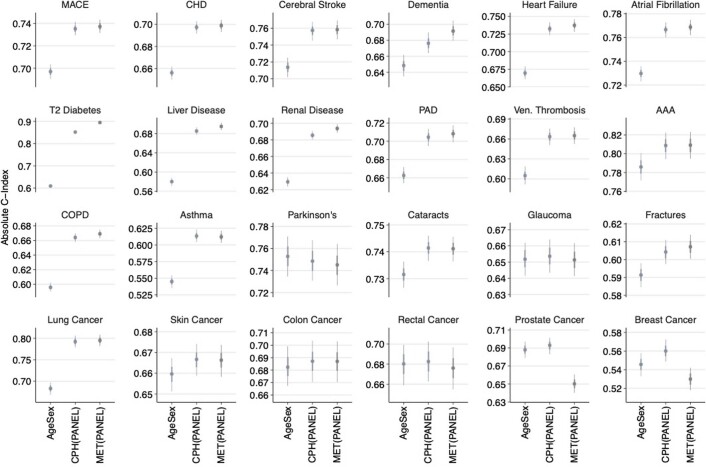
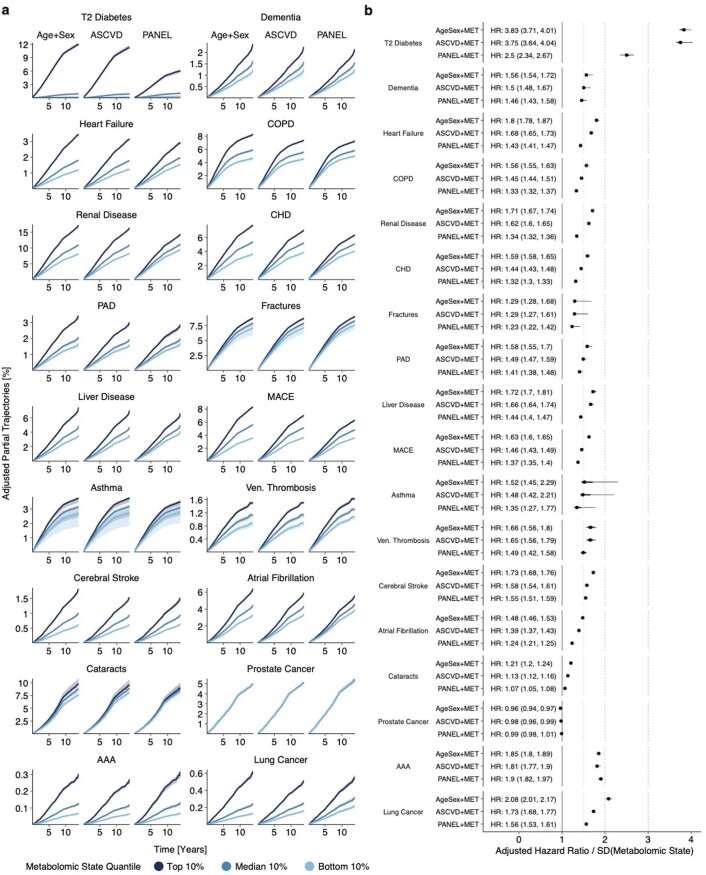
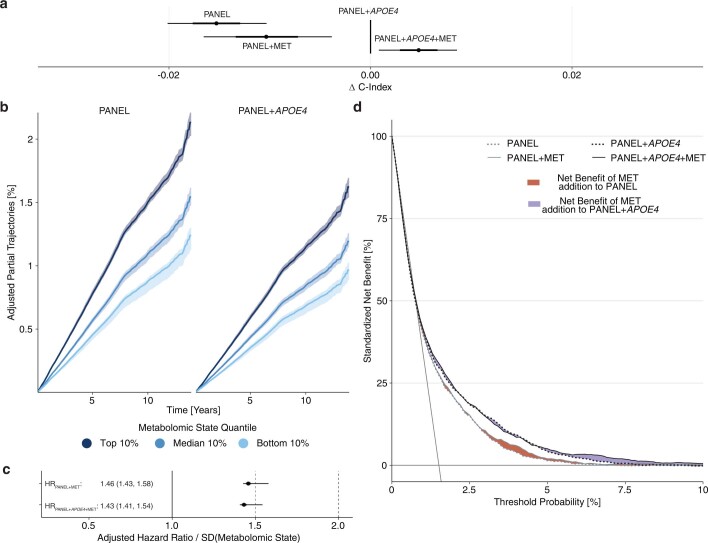
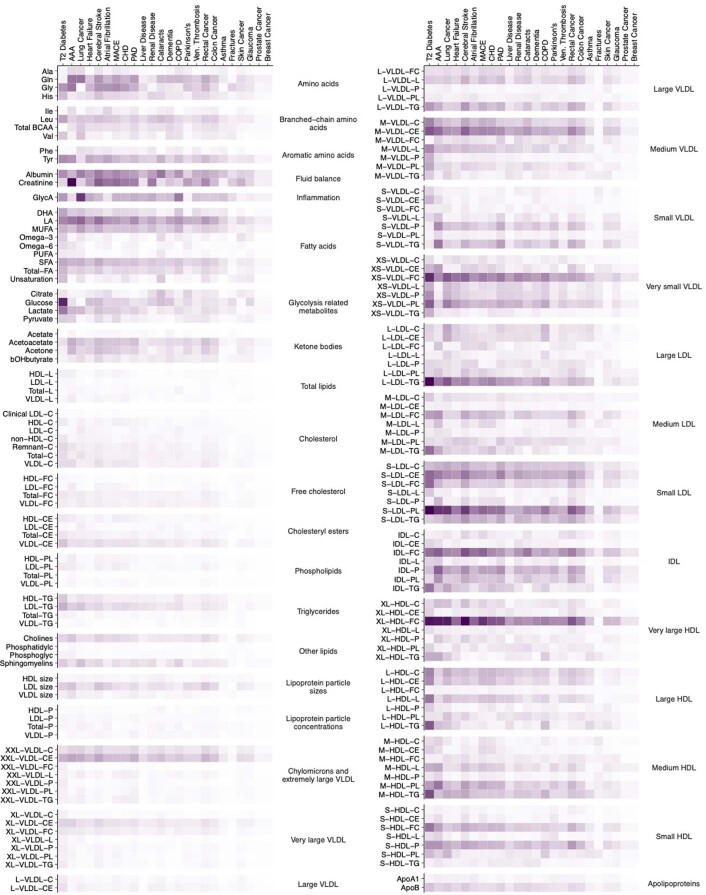
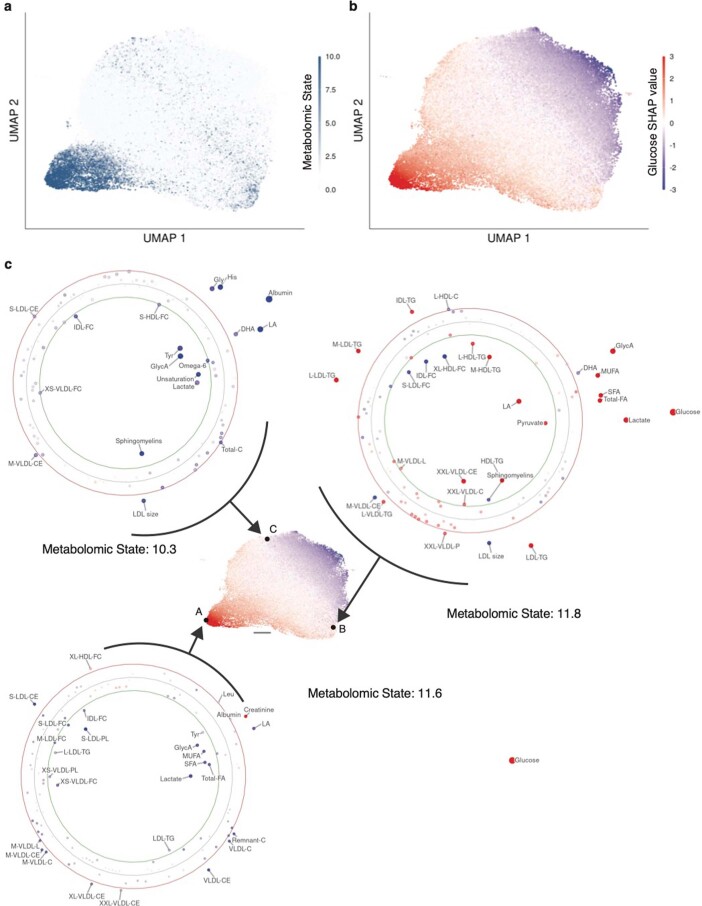
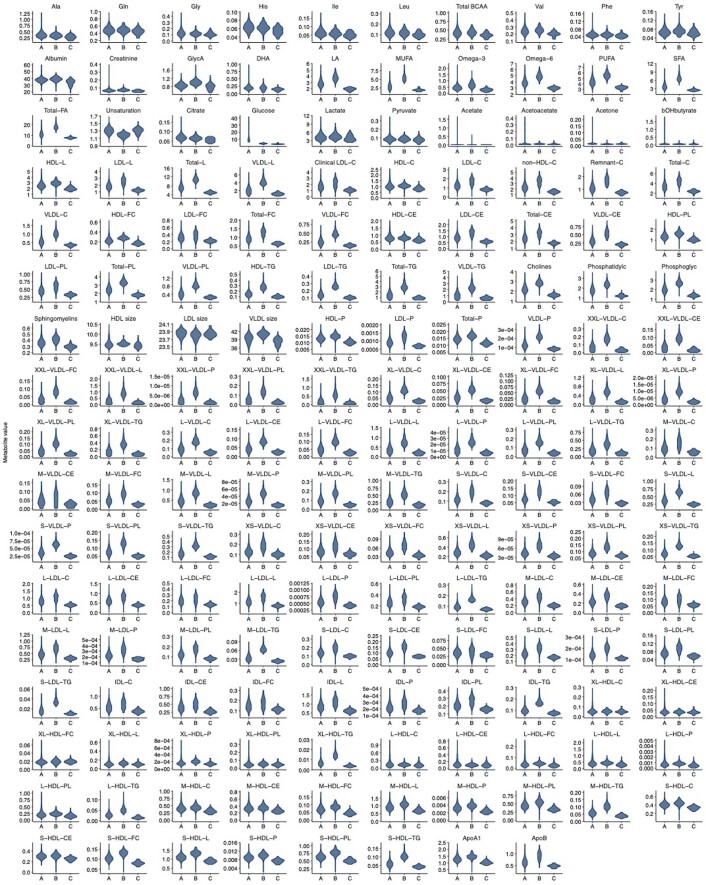
Risk stratification is critical for the early identification of high-risk individuals and disease prevention. Here we explored the potential of nuclear magnetic resonance (NMR) spectroscopy-derived metabolomic profiles to inform on multidisease risk beyond conventional clinical predictors for the onset of 24 common conditions, including metabolic, vascular, respiratory, musculoskeletal and neurological diseases and cancers. Specifically, we trained a neural network to learn disease-specific metabolomic states from 168 circulating metabolic markers measured in 117,981 participants with ~1.4 million person-years of follow-up from the UK Biobank and validated the model in four independent cohorts. We found metabolomic states to be associated with incident event rates in all the investigated conditions, except breast cancer. For 10-year outcome prediction for 15 endpoints, with and without established metabolic contribution, a combination of age and sex and the metabolomic state equaled or outperformed established predictors. Moreover, metabolomic state added predictive information over comprehensive clinical variables for eight common diseases, including type 2 diabetes, dementia and heart failure. Decision curve analyses showed that predictive improvements translated into clinical utility for a wide range of potential decision thresholds. Taken together, our study demonstrates both the potential and limitations of NMR-derived metabolomic profiles as a multidisease assay to inform on the risk of many common diseases simultaneously.


Conflict of interest statement

U.L. received grants from Bayer, Novartis and Amgen, consulting fees from Bayer, Sanofi, Amgen, Novartis and Daichy Sankyo and honoraria from Novartis, Sanofi, Bayer, Amgen and Daichy Sankyo. J.D. received consulting fees from GENinCode UK Ltd, honoraria from Amgen, Boehringer Ingelheim, Merck, Pfizer, Aegerion, Novartis, Sanofi, Takeda, Novo Nordisk and Bayer and is Chief Medical Advisor to Our Future Health. R.E. received honoraria from Sanofi and consulting fees from Boehringer Ingelheim. All other authors declare no competing interests.

Figures

Fig. 1
Fig. 1. Study overview.
a, To learn metabolomic states from circulating blood metabolites, the eligible UK Biobank population (with NMR blood metabolomics and valid consent) was split into training, validation and test sets with 22-fold nested cross-validation based on the assigned UK Biobank assessment center. b, For each of the 22 partitions, the metabolomic state model was trained on the 168 metabolomic markers to predict metabolomic risk against 24 common disease endpoints. Subsequently, for each endpoint, CPH models were developed on the metabolomic state in combination with sets of commonly available clinical predictors to model disease risk. Predictions of the CPH model on the test set were aggregated for downstream analysis. c, The metabolomic state model was externally validated in four independent cohorts—the Whitehall II cohort and three from the BBMRI-NL consortium: the Rotterdam Study, the Leiden Longevity Study and the PROSPER cohort. d, In this study we consider clinical predictors from scores commonly applied in primary prevention. We additionally integrate variables into a comprehensive predictor set (PANEL) to investigate overlapping information with the metabolomic state. FH, family history.
Fig. 2
Fig. 2. Metabolomic state is associated with ORs and stratifies survival.
a, Observed event frequency for incident disease plotted against metabolomic state percentiles over the entire study population for all 24 endpoints. b, Cumulative event rates over the observation time for all assessed endpoints, stratified by metabolomic state quantiles (light blue, bottom 10%; blue, median 10%; dark blue, top 10%), with 95% CIs indicated. PAD, peripheral artery disease.
Fig. 3
Fig. 3. Predictive value of the metabolomic state is endpoint dependent.
a, Comparison of discriminative performance of CPH models trained on the metabolomic state only (MET), the three clinical predictor sets (Age+Sex, ASCVD and PANEL) and the sets’ combinations with the metabolomic state. Horizontal dashed lines indicate the median performance of the three clinical predictor sets. b, Differences in discriminative performance between the Age+Sex baseline (dashed line), metabolomic state only (blue) and the combination of Age+Sex and metabolomic state (green). c, Differences in discriminative performance between ASCVD predictors (dashed line), the combination of Age+Sex and the metabolomic state (green) and the combination of metabolomic state and ASCVD predictors (red). d, Difference in discriminative performance between comprehensive PANEL predictors (dashed line), ASCVD + MET (red) and PANEL + MET (black). ad, Statistical measures were derived from n = 117.981 individuals; those with previous events were excluded (Supplementary Table 1). Data are presented as median (center of error bar) and 95% CI (line of error bar) determined by bootstrapping of with 1,000 iterations. bd, The x-axis range differs across panels; vertical grid lines indicate differences of 0.02 C-index.
Fig. 4
Fig. 4. Model calibration and additive predictive value of the metabolomic state translate to potential clinical utility.
ac, Calibration curves for CPH models, including baseline parameter sets Age+Sex, ASCVD and PANEL, as well as their combinations with the metabolomic state (Age+Sex + MET) for the endpoints T2D (a), dementia (b) and heart failure (c). df, Endpoint-specific net benefit curves standardized by endpoint prevalence, where horizontal solid gray lines indicate ‘treat none’ and vertical solid gray lines indicate ‘treat all’; T2D (d), dementia (e) and heart failure (f). The standardized net benefits of sets Age+Sex, ASCVD and PANEL are compared with Age+Sex + MET and additional non-laboratory predictors of PANEL (PANELnoLaboratory). Green and blue color-filled areas indicate the added benefit of the combination of the metabolomic state and Age+Sex and PANELnoLaboratory, respectively. gi, Standardized net benefit curves comparing the performance of PANEL + MET against baselines Age+Sex, ASCVD and PANEL; T2D (g), dementia (h) and heart failure (i). Decision curves were derived from n = 111,745 (T2D), n = 117,245 (dementia) and n = 113,636 (heart failure) individuals.
Fig. 5
Fig. 5. Analysis of the metabolomic state informs on metabolite profiles associated with disease risk.
a, Heatmap showing the importance of metabolites in regard to the estimated metabolomic states, represented by absolute global SHAP value estimates per endpoint for the 75 globally most important metabolites. Endpoints are sorted by the discriminative performance of the metabolomic state (left to right; Fig. 3a). b, Global metabolite attributions for T2D; individual attributions are aggregated by percentiles and each dot indicates one percentile. The more distant a dot from the circular baseline, the stronger the absolute attribution for that percentile. Deviations toward the center and periphery represent negative and positive contributions, respectively, to the metabolomic state. Colors indicate the metabolite’s mean plasma value. c, Global metabolite attributions for all-cause dementia. IDL, intermediate-density lipoprotein.
Extended Data Fig. 1
Extended Data Fig. 1. Details of the metabolomic state model.
a) Overview of the residual architecture of the metabolomic state model. 168 circulating metabolomic markers are fed to the shared trunk network to learn a common shared representation. Endpoint-specific head networks then predict the metabolomic state for each endpoint from the shared representation and the input using a residual connection. b) Details of the residual head network. The model architecture is described in detail in (Methods Section ‘Metabolomic state model’).
Extended Data Fig. 2
Extended Data Fig. 2. The metabolomic state model outperforms linear baselines on NMR-derived metabolite profiles, and NMR-derived metabolite profiles are more predictive than PANEL metabolites.
a) Displayed are C-indices for the Cox Proportional Hazards models trained on the metabolomic state (MET), the 168 metabolites (CPH) as well as on the first ten components of a PCA-reduction of the 168 metabolites (PCA) for each of the 24 investigated endpoints. The metabolomic state performs comparably or better than both the CPH and PCA models for all endpoints, except prostate cancer. b) Displayed are C-indices for Cox Proportional Hazards models trained on Age+Sex (Age+Sex), the metabolomic states derived from NMR metabolomics (MET(NMR)), the metabolomic states derived from the PANEL metabolites (MET(PANEL)) and combinations of Age+Sex and the metabolomic states respectively. NMR profiles provide predictive information comparable or superior to the PANEL metabolites for all investigated endpoints, also reflected in the predictive performance over the Age+Sex covariates. The MET(PANEL) set included albumin, cholesterol, HDL and LDL cholesterol, triglycerides, glucose, and creatinine. Statistical measures were derived from n = 117.981 individuals. Individuals with prior events were excluded (Supplementary Table 1). Data are presented as median (center of error bar) and 95% CI (line of error bar) determined by bootstrapping over 1000 iterations. PAD - Peripheral Artery Disease, AAA - Abdominal Aortic Aneurysm, COPD - Chronic Obstructive Pulmonary Disease.
Extended Data Fig. 3
Extended Data Fig. 3. External validation in four independent cohorts.
a) Displayed are discriminative performances described by the C-index for UK Biobank and the four external validation cohorts, Whitehall II (WHII), Rotterdam Study (RS), Leiden Longevity Study (LLS), and the PROSPER trial (PROSPER). CPH models were trained on the metabolomic state model (MET) as fitted on UK Biobank and applied to each cohort, as well as on Age+Sex and Age+Sex+MET. The metabolomic state is predictive in the replication cohorts for all assessed endpoints. Dots indicate the median performance, while whiskers indicate the 95% confidence interval (CI) determined by bootstrapping over 1000 iterations. b) Age+Sex adjusted hazard ratios (HRs) for the metabolomic state in all five cohorts. A unit standard deviation increase in the metabolomic state corresponds to an HR increase in predicted risk. Statistical measures were derived from n = 6.117 (Whitehall II), n = 2949 (Rotterdam Study), n = 1655 (Leiden Longevity Study), and n = 960 (PROSPER) individuals as indicated. Data are presented as median (center of error bar) and 95% CI (line of error bar) determined by bootstrapping over 1000 iterations.
Extended Data Fig. 4
Extended Data Fig. 4. The discriminative performance is largely comparable over multiple subgroups.
Discriminative performance is stratified by endpoint, age at recruitment, biological sex, and self-reported ethnic background. As the concordance index is only reliable if a sufficient number of events are recorded, subgroups with < 100 events were excluded. The number of events and eligible individuals is indicated at the top of each panel. Data are presented as median (center of error bar) and 95% CI (line of error bar) determined by bootstrapping with 1000 iterations.
Extended Data Fig. 5
Extended Data Fig. 5. Comparison of the predictive performance of the PANEL predictors in a Cox proportional hazard model and the neural network.
Comparison of discriminative performances of the CPH models and Metabolomic State Model (MSM) trained on the PANEL covariates. The discriminative performance of the PANEL predictors is either similar or can be further improved by modeling with the same architecture as the metabolomic state model for most (non-cancer) endpoints. Statistical measures were derived from n = 117.981 individuals. Individuals with prior events were excluded (Supplementary Table 1). Data are presented as median (center of error bar) and 95% CI (line of error bar) determined by bootstrapping with 1000 iterations.
Extended Data Fig. 6
Extended Data Fig. 6. Adjusted effect of the metabolomic state is endpoint dependent.
a) Adjusted trajectories representing the partial cumulative risk dependent on the metabolomic state over time for the endpoints where the metabolomic state added information to the Age+Sex baseline (see Fig. 3b) for the bottom (light blue), median (blue), and top (dark blue) 10% metabolomic state quantiles. The shaded area indicates the 95% confidence interval as estimated by bootstrapping over 1000 iterations. b) Adjusted hazard ratios (HRs) for the metabolomic state in combination with the three clinical predictor sets. A unit standard deviation increase in the metabolomic state corresponds to an HR increase in predicted risk. Statistical measures were derived from n = 117.981 individuals. Individuals with prior events were excluded (Supplementary Table 1). Data are presented as median (center of error bar) and 95% CI (line of error bar) determined by bootstrapping with 1000 iterations.
Extended Data Fig. 7
Extended Data Fig. 7. The metabolomic state contains independent predictive information over the APOE4 carrier status for all-cause dementia.
a) Displayed are C-index deltas between the CPH model trained on the PANEL + APOE4 predictor set, its metabolomic state addition (PANEL + APOE4 + MET), and CPH models trained on the PANEL set and its respective metabolomic state addition (PANEL + MET). The metabolomic state adds predictive information over the PANEL + APOE4. b) Partial trajectory for MET deciles (Top, Median, Bottom 10%) adjusted for PANEL and PANEL + APOE4, respectively. c) Hazard Ratio for the Metabolomic State adjusted for the predictors of the PANEL and PANEL + APOE4. d) Decision curve analysis for PANEL/PANEL + MET and PANEL + APOE4/PANEL + APOE4 + MET. The areas in between the solid and dotted lines indicate added net benefits resulting from metabolomic state addition to PANEL (gray lines, red area) and PANEL + APOE4 (black lines, violet area), respectively. Adding MET to PANEL improves net population benefit between the 2–8% decision threshold. In the case of PANEL + APOE4, MET addition improves utility at thresholds between 5–10%. Statistical measures were derived from n = 117.245 individuals without dementia at recruitment. Data are presented as median (center of error bar) and 95% CI (line of error bar) determined by bootstrapping with 1000 iterations.
Extended Data Fig. 8
Extended Data Fig. 8. Global metabolite importances for each metabolite and endpoint.
Heatmap of the metabolite importances, represented by absolute global SHAP value estimates per endpoint for the 168 circulating metabolites. The endpoints are sorted by the discriminative performance of the metabolomic state (left to right, see Fig. 3a). MACE - Major Adverse Cardiac Events, CHD - Coronary Heart Disease, PAD - Peripheral Artery Disease, AAA - Abdominal Aortic Aneurysm, COPD - Chronic Obstructive Pulmonary Disease.
Extended Data Fig. 9
Extended Data Fig. 9. Individual attribution profiles diverge for high-risk individuals in T2D.
The UMAP projection allows an assessment of the complex, high-dimensional manifold of attribution values in 2-dimensional space. For visualization, 41 unconnected outliers of 117981 total observations were excluded. a) UMAP of the SHAP value metabolite attributions for T2D for the entire study population colored by each individual’s metabolomic state. b) The same UMAP colored by the Glucose SHAP value. c) Displays individual attribution profiles for three high-risk (metabolomic state > 10, top 1% metabolomic state percentile) individuals, indicated by the letters A, B, C in the central UMAP. The three individual attribution profiles are dominated by different metabolites. The scale bar represents a unit in the UMAP space. The individual attribution profiles are set up equivalently to Figure 6: Each point in an individual attribution profile indicates one metabolite; the position, size, and color of the point indicate the magnitude and direction of the attributed contribution to predicted risk. The green and red circles represent the bounds of the top and bottom percentile of the global SHAP distribution, respectively, indicating outliers in the SHAP global distribution.
Extended Data Fig. 10
Extended Data Fig. 10. Metabolites differ throughout the attribution space.
Displayed are distributions for all measured metabolites (n = 168) stratified by the region (A, B, and C) in the attribution space, defined by the UMAP of the attributions for T2D (see Extended Data Figure 9c). Regions were defined by including all samples with an euclidean distance < 1 to the centroid A, B, and C, respectively; a Euclidean distance of 1 is indicated by the scale bar (see Extended Data Figure 9c). The distributions differ notably for metabolites, including glucose, fatty acids (that is LA and Omega-6), and multiple lipoprotein components (that is VLDL cholesterol and very large HDL triglycerides).

References

    1. WHO CVD Risk Chart Working Group. World Health Organization cardiovascular disease risk charts: revised models to estimate risk in 21 global regions. Lancet Glob. Health. 2019;7:e1332–e1345. - PMC - PubMed
    1. A and B recommendations. U.S. Preventive Services Task Forcehttps://www.uspreventiveservicestaskforce.org/uspstf/recommendation-topi... (2022).
    1. Goff David C, et al. 2013 ACC/AHA Guideline on the Assessment of Cardiovascular Risk. Circulation. 2014;129:S49–S73. - PubMed
    1. Würtz P, et al. Circulating metabolite predictors of glycemia in middle-aged men and women. Diabetes Care. 2012;35:1749–1756. - PMC - PubMed
    1. Mahendran Y, et al. Association of ketone body levels with hyperglycemia and type 2 diabetes in 9,398 Finnish men. Diabetes. 2013;62:3618–3626. - PMC - PubMed

Publication types