. 2022 Oct;28(10):2194-2206.
doi: 10.1038/s41591-022-01942-9. Epub 2022 Sep 22.

Temporal order of clinical and biomarker changes in familial frontotemporal dementia

Adam M Staffaroni  1 Melanie Quintana  2 Barbara Wendelberger  2 Hilary W Heuer  3 Lucy L Russell  4 Yann Cobigo  3 Amy Wolf  3 Sheng-Yang Matt Goh  3 Leonard Petrucelli  5 Tania F Gendron  5 Carolin Heller  4 Annie L Clark  3 Jack Carson Taylor  3 Amy Wise  3 Elise Ong  3 Leah Forsberg  6 Danielle Brushaber  7 Julio C Rojas  3 Lawren VandeVrede  3 Peter Ljubenkov  3 Joel Kramer  3 Kaitlin B Casaletto  3 Brian Appleby  8 Yvette Bordelon  9 Hugo Botha  6 Bradford C Dickerson  10 Kimiko Domoto-Reilly  11 Julie A Fields  12 Tatiana Foroud  13 Ralitza Gavrilova  6 Daniel Geschwind  9   14 Nupur Ghoshal  15 Jill Goldman  16 Jonathon Graff-Radford  6 Neill Graff-Radford  17 Murray Grossman  18 Matthew G H Hall  3 Ging-Yuek Hsiung  19 Edward D Huey  16 David Irwin  18 David T Jones  6 Kejal Kantarci  6 Daniel Kaufer  20 David Knopman  6 Walter Kremers  7 Argentina Lario Lago  3 Maria I Lapid  12 Irene Litvan  21 Diane Lucente  10 Ian R Mackenzie  22 Mario F Mendez  9 Carly Mester  7 Bruce L Miller  3 Chiadi U Onyike  23 Rosa Rademakers  5   24   25 Vijay K Ramanan  6 Eliana Marisa Ramos  9 Meghana Rao  6 Katya Rascovsky  18 Katherine P Rankin  3 Erik D Roberson  26 Rodolfo Savica  6 M Carmela Tartaglia  27 Sandra Weintraub  28 Bonnie Wong  10 David M Cash  4 Arabella Bouzigues  4 Imogen J Swift  4 Georgia Peakman  4 Martina Bocchetta  4 Emily G Todd  4 Rhian S Convery  4 James B Rowe  29 Barbara Borroni  30 Daniela Galimberti  31   32 Pietro Tiraboschi  33 Mario Masellis  34 Elizabeth Finger  35 John C van Swieten  36 Harro Seelaar  36 Lize C Jiskoot  36 Sandro Sorbi  37   38 Chris R Butler  39   40 Caroline Graff  41   42 Alexander Gerhard  43   44 Tobias Langheinrich  43   45 Robert Laforce  46 Raquel Sanchez-Valle  47 Alexandre de Mendonça  48 Fermin Moreno  49   50 Matthis Synofzik  51   52 Rik Vandenberghe  53   54   55 Simon Ducharme  56   57 Isabelle Le Ber  58   59   60 Johannes Levin  61   62   63 Adrian Danek  61 Markus Otto  64 Florence Pasquier  65   66   67 Isabel Santana  68   69 John Kornak  70 Bradley F Boeve  6 Howard J Rosen  3 Jonathan D Rohrer  4 Adam L Boxer  71 Frontotemporal Dementia Prevention Initiative (FPI) Investigators
Collaborators, Affiliations

Temporal order of clinical and biomarker changes in familial frontotemporal dementia

Adam M Staffaroni et al. Nat Med. 2022 Oct.

Abstract

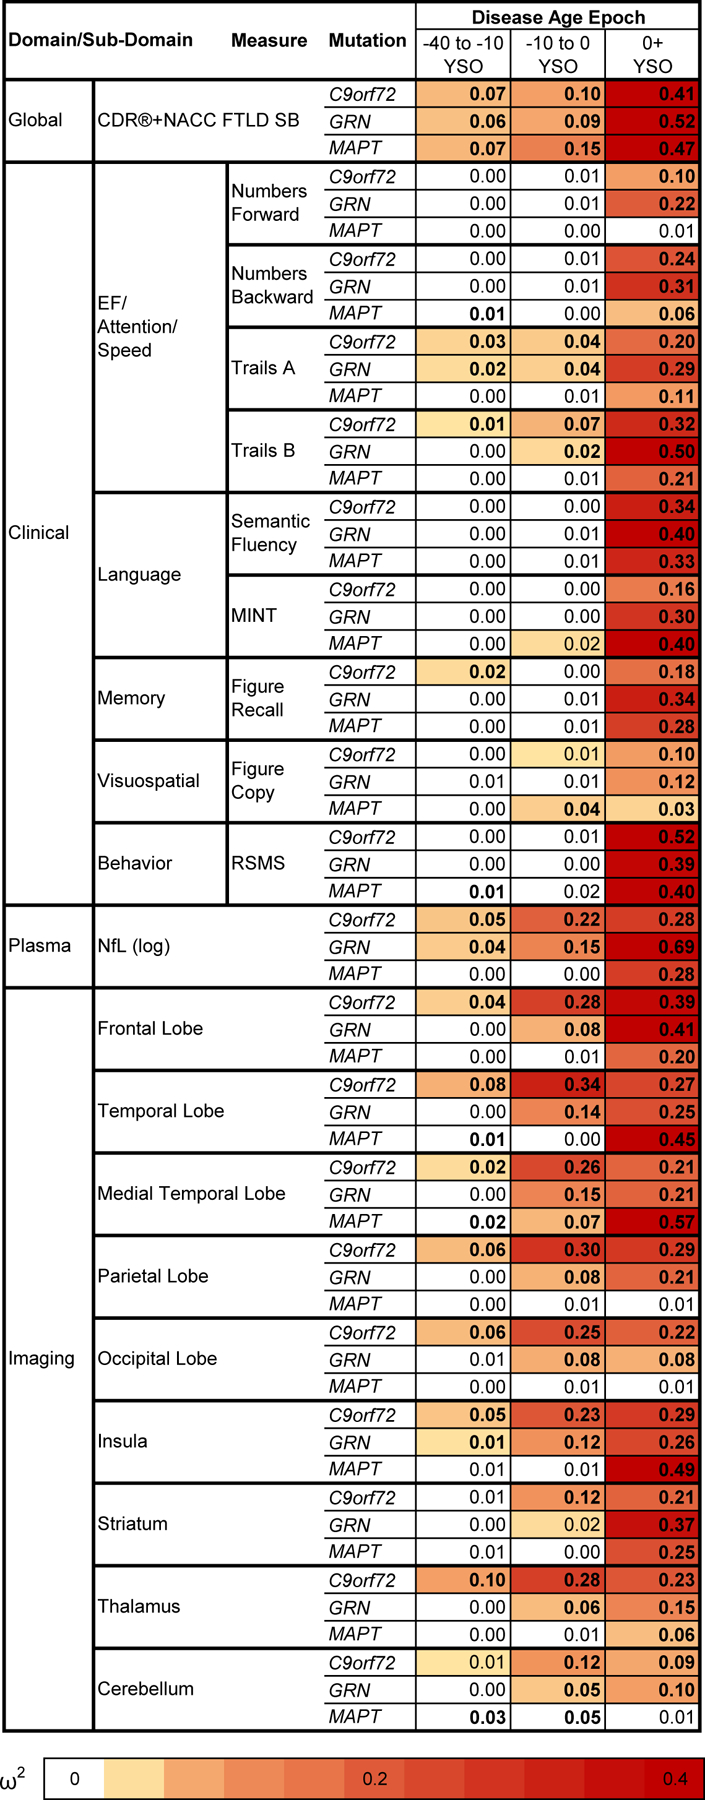
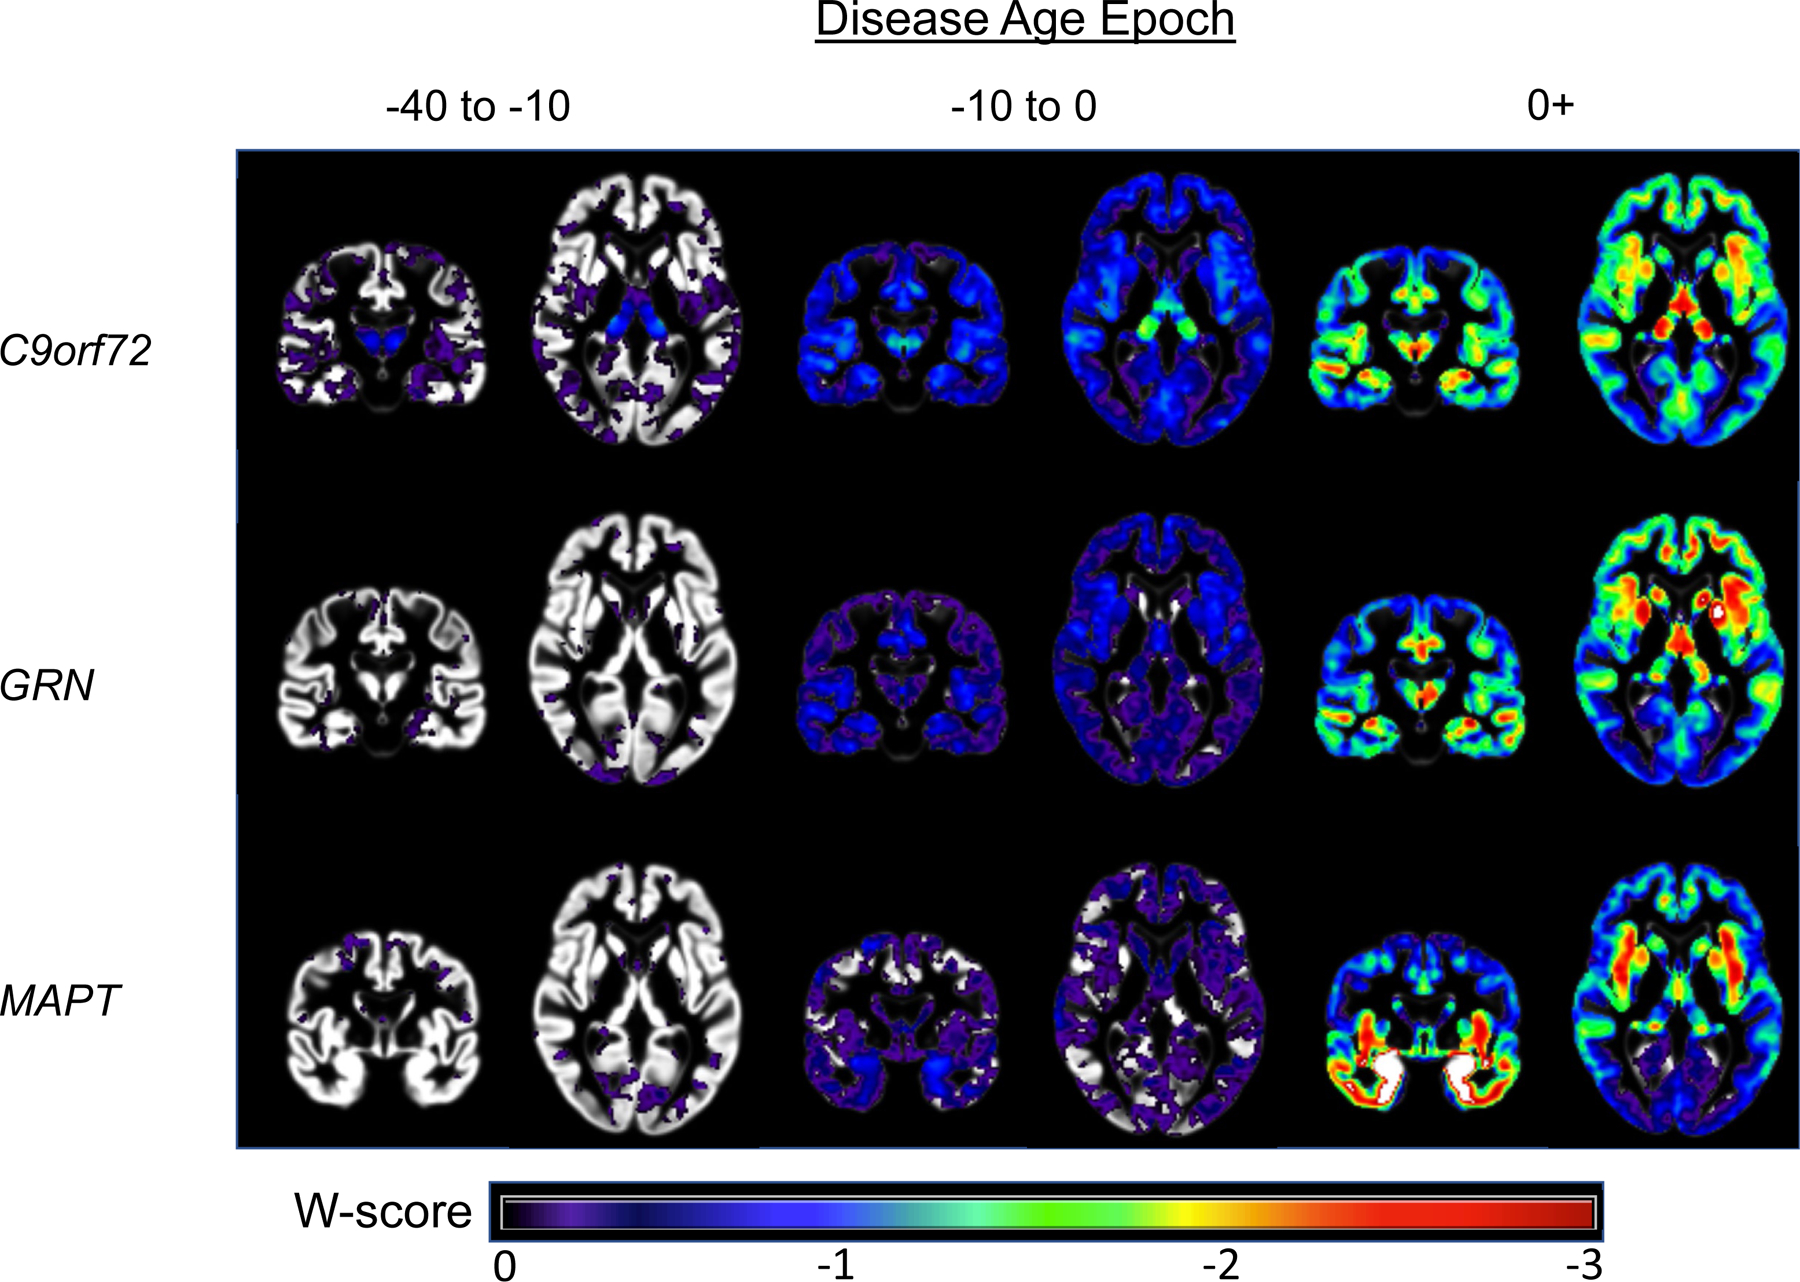
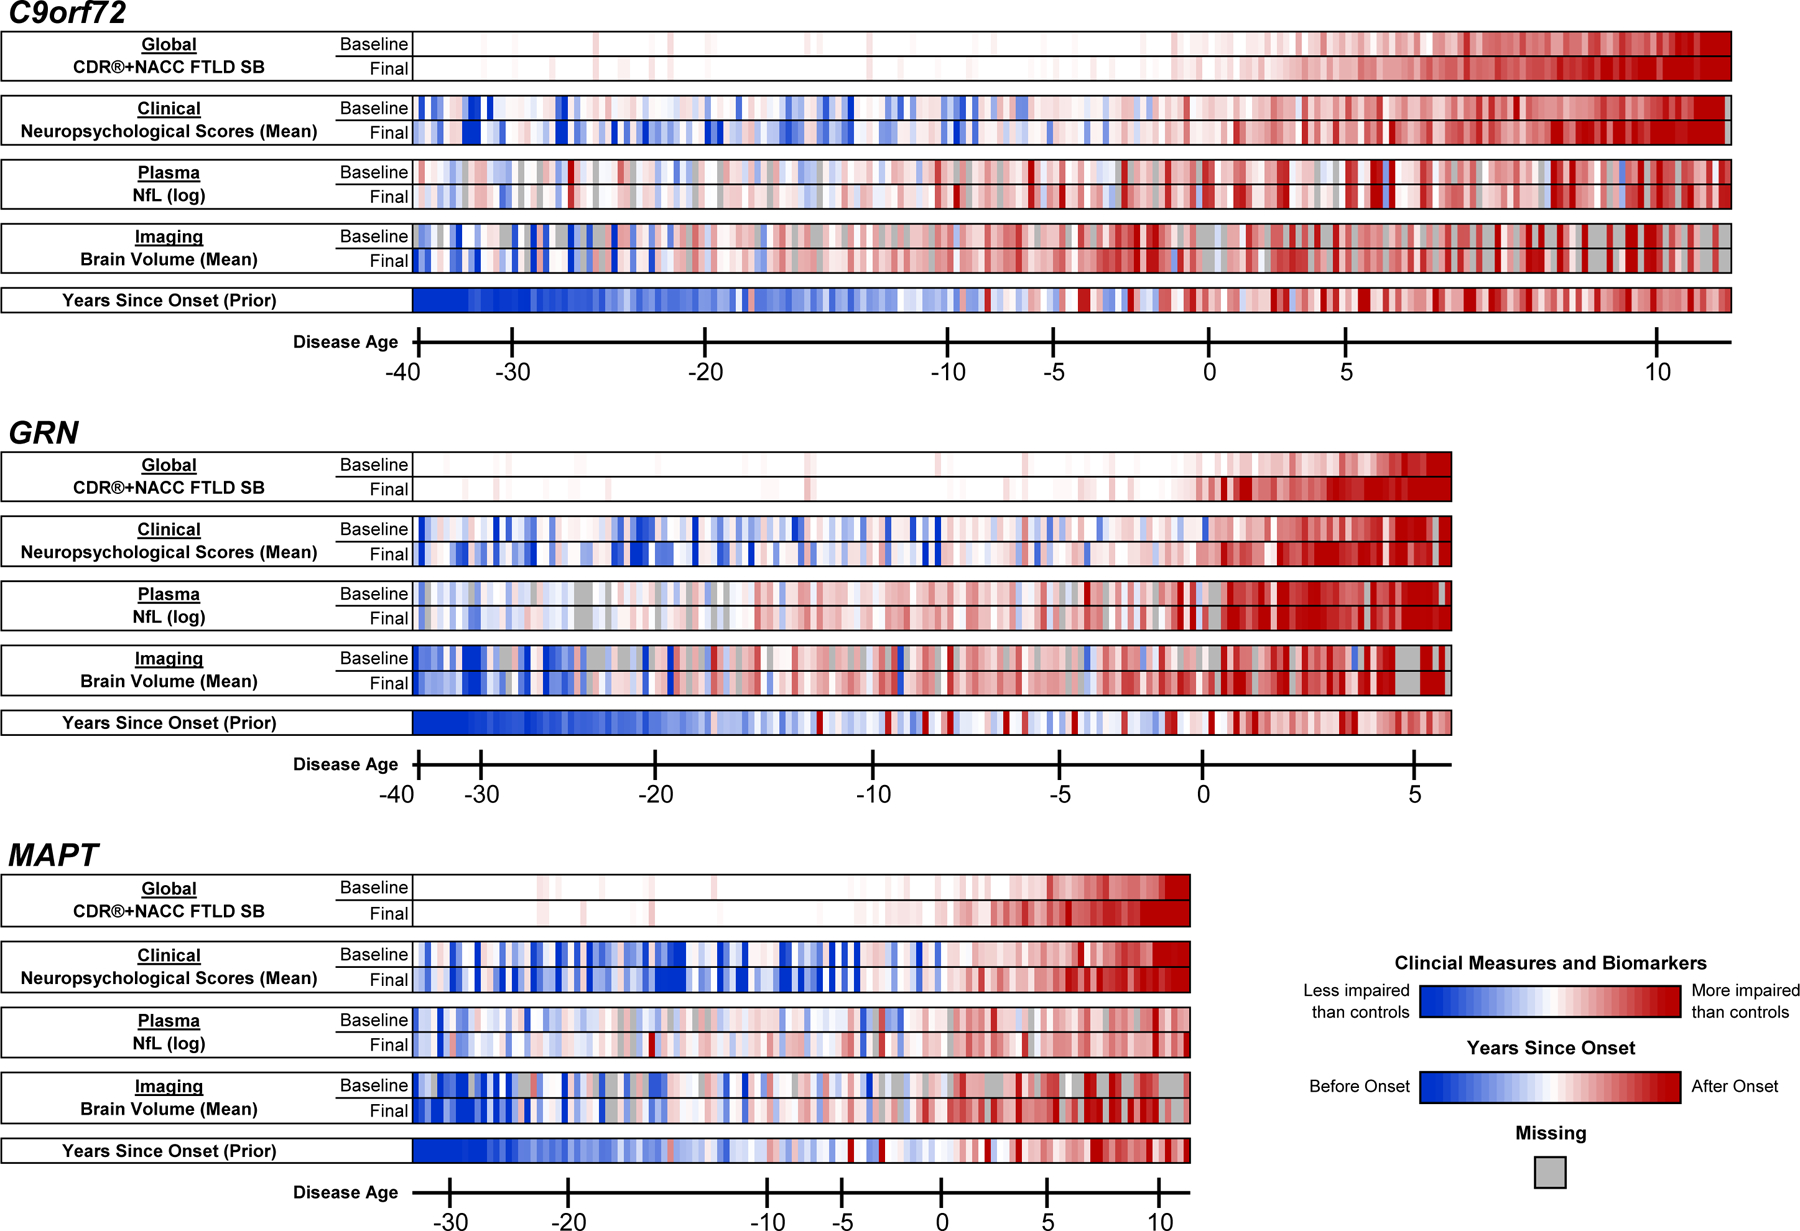
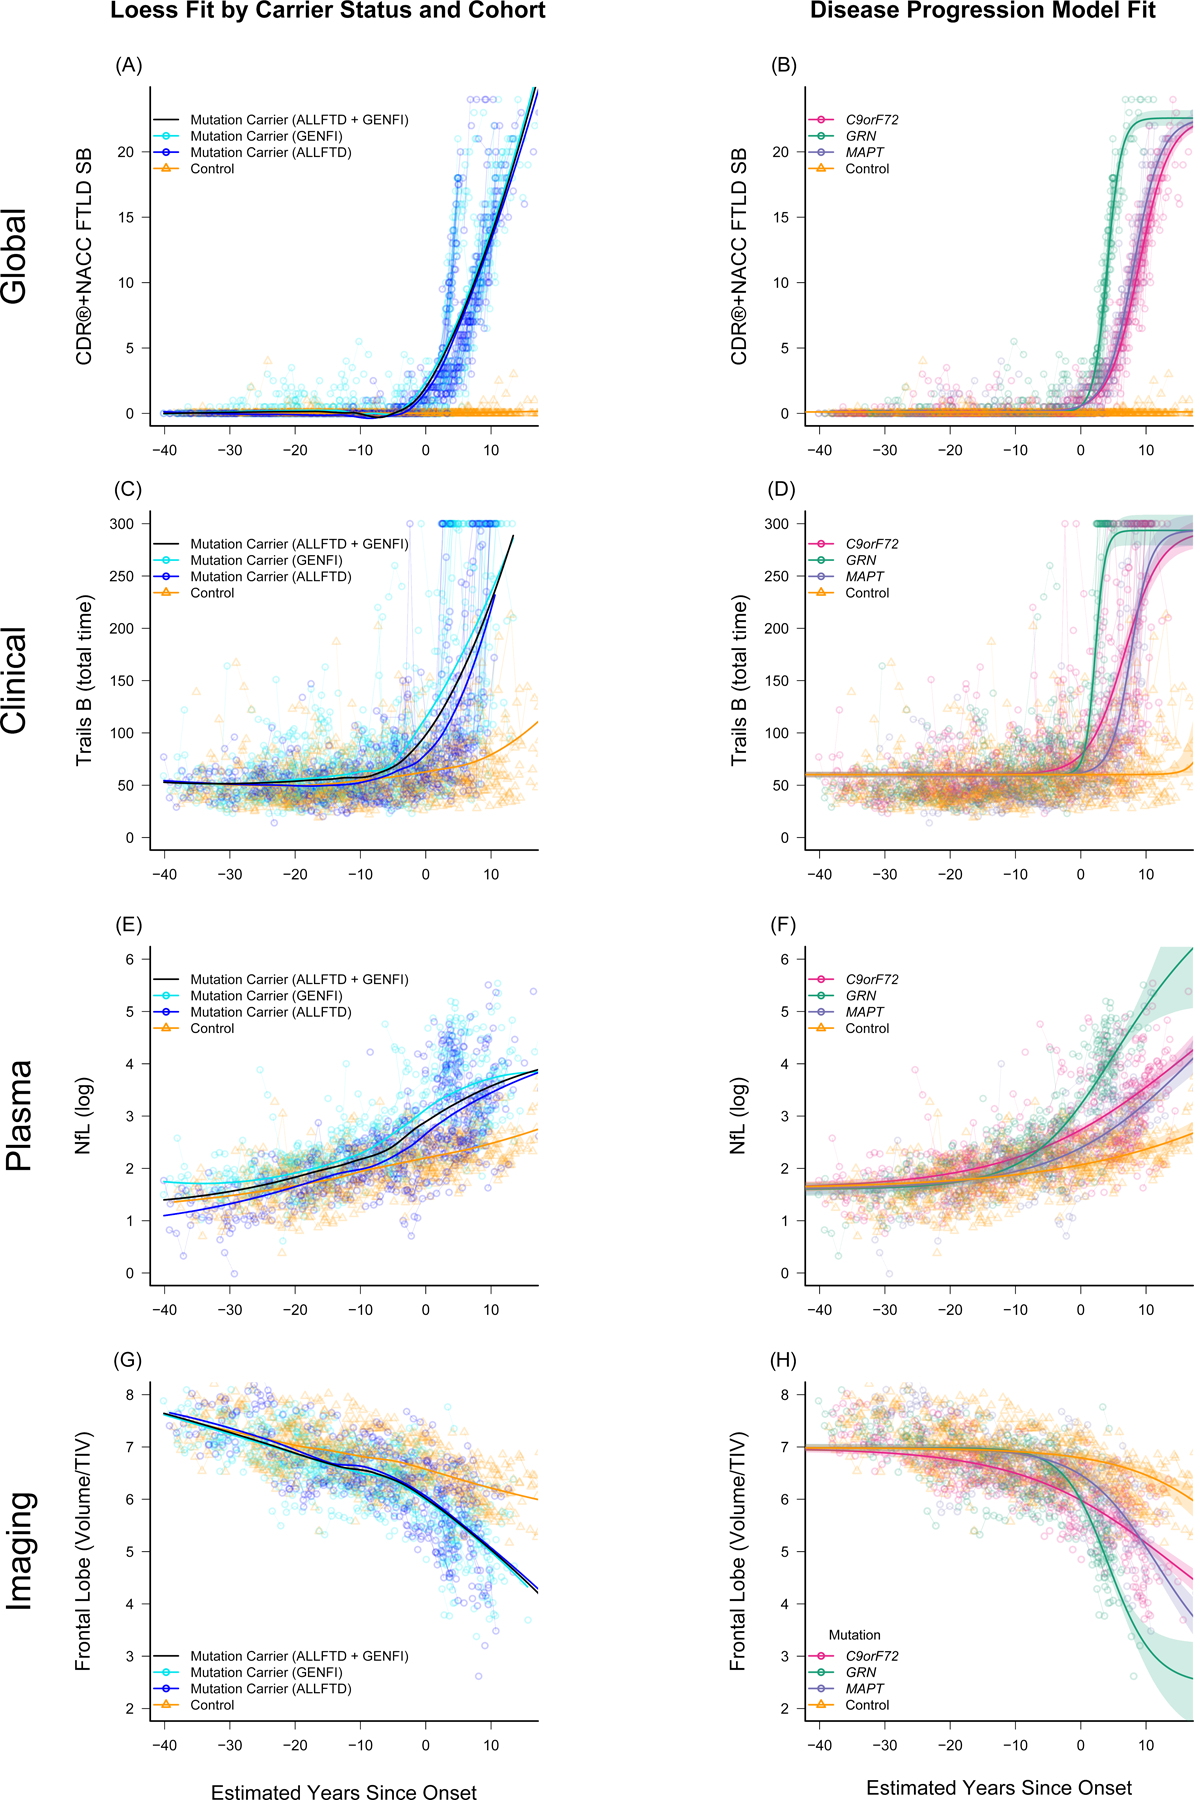
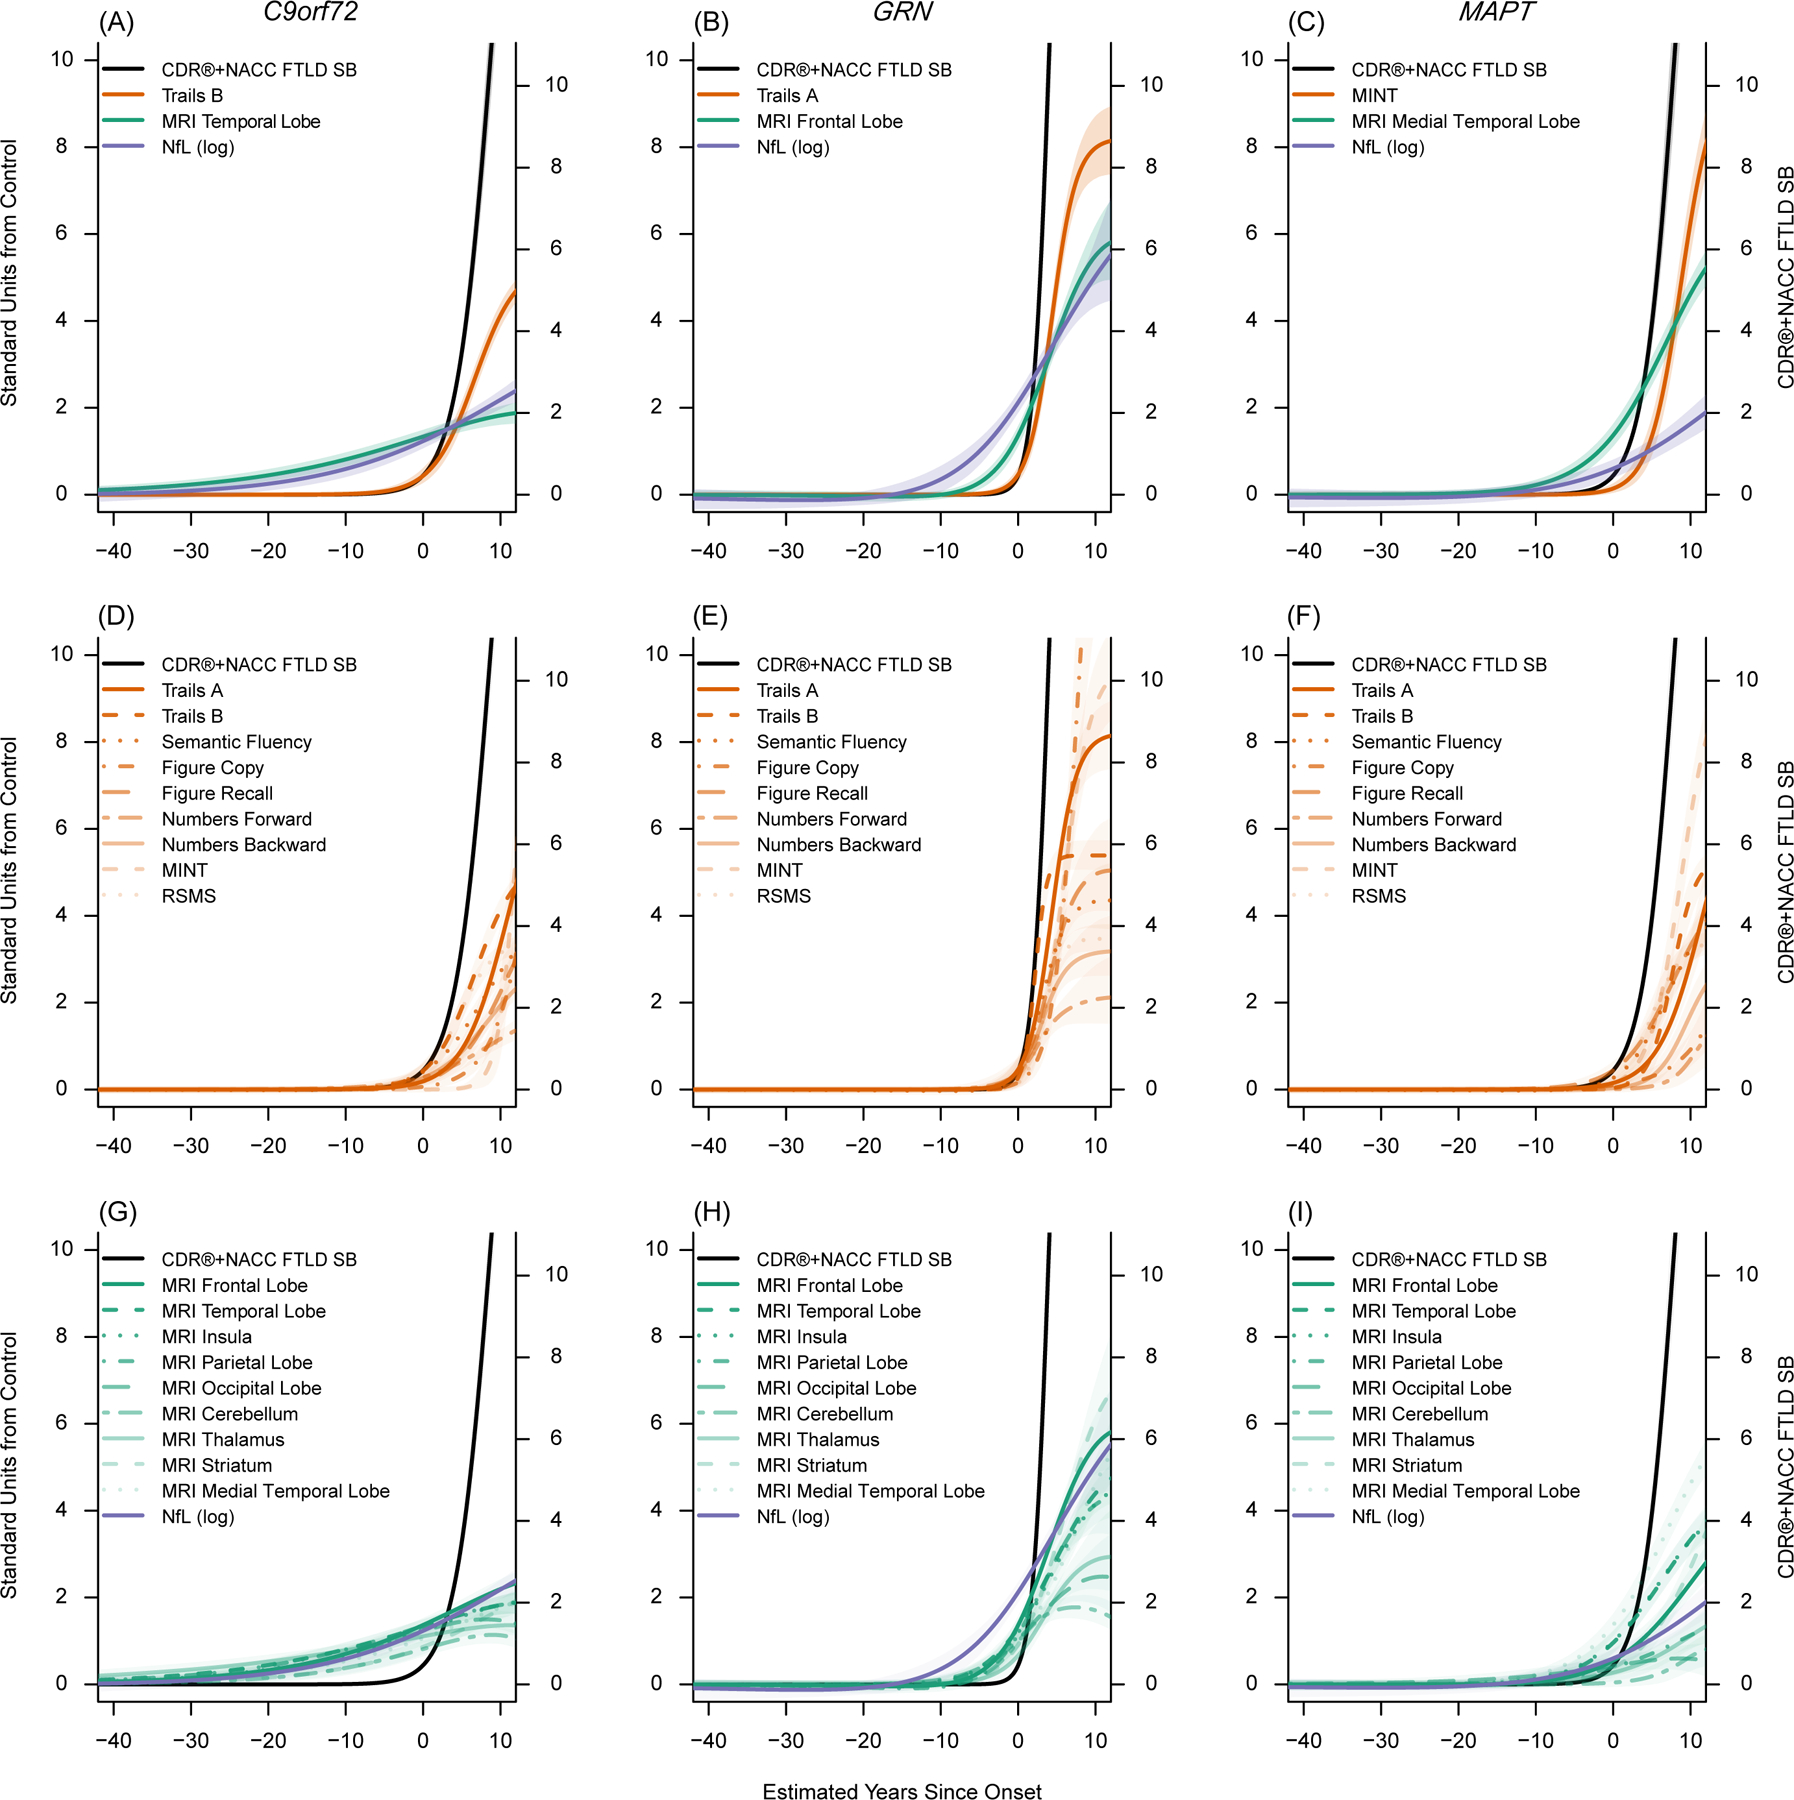
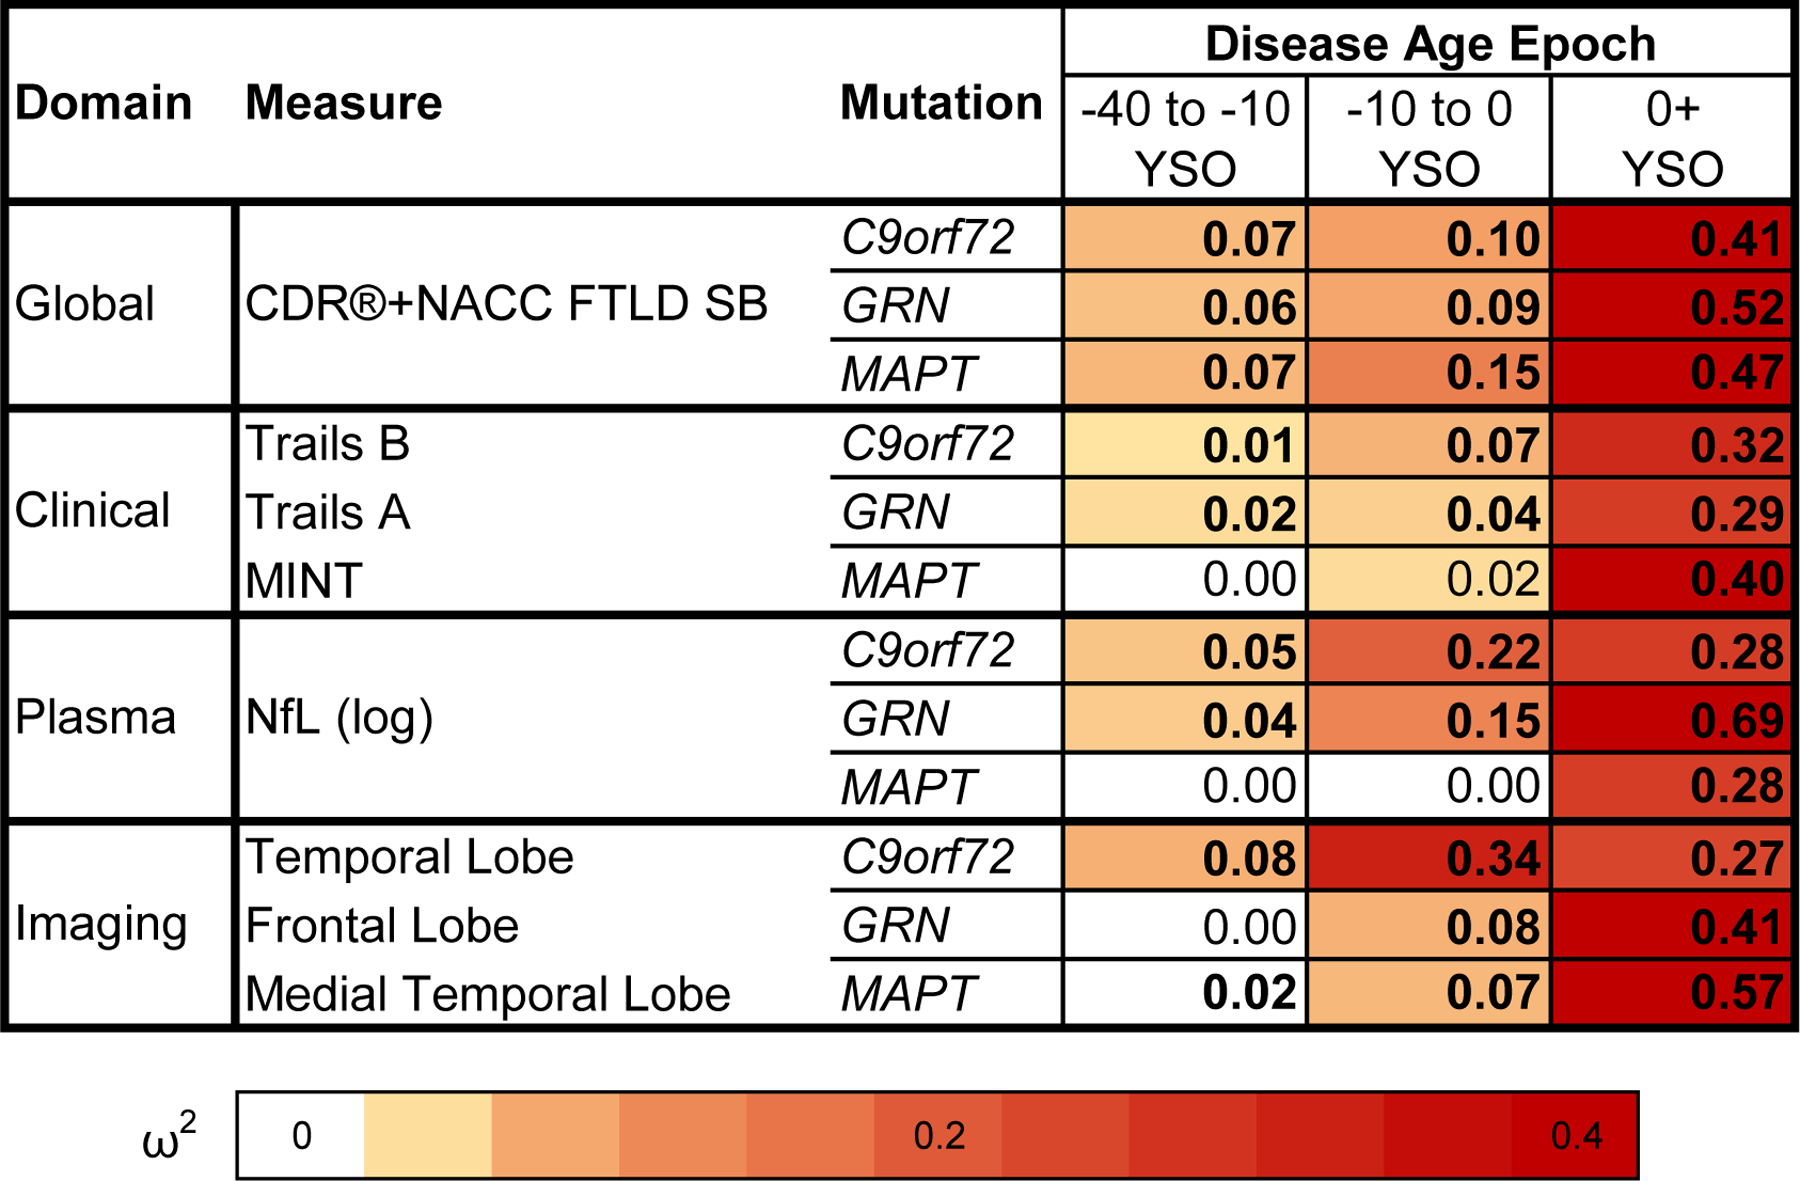
Unlike familial Alzheimer's disease, we have been unable to accurately predict symptom onset in presymptomatic familial frontotemporal dementia (f-FTD) mutation carriers, which is a major hurdle to designing disease prevention trials. We developed multimodal models for f-FTD disease progression and estimated clinical trial sample sizes in C9orf72, GRN and MAPT mutation carriers. Models included longitudinal clinical and neuropsychological scores, regional brain volumes and plasma neurofilament light chain (NfL) in 796 carriers and 412 noncarrier controls. We found that the temporal ordering of clinical and biomarker progression differed by genotype. In prevention-trial simulations using model-based patient selection, atrophy and NfL were the best endpoints, whereas clinical measures were potential endpoints in early symptomatic trials. f-FTD prevention trials are feasible but will likely require global recruitment efforts. These disease progression models will facilitate the planning of f-FTD clinical trials, including the selection of optimal endpoints and enrollment criteria to maximize power to detect treatment effects.


Figures

Extended Data Fig. 1
Extended Data Fig. 1. Baseline comparisons between mutation carriers and controls by disease age epoch.
Cross-sectional baseline differences between mutation carriers and controls are presented as effect sizes (omega squared). Bolded cells indicate statistical significance (p < .05) using two-sided tests without multiple comparison correction. Comparisons in which mutation carriers are more impaired than controls are colored, with darker shades illustrating larger effect sizes. Note that statistical comparisons for the CDR®+NACC FTLD SB should be interpreted with caution given that controls were defined as having a baseline CDR®+NACC-FTLD=0 and thus have no variance due to this selection process. Abbreviations: EF: Executive Functioning; NfL: Plasma neurofilament light chain levels; RSMS: Revised Self Monitoring Scale. CDR®+NACC FTLD SB: Clinical Dementia Rating Scale plus National Alzheimer’s Coordinating Center’s Frontotemporal Lobar Degeneration Module Sum of Boxes
Extended Data Fig. 2
Extended Data Fig. 2. Voxelwise atrophy by estimated disease stage in familial frontotemporal dementia
Voxelwise maps display brain atrophy as the number of standardized units from controls (W-scores), controlling for head size and scanner. Images are shown in radiological orientation (i.e., right is left). Voxelwise results are presented with a greater number of axial slices in Figures S2-S4. Results were generally consistent with the region of interest findings, supporting the validity of the DPM approach. In C9orf72, thalamic atrophy, particularly in the pulvinar, was the primary region of atrophy in the −40 to −10 epoch and continued to be a region of prominent atrophy throughout the disease course. Medial temporal lobe volume loss became prominent in the −10 to −0 epoch. Frontoinsular, medial parietal, and medial temporal atrophy became prominent in the symptomatic phase (see also Figure S2). In GRN, subtle early cerebellar atrophy was observed (−40 to −10), along with atrophy in frontotemporal, subcortical, and insular structures in the −10 to 0 epoch. In the symptomatic stage, atrophy extended into the temporal lobe, frontoparietal regions, and striatum (see also Figure S3). Atrophy in MAPT appeared to begin in the medial temporal lobe and temporal pole (−10 to 0), and symptomatic mutation carriers showed temporal, insular, ventral and medial frontal, and striatal atrophy (see also Figure S4).
Extended Data Fig. 3
Extended Data Fig. 3. Patient-level data contributing to the disease progression models.
For each genetic group, each mutation carrier with longitudinal data is displayed in a single column, organized on the x-axis by their model estimated Disease Age at baseline. Participants’ baseline and last available (Final) observation for each outcome are presented. For the CDR®+NACC-FTLD-SB, white cells indicate a score of 0, and increasingly dark red tones denote higher scores (i.e., more severe impairments or greater atrophy). Log transformed plasma NfL concentrations and the mean of all available neuropsychological scores and regional gray matter volume estimates are also presented, with the color scale indicating their scores relative to controls of the same Disease Age. Lastly, the model’s prior estimate of Years Since Onset is displayed. For participants with documented onset, we display the difference between their chronological age and the clinician estimated age of onset. For those participants in whom clinical onset has not yet occurred (or this data was unavailable), we display the difference between their chronological age and the mean age of onset for their mutation.
Figure 1.
Figure 1.. Raw data points overlaid on model estimated fit
Panels A, C, E, and G display raw data points for mutation carriers (blue) and non-carrier controls (gold) for several representative measures as a function of model estimated Disease Age, with a loess fit to each group displayed using thick solid lines. In these panels, raw outcomes are plotted, and mutation carriers are color coded based on whether they were enrolled through ALLFTD or GENFI. These panels highlight the consistency in progression regardless of cohort. Panels B, D, F, and H display raw data points colored by mutation as a function of disease age. In these panels, the overall fit for each group was derived from the Bayesian disease progression model and is displayed using thick solid lines. Shaded areas indicate the 95% credible interval of the estimate. Age-related changes in controls are observed in panels C-H. Figures for all modeled measures are included in Supplemental Figure S1. Abbreviations: CDR®+NACC FTLD SB: Clinical Dementia Rating Scale plus National Alzheimer’s Coordinating Center’s Frontotemporal Lobar Degeneration Module Sum of Boxes; Trails B: Trail Making Test, Part B (total time displayed in seconds); NfL (log): Log-transformed plasma neurofilament light chain; TIV: Total intracranial volume.
Figure 2.
Figure 2.. Temporal ordering of clinical and biomarker changes in F-FTD
These figures display the empirically derived model-estimated curves in each genetic group. In all figures, model estimated time from onset (years) is on the x-axis. The left y-axis indicates the number of standard deviations (SD) of abnormality compared to controls. The right y-axis indicates CDR®+NACC FTLD Box Score units to provide a context for understanding the degree of clinical impairment associated with changes in the other biomarkers and to provide a raw estimate corresponding to the standardized CDR®+NACC FTLD Box Score (black line). Panels A-C display the mean curves for the CDR®+NACC FTLD Box Score, NfL, and a selected imaging and clinical measure for each genetic group, based on which measure is first elevated by one standard deviation from controls and the measure’s rate of longitudinal progression. All clinical, imaging, and fluid biomarkers are displayed in the remaining panels (D-I). The shaded areas indicate the 95% credible interval of the estimate. These figures suggest brain atrophy and elevations in neurofilament light chain levels are detectable prior to symptom onset, and that each mutation shows a unique cascade of biomarker changes. Abbreviations: CDR®+NACC FTLD SB: Clinical Dementia Rating Scale plus National Alzheimer’s Coordinating Center’s Frontotemporal Lobar Degeneration Module Sum of Boxes; Trail B: Trail Making Test, Part B; MINT: Multilingual Naming Test; RSMS: Revised Self Monitoring Scale; MRI: magnetic resonance imaging; NfL (log): Log-transformed plasma neurofilament light chain; Stand: Standard
Figure 3.
Figure 3.. Comparison of mutation carriers with controls at three epochs of disease age
Cross-sectional baseline differences between mutation carriers and controls are presented as effect sizes (omega squared). Bolded cells indicate statistical significance (p < .05). Comparisons in which mutation carriers are more impaired than controls at an omega squared > 0.00 are colored, with darker shades illustrating larger effect sizes. CDR®+NACC FTLD SB scores and log-transformed NfL levels are presented for all genetic groups. Clinical and imaging measures were selected for each genetic group based on how early they deviated from controls in the disease progression model and rate of longitudinal progression. Note that statistical comparisons for the CDR®+NACC FTLD SB should be interpreted with caution given that controls were defined as having a baseline CDR®+NACC-FTLD=0 and thus have no variance due to this selection process. A similar figure including all modeled measures can be found in the extended data figures (Extended Data Fig 1). YSO = years since onset.

References

    1. Knopman DS & Roberts RO Estimating the number of persons with frontotemporal lobar degeneration in the US population. J. Mol. Neurosci 45, 330–335 (2011). - PMC - PubMed
    1. Greaves CV & Rohrer JD An update on genetic frontotemporal dementia. J. Neurol 266, 2075–2086 (2019). - PMC - PubMed
    1. Tsai RM & Boxer AL Therapy and clinical trials in frontotemporal dementia: past, present, and future. J. Neurochem 138, 211–221 (2016). - PMC - PubMed
    1. Boeve BF, Boxer AL, Kumfor F, Pijnenburg Y & Rohrer JD Advances and controversies in frontotemporal dementia: diagnosis, biomarkers, and therapeutic considerations. Lancet. Neurol 21, 258–272 (2022). - PubMed
    1. Mercuri E et al. Nusinersen versus Sham Control in Later-Onset Spinal Muscular Atrophy. N. Engl. J. Med 378, 625–635 (2018). - PubMed

Methods-only references

    1. Boeve B et al. The longitudinal evaluation of familial frontotemporal dementia subjects protocol: Framework and methodology. in Alzheimer’s and Dementia 16, 22–36 (2020). - PMC - PubMed
    1. Ramos EM et al. Genetic screening of a large series of North American sporadic and familial frontotemporal dementia cases. Alzheimers. Dement 16, 118–130 (2020). - PMC - PubMed
    1. Miyagawa T et al. Utility of the global CDR® plus NACC FTLD rating and development of scoring rules: Data from the ARTFL/LEFFTDS Consortium. Alzheimers. Dement 16, 106–117 (2020). - PMC - PubMed
    1. Staffaroni AM et al. Longitudinal multimodal imaging and clinical endpoints for frontotemporal dementia clinical trials. Brain 142, 443–459 (2019). - PMC - PubMed
    1. Miyagawa T et al. Use of the CDR® plus NACC FTLD in mild FTLD: Data from the ARTFL/LEFFTDS consortium. Alzheimer’s Dement 16, 79–90 (2020). - PMC - PubMed

Publication types