. 2023 Feb;41(2):273-281.
doi: 10.1038/s41587-022-01456-2. Epub 2022 Sep 22.

Modular cytokine receptor-targeting chimeras for targeted degradation of cell surface and extracellular proteins

Affiliations

Modular cytokine receptor-targeting chimeras for targeted degradation of cell surface and extracellular proteins

Katarina Pance et al. Nat Biotechnol. 2023 Feb.

Abstract

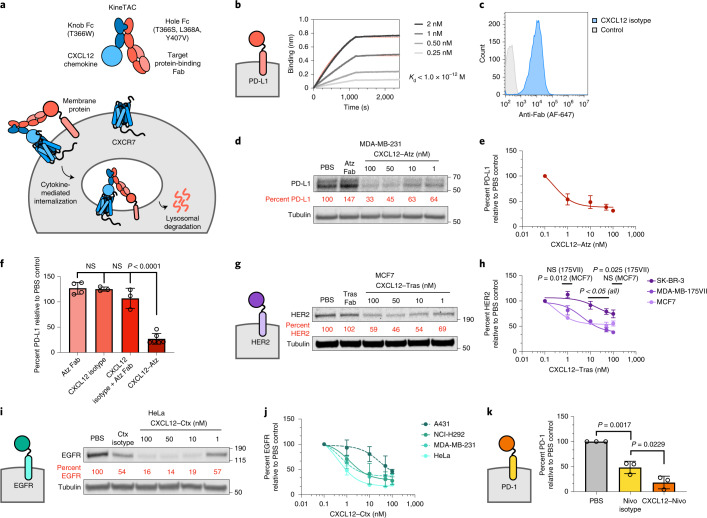
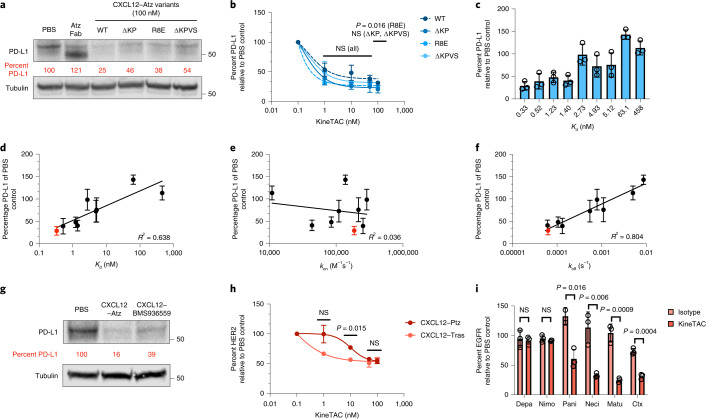
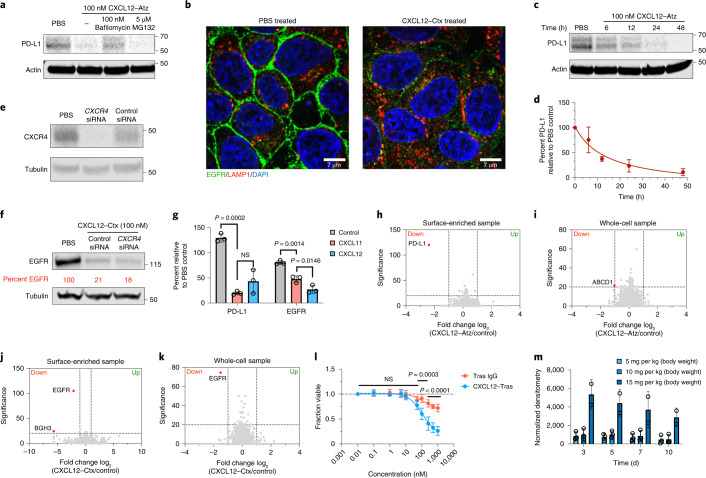
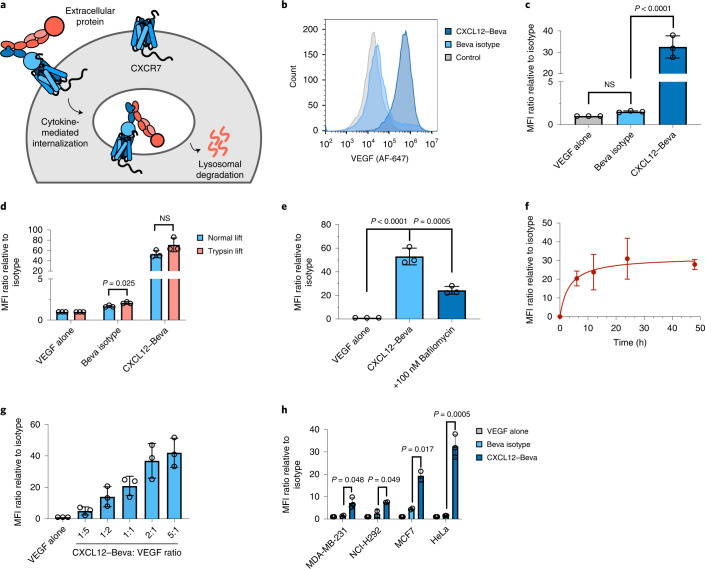
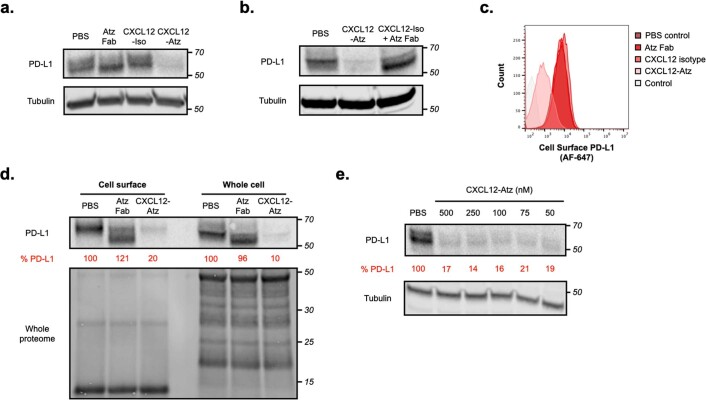
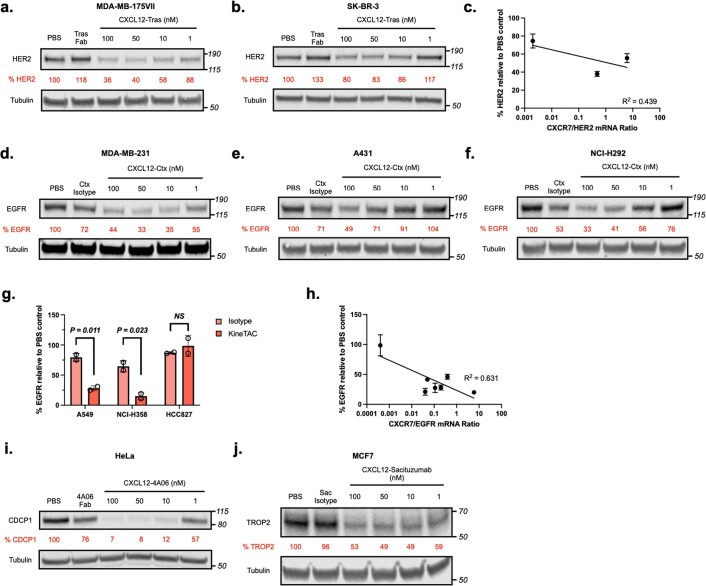
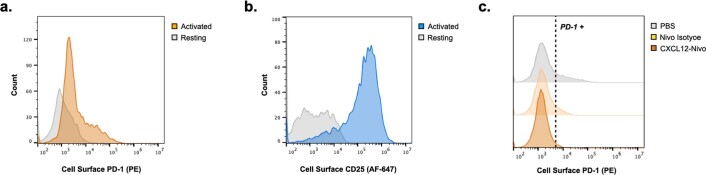
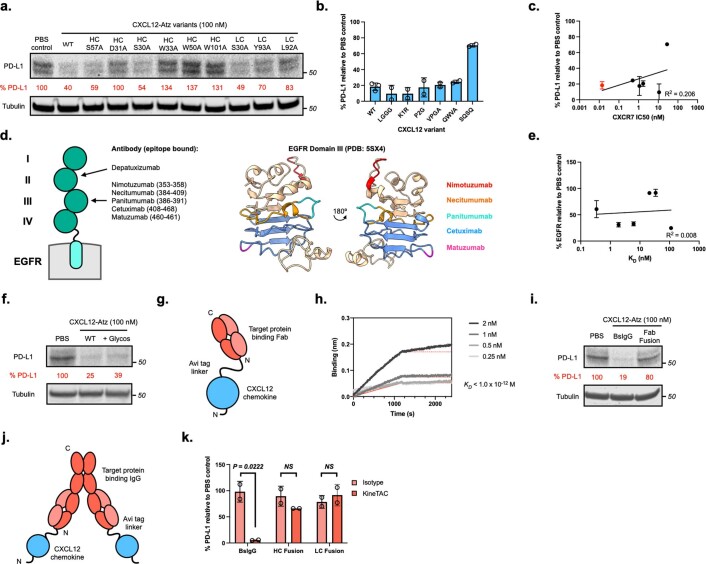
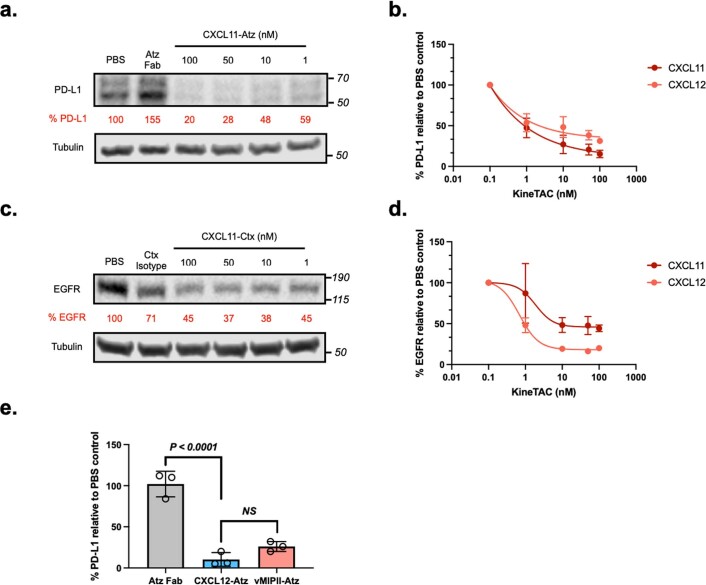
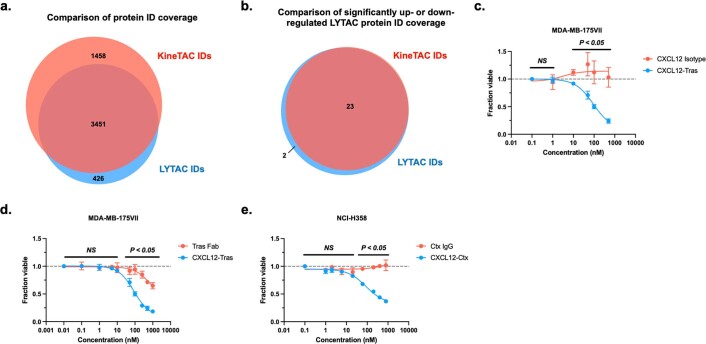
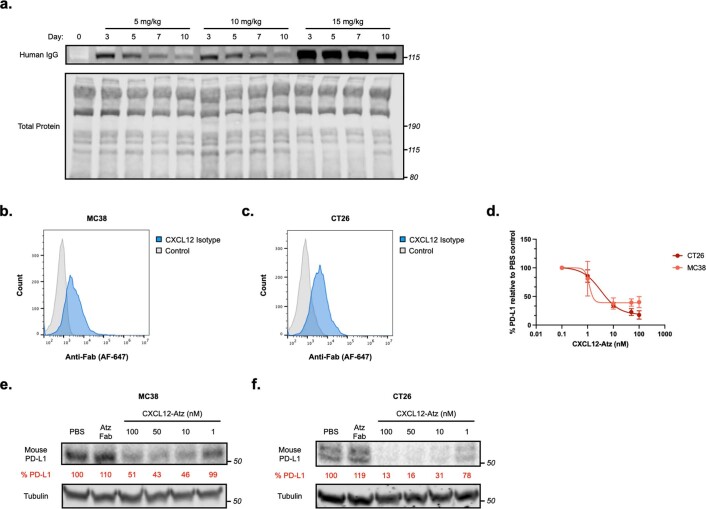
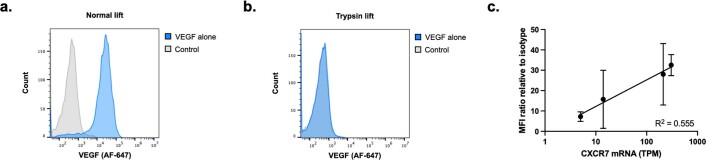
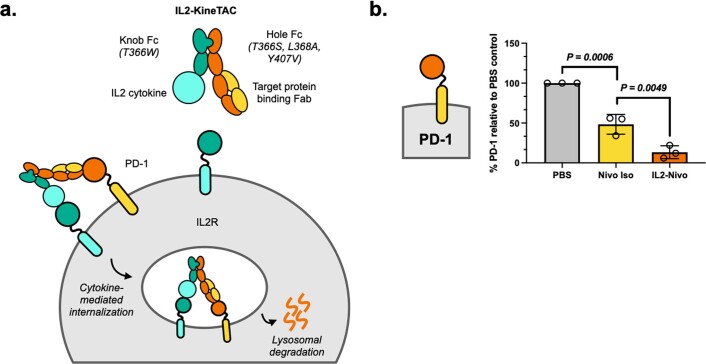
Targeted degradation of cell surface and extracellular proteins via lysosomal delivery is an important means to modulate extracellular biology. However, these approaches have limitations due to lack of modularity, ease of development, restricted tissue targeting and applicability to both cell surface and extracellular proteins. We describe a lysosomal degradation strategy, termed cytokine receptor-targeting chimeras (KineTACs), that addresses these limitations. KineTACs are fully genetically encoded bispecific antibodies consisting of a cytokine arm, which binds its cognate cytokine receptor, and a target-binding arm for the protein of interest. We show that KineTACs containing the cytokine CXCL12 can use the decoy recycling receptor, CXCR7, to target a variety of target proteins to the lysosome for degradation. Additional KineTACs were designed to harness other CXCR7-targeting cytokines, CXCL11 and vMIPII, and the interleukin-2 (IL-2) receptor-targeting cytokine IL-2. Thus, KineTACs represent a general, modular, selective and simple genetically encoded strategy for inducing lysosomal delivery of extracellular and cell surface targets with broad or tissue-specific distribution.


Conflict of interest statement

K.P., J.A.W. and J.A.G. and the Reagents of the University of California have filed a patent application related to this project. K.P. and J.A.G. are cofounders, shareholders and employees of EpiBiologics. J.A.W. is a cofounder, shareholder and board member of EpiBiologics. A.D.C. is a cofounder and shareholder of EpiBiologics. The remaining authors declare no competing interests.

Figures

Fig. 1
Fig. 1. KineTAC platform for targeted protein degradation of therapeutically relevant cell surface proteins.
a, Schematic of the KineTAC concept for targeting cell surface proteins for lysosomal degradation via CXCL12-mediated endocytosis. b, Multipoint BLI measurement of CXCL12–Atz shows high affinity to PD-L1 Fc fusion. c, Flow cytometry showing CXCL12 isotype binding on MDA-MB-231 cells endogenously expressing CXCR7. de, Dose escalation experiment showing PD-L1 degradation in MDA-MB-231 cells after 24 h of treatment with CXCL12–Atz; n = 3 biologically independent experiments. f, PD-L1 levels were significantly reduced after a 24-h treatment of MDA-MB-231 cells with 100 nM CXCL12–Atz (P < 0.0001) compared to Atz Fab alone but not with CXCL12 isotype (P = 0.1946) or a combination of Atz Fab and CXCL12 isotype (P = 0.8262); n = 4, 3, 3 or 6 biologically independent experiments, respectively; NS, not significant. g, Dose escalation experiment showing HER2 degradation in MCF7 cells after 24-h treatment with CXCL12–Tras or 100 nM Tras Fab. h, Summary of HER2 degradation in various HER2-expressing cell lines following 24-h treatment with CXCL12–Tras. Data show significantly greater HER2 degradation in MDA-MB-175VII (P = 0.0248) than for SK-BR-3 cells, but not for MCF7 (P = 0.1003); n = 2 biologically independent experiments. i, Dose escalation showing EGFR degradation in HeLa cells after 24-h treatment with CXCL12–Ctx or 100 nM Ctx isotype. j, Summary of EGFR degradation in various EGFR-expressing cell lines following 24-h treatment with CXCL12–Ctx; n = 2 biologically independent experiments for A431, NCI-H292 and MDA-MB-231 cells, and n = 3 biologically independent experiments for HeLa cells. k, Summary of flow cytometry data demonstrating significant degradation of cell surface PD-1 on activated primary human CD8+ T cells after treatment with 100 nM CXCL12–Nivo compared to treatment with Nivo isotype (P = 0.0229). Percent PD-1 was determined by median fluorescence intensity (MFI) of the PE fluorescence channel of live cells; n = 10,000 live cells analyzed over three biologically independent experiments. Densitometry was used to calculate protein levels, and data were normalized to PBS control. Data are represented as mean values, and error bars represent the standard deviation of biological replicates. P values were determined by one-way analysis of variance (ANOVA) with Sidak’s multiple comparisons test. Source data
Fig. 2
Fig. 2. Requirements for efficient KineTAC-mediated degradation of target proteins.
a,b, Treatment with 100 nM antagonistic (∆KP, ∆KPVS and R8E) CXCL12–Atz variants for 24 h in MDA-MB-231 cells shows no significant difference in PD-L1 levels compared to agonistic CXCL12WT–Atz at 50 nM (P = 0.1432, 0.1222 and 0.5016, respectively). At 100 nM, CXCL12R8E–Atz showed significantly greater PD-L1 degradation than CXCL12WT–Atz (P = 0.0162), while CXCL12∆KP–Atz and CXCL12∆KPVS–Atz were unchanged (P = 0.0609 and 0.7538, respectively); n = 3 biologically independent experiments for CXCL12WT–Atz, and n = 2 for CXCL12–Atz variants. c, PD-L1 levels in MDA-MB-231 cells after treatment with CXCL12–Atz wild type or alanine mutants (100 nM) for 24 h. df, Correlation of PD-L1 levels as calculated by densitometry and Kd (d), kon (e) or koff (f). Wild-type Atz is indicated in red; n = 3 biologically independent experiments. g, PD-L1 levels after treatment with 100 nM CXCL12–Atz or pH-sensitive binder CXCL12–BMS936559 for 24 h in MDA-MB-231 cells. h, HER2 levels after treatment with 100 nM CXCL12–Tras or CXCL12–Ptz in MCF7 cells demonstrate that different epitope binders affect the half-maximum degradation concentration (DC50) of HER2 degradation, while the Dmax at 100 nM was unchanged (P = 0.7758); n = 2 biologically independent experiments. i, EGFR levels after treatment with 100 nM CXCL12–Ctx, CXCL12–Depa, CXCL12–Nimo, CXCL12–Matu, CXCL12–Neci or CXCL12–Pani in HeLa cells demonstrate that there is dependence on EGFR binding epitope for degradation efficiency. CXCL12–Ctx, CXCL12–Pani, CXCL12–Neci and CXCL12–Matu significantly degrade EGFR compared to isotype controls (P = 0.0004, 0.016, 0.006 and 0.009, respectively), while CXCL12–Depa and CXCL12–Nimo do not cause significant EGFR degradation (P = 0.7619 and 0.3573, respectively); n = 3 biologically independent experiments. Densitometry was used to calculate protein levels, and data were normalized to PBS control. Data are represented as mean values, and error bars represent the standard deviation of biological replicates. P values were determined by unpaired two-tailed t-tests. Linear regression analysis using GraphPad Prism was used to calculate the coefficient of determination (R2) to determine the strength of linear correlation. Source data
Fig. 3
Fig. 3. KineTACs mediate target degradation in a highly selective, lysosomal-, time- and CXCR7-dependent manner.
a, Pretreatment for 1 h with either 100 nM bafilomycin or 5 µM MG132 in MDA-MB-231 cells followed by 24 h of treatment with 100 nM CXCL12–Atz indicates that CXCL12–Atz degrades PD-L1 in a lysosome-dependent manner. b, Confocal microscopy images of HeLa cells treated for 24 h with 100 nM CXCL12–Ctx show near complete removal of EGFR. c,d, Time-course experiment shows increased PD-L1 degradation over time after treatment with 100 nM CXCL12–Atz. e, siRNA knockdown of CXCR4 in HeLa cells after a 48-h transfection. f, EGFR levels are unchanged after siRNA knockdown of CXCR4 followed by 24 h of treatment with 100 nM CXCL12–Ctx in HeLa cells. g, PD-L1 in MDA-MB-231 cells or EGFR in HeLa cells is significantly degraded after 24 h of treatment with 100 nM CXCL11–Atz (P = 0.0002) or CXCL11–Ctx (P = 0.0014) compared to isotype controls. No significant difference was observed between CXCL11–Atz and CXCL12–Atz (P = 0.2643), while CXCL12–Ctx caused greater EGFR degradation than CXCL11–Ctx (P = 0.0146); n = 3 biologically independent experiments. h,i, Fold change in abundance of surface-enriched (h) or whole-cell (i) MDA-MB-231 proteins detected using quantitative proteomics analysis after 48 h of treatment with 100 nM CXCL12–Atz reveals highly selective PD-L1 degradation. j,k, Fold change in abundance of surface-enriched (j) or whole-cell (k) HeLa proteins detected using quantitative proteomics analysis after 48 h of treatment with 100 nM CXCL12–Ctx reveals highly selective EGFR degradation. Data are the mean of n = 2 biological independent experiments and two technical replicates. Proteins showing a greater than twofold change from PBS control with a significance of P < 0.01 were considered significantly changed. l, In vitro potency of CXCL12–Tras in MDA-MB-175VII cells demonstrates superior cell killing versus Tras IgG; n = 2 biologically independent experiments and three technical replicates. m, Quantification of CXCL12–Tras plasma levels in male nude mice injected intravenously at 5, 10 or 15 mg per kg (body weight); n = 3 different mice per group. Densitometry was used to calculate protein levels, and data were normalized to whole protein levels. Data are represented as mean values, and error bars represent the standard deviation of biological replicates. P values for CXCL11 data were determined by one-way ANOVA with Sidak’s multiple comparisons test. P values for cell viability assays were determined by unpaired two-tailed t-tests at each indicated dose. Source data
Fig. 4
Fig. 4. KineTACs enable intracellular uptake of soluble extracellular proteins.
a, Schematic of KineTAC concept for targeting extracellular proteins for lysosomal degradation. The red ball represents an extracellular protein bound to the KineTAC bi-specific. b, Representative flow cytometry results showing a shift in MFI in HeLa cells treated for 24 h with 50 nM CXCL12–Beva and 25 nM VEGF–647 compared to treatment with VEGF alone. c, Bar graph of flow cytometry results demonstrating significant uptake of VEGF–647 in HeLa cells following 24 h of treatment with 50 nM CXCL12–Beva compared to treatment with isotype control (P < 0.0001). Beva isotype control showed no difference compared to treatment with VEGF–647 alone (P = 8421); n = 3 biologically independent experiments. d, Comparison of HeLa cells lifted with versene (normal lift) or 0.25% trypsin-EDTA (trypsin lift) following 24 h of treatment with 50 nM CXCL12–Beva or isotype controls and 25 nM VEGF–647. No significant change in MFI for CXCL12–Beva treatment (P = 0.1121) suggests that fluorescence shift represents accumulation of intracellular VEGF–647 and not simple surface binding; n = 3 biologically independent experiments. e, Summary of flow cytometry results demonstrating a significant decrease in MFI in HeLa cells following pretreatment with 100 nM bafilomycin and 24 h of treatment with 50 nM CXCL12–Beva and 25 nM VEGF–647 (P = 0.0005) compared to no pretreatment with bafilomycin; n = 3 biologically independent experiments. f, Time-course experiment showing increase in VEGF–647 uptake over time in HeLa cells treated with 50 nM CXCL12–Beva and 25 nM VEGF–647; n = 3 biologically independent experiments. g, HeLa cells treated for 24 h with varying ratios of CXCL12–Beva to VEGF at constant 25 nM VEGF–647 demonstrate that increasing the KineTAC:VEGF ratio increases VEGF uptake; n = 3 biologically independent experiments. h, Panel of cell lines for VEGF–647 uptake experiments demonstrating significant VEGF–647 uptake following CXCL12–Beva treatment compared to following treatment with Beva isotype or VEGF alone in MDA-MB-231 (P = 0.048), NCI-H292 (P = 0.049), MCF7 (P = 0.017) and HeLa (P = 0.0005) cells; n = 3 biologically independent experiments. MFI was measured using live-cell flow cytometry. Data are represented as mean values, and error bars represent the standard deviation of biological replicates. P values were determined by unpaired two-tailed t-tests or one-way ANOVA with Sidak’s multiple comparisons test. Fold changes are reported relative to incubation with soluble ligand alone. Source data
Extended Data Fig. 1
Extended Data Fig. 1. KineTACs target cell surface protein PD-L1 for degradation.
a, Representative western blot showing PD-L1 levels after 24 hr treatment of MDA-MB-231 cells with 100 nM of atezolizumab control, CXCL12 isotype, or CXCL12-Atz. b, Representative western blot showing PD-L1 levels after 24 hr treatment of MDA-MB-231 cells with 100 nM CXCL12-Atz or 100 nM CXCL12 isotype + 100 nM atezolizumab Fab. c, Flow cytometry showing degradation of surface PD-L1 on MDA-MB-231 cells after 24 hr treatment with 100 nM CXCL12-Atz, but not after addition of controls. d, Levels of cell surface and whole cell PD-L1 after 24 hr treatment of MDA-MB-231 cells with 100 nM CXCL12-Atz or atezolizumab Fab shows marginal differences between cell surface and whole cell PD-L1 levels. e, Representative western blot showing PD-L1 levels after 24 hr treatment of MDA-MB-231 cells with high concentrations (50–500 nM) of CXCL12-Atz shows that no ‘hook effect’ is observed in this concentration range. Data are representative of at least three independent biological replicates. Densitometry was used to calculate protein levels and normalized to PBS control. Source data
Extended Data Fig. 2
Extended Data Fig. 2. KineTACs mediate degradation of additional therapeutically relevant cell surface proteins.
Dose escalation showing HER2 degradation in a, MDA-MB-175VII and b, SK-BR-3 cells following treatment with CXCL12-Tras or 100 nM trastuzumab Fab. c, Trend of HER2 levels to CXCR7/HER2 transcript level ratio as calculated by densitometry after treatment with 100 nM CXCL12-Tras for 24 hrs in MCF7, MDA-MB-175VII, and SK-BR-3 cells. N = 2 biologically independent experiments. Dose escalation showing EGFR degradation in d, MDA-MB-231, e, A431, and f, NCI-H292 cells following treatment with CXCL12-Ctx or 100 nM Cetuximab isotype. g, EGFR levels after treatment with 100 nM CXCL12-Ctx were significantly reduced compared to Ctx isotype control for 24 hrs in non-small cell lung cancer cell lines A549 (P = 0.011) and NCI-H358 (P = 0.023) but were unchanged in HCC827 (P = 0.4559) where EGFR is substantially overexpressed. N = 2 biologically independent experiments. h, Trend of EGFR levels to CXCR7/EGFR transcript level ratio as calculated by densitometry after treatment with 100 nM CXCL12-Ctx for 24 hrs in HeLa, A431, NCI-H292, MDA-MB-231, A549, NCI-H358, and HCC827 cells. N = 3 biologically independent experiments for HeLa and N = 2 biologically independent experiments for remaining cell lines. i, Dose escalation showing CDCP1 degradation in HeLa cells following treatment with CXCL12-4A06 or 100 nM 4A06 Fab. j, Dose escalation showing TROP2 degradation in MCF7 cells following treatment with CXCL12-Sacituzumab or sacituzumab isotype. Densitometry was used to calculate protein levels and normalized to PBS control. Data are represented as mean values and error bars represent the standard deviation of biological replicates. P-values were determined by unpaired two-tailed t-tests. Source data
Extended Data Fig. 3
Extended Data Fig. 3. KineTACs mediate degradation of PD-1 on primary human CD8 + T cells.
Representative flow cytometry showing presence of CD8 + T cell activation markers, a, PD-1 or b, CD25, following 4 day incubation with activation cocktail (IL-2, IL-15, anti-CD3, anti-CD28). c, Representative flow demonstrating cell surface PD-1 degradation on activated primary human CD8 + T cells following 24 hr treatment with 100 nM CXCL12-Nivo or nivolumab isotype.
Extended Data Fig. 4
Extended Data Fig. 4. Requirements for efficient KineTAC-mediated degradation.
a, Representative western blot showing PD-L1 levels after treatment with 100 nM CXCL12-Atz wild-type or alanine mutants for 24 hr in MDA-MB-231 cells. b, PD-L1 levels after treatment with CXCL12-Atz wild-type or CXCL12 N-terminal variants (100 nM) for 24 hr in MDA-MB-231 cells. c, Trend of PD-L1 levels to CXCR7 IC50 (nM) of CXCL12 variants after treatment with 100 nM CXCL12-Atz variants for 24 hrs in MDA-MB-231 cells. Wild-type CXCL12 is indicated in red. N = 3 biologically independent experiments. d, Schematic of EGFR extracellular domains (I-IV) with locations of anti-EGFR antibody epitopes (left) and crystal structure of domain III (PDB: 5SX4) with the epitopes of anti-EGFR binders highlighted in their respective colors. e, Trend of EGFR levels to KD after treatment with 100 nM CXCL12-Depa, Nimo, Pani, Neci, Matu, or Ctx for 24 hrs in HeLa cells. N = 3 biologically independent experiments. f, PD-L1 levels after treatment with 100 nM aglycosylated or glycosylated CXCL12-Atz for 24 hr in MDA-MB-231 cells. g, Schematic of CXCL12-Atz Fab fusion construct where CXCL12 chemokine is fused to the N-terminus of atezolizumab Fab via an Avi tag linker. h, Multipoint BLI measurement of CXCL12-Atz Fab fusion shows high affinity to PD-L1 Fc fusion. i, PD-L1 levels after treatment with 100 nM CXCL12-Atz bispecific or Fab fusion for 24 hr in MDA-MB-231 cells. j, Schematic of CXCL12-Atz IgG fusion construct where CXCL12 chemokine is fused to the N-terminus of the heavy chain (HC) or light chain (LC) of atezolizumab IgG via an Avi tag linker. k, PD-L1 levels were significantly reduced in MDA-MB-231 cells after 24 hr treatment with 100 nM CXCL12-Atz bispecific (P = 0.0222) but not with HC or LC IgG fusions (P = 0.2239 and 0.5202, respectively) compared to isotype controls. N = 2 biologically independent experiments. Densitometry was used to calculate protein levels and normalized to PBS control. Data are represented as mean values and error bars represent the standard deviation of biological replicates. P-values were determined by unpaired two-tailed t-tests. Source data
Extended Data Fig. 5
Extended Data Fig. 5. CXCL11 and vMIPII are alternative CXCR7-targeting KineTACs that degrade PD-L1 and EGFR.
a, Representative western blot showing PD-L1 degradation in MDA-MB-231 cells following 24 hr treatment with various doses of CXCL11-Atz or 100 nM atezolizumab Fab. b, Comparison of dose response of PD-L1 degradation in MDA-MB-231 cells following 24 hr treatment with CXCL11- or CXCL12-Atz. c, Representative western blot showing EGFR degradation in HeLa cells following 24 hr treatment with various doses of CXCL11-Ctx or 100 nM cetuximab isotype. d, Comparison of dose response of EGFR degradation in HeLa cells following 24 hr treatment with CXCL11- or CXCL12-Ctx. e, PD-L1 in MDA-MB-231 cells is degraded after 24 hr treatment with 100 nM vMIPII-Atz at levels similar to CXCL12-Atz (P = 0.0581). N = 3 biologically independent experiments. Data are represented as mean values and error bars represent the standard deviation of biological replicates. P-values were determined by one-way ANOVA with Sidak’s multiple comparisons test. Densitometry was used to calculate protein levels and normalized to PBS control. Source data
Extended Data Fig. 6
Extended Data Fig. 6. KineTACs are highly selective and functionally active in vitro.
a, Comparison between KineTAC and LYTAC whole cell quantitative proteomics experiments in HeLa cells shows large overlap in total proteins identified. b, 23 of 25 proteins that were significantly up- or down-regulated in the LYTAC dataset were identified in the KineTAC whole cell dataset. c, In vitro potency of CXCL12-Tras in HER2-expressing breast cancer cell line MDA-MB-175VII demonstrates superior cell killing compared to CXCL12 isotype, which is functionally inactive. N = 3 biologically independent experiments. d, In vitro potency of CXCL12-Tras in MDA-MB-175VII cells demonstrates superior cell killing compared to trastuzumab Fab alone. N = 3 biologically independent experiments. e, In vitro potency of CXCL12-Ctx in EGFR-expressing non-small cell lung cancer cell line NCI-H358 demonstrates superior cell killing compared to cetuximab IgG. N = 2 biologically independent experiments. Data are represented as mean values and error bars represent the standard deviation of biological replicates. P-values were determined by unpaired two-tailed t-tests at each indicated dose. Source data
Extended Data Fig. 7
Extended Data Fig. 7. CXCL12-Atz is cross-reactive to mouse cell lines and stable in vivo.
Flow cytometry showing that human CXCL12 is cross reactive and binds to the surface of a, MC38 and b, CT26 mouse cell lines. c, Dose escalation showing mouse PD-L1 degradation in MC38 and CT26 cells following 24 hr treatment with CXCL12-Atz. Representative western blot of dose escalation showing mouse PD-L1 degradation in d, MC38 or e, CT26 mouse cells following 24 hr treatment with CXCL12-Atz and mouse IFNg. f, Representative western blot showing plasma levels of CXCL12-Tras in male nude mice injected intravenously with 5, 10, or 15 mg/kg. Data are representative of three independent biological replicates or mice. Densitometry was used to calculate protein levels and normalized to PBS control. Data are represented as mean values and error bars represent the standard deviation of biological replicates. Source data
Extended Data Fig. 8
Extended Data Fig. 8. KineTACs mediate uptake of extracellular VEGF.
a, Representative flow cytometry showing levels of VEGF-647 cell surface labeling after incubation with HeLa cells for 1 hr at 4 °C and normal versene lift. b, Representative flow cytometry showing reduction of VEGF-647 cell surface labeling after incubation with HeLa cells for 1 hr at 4 °C and lift with 0.25% trypsin-EDTA (trypsin lift). c, Trend of VEGF uptake as calculated by flow cytometry to CXCR7 transcript levels. N = 3 biologically independent experiments. Data are represented as mean values and error bars represent the standard deviation of biological replicates. Linear regression analysis using GraphPad Prism was used to calculate the coefficient of determination (R2) to determine trend. Data are representative of two biological replicates. Source data
Extended Data Fig. 9
Extended Data Fig. 9. KineTACs mediate the uptake of extracellular TNFa.
a, Representative flow cytometry showing shift in median fluorescence intensity in HeLa cells treated for 24 hr with 50 nM CXCL12-Ada and 25 nM TNFa-647 compared to TNFa alone. b, Summary of flow cytometry demonstrating significant uptake of TNFa-647 in HeLa cells following 24 hr treatment with 50 nM CXCL12-Ada compared to adalimumab isotype (P = 0.0072). Adalimumab isotype showed no significant uptake of TNFa-647 compared to TNFa-647 alone (P = 0.8701). N = 3 biologically independent experiments. c, HeLa cells treated for 24 hr with varying ratios of CXCL12-Ada to TNFa, at constant 25 nM TNFa-647, demonstrate that increasing the KineTAC:TNFa ratio increases TNFa uptake. Data are represented as mean values and error bars represent the standard deviation of biological replicates. P-values were determined by one-way ANOVA with Sidak’s multiple comparisons test. Fold changes are reported relative to incubation with soluble ligand alone. Source data
Extended Data Fig. 10
Extended Data Fig. 10. IL2-bearing KineTACs can co-opt IL2R to degrade cell surface PD-1.
a, Schematic of the KineTAC concept for targeting cell surface proteins for lysosomal degradation via IL2-mediated endocytosis. b, Summary of flow cytometry data demonstrating significant degradation of cell surface PD-1 on activated primary human CD8 + T cells following 24 hr treatment with 100 nM IL2-Nivo compared to nivolumab isotype (P = 0.0049). % PD-1 was determined by median fluorescence intensity (MFI) of the PE fluorescence channel of live cells. N = 3 biologically independent experiments. Data are represented as mean values and error bars represent the standard deviation of biological replicates. P-values were determined by one-way ANOVA with Sidak’s multiple comparisons test. Source data

References

    1. Cotton AD, Nguyen DP, Gramespacher JA, Seiple IB, Wells JA. Development of antibody-based PROTACs for the degradation of the cell-surface immune checkpoint protein PD-L1. J. Am. Chem. Soc. 2021;143:593–598. doi: 10.1021/jacs.0c10008. - DOI - PMC - PubMed
    1. Banik SM, et al. Lysosome-targeting chimaeras for degradation of extracellular proteins. Nature. 2020;584:291–297. doi: 10.1038/s41586-020-2545-9. - DOI - PMC - PubMed
    1. Caianiello DF, et al. Bifunctional small molecules that mediate the degradation of extracellular proteins. Nat. Chem. Biol. 2021;17:947–953. doi: 10.1038/s41589-021-00851-1. - DOI - PubMed
    1. Zhou Y, Teng P, Montgomery NT, Li X, Tang W. Development of triantennary N-acetylgalactosamine conjugates as degraders for extracellular proteins. ACS Cent. Sci. 2021;7:499–506. doi: 10.1021/acscentsci.1c00146. - DOI - PMC - PubMed
    1. Pettersson M, Crews CM. PROteolysis TArgeting Chimeras (PROTACs)—past, present and future. Drug Discov. Today Technol. 2019;31:15–27. doi: 10.1016/j.ddtec.2019.01.002. - DOI - PMC - PubMed

Publication types