. 2022 Oct;19(10):1286-1294.
doi: 10.1038/s41592-022-01597-x. Epub 2022 Sep 22.

A fluorescent sensor for real-time measurement of extracellular oxytocin dynamics in the brain

Affiliations

A fluorescent sensor for real-time measurement of extracellular oxytocin dynamics in the brain

Daisuke Ino et al. Nat Methods. 2022 Oct.

Abstract

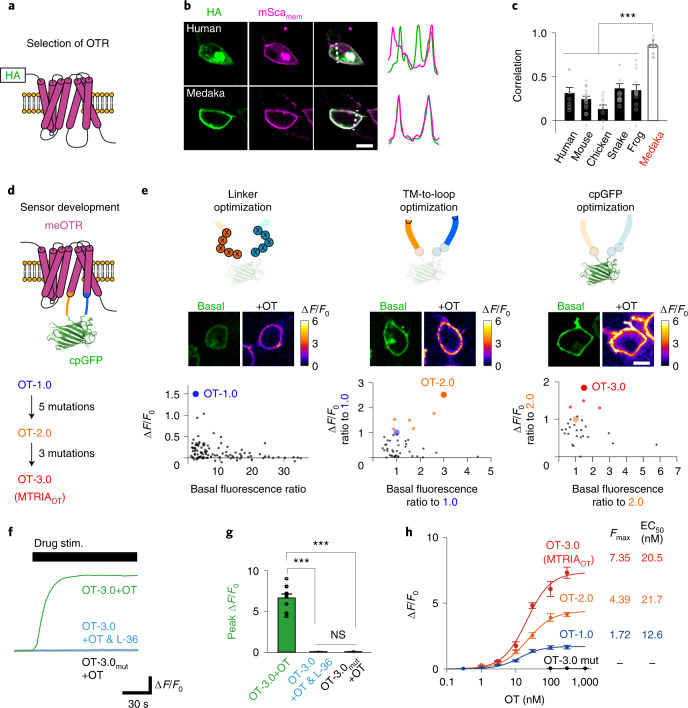
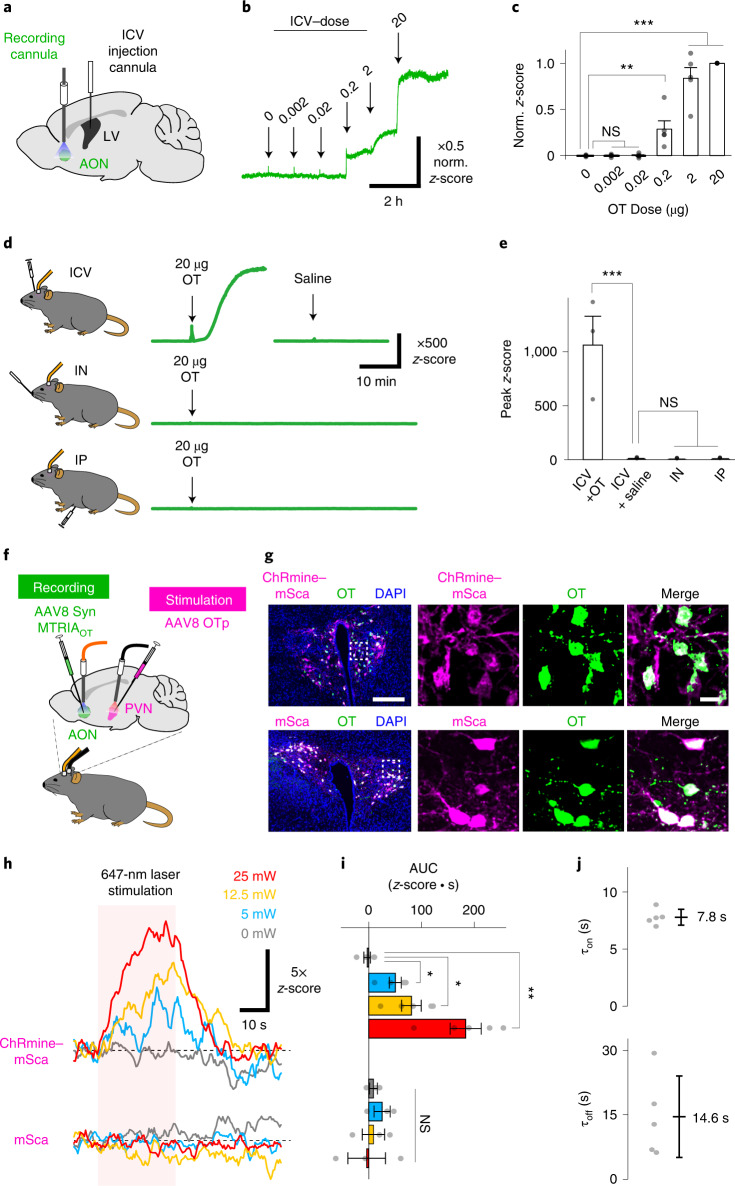
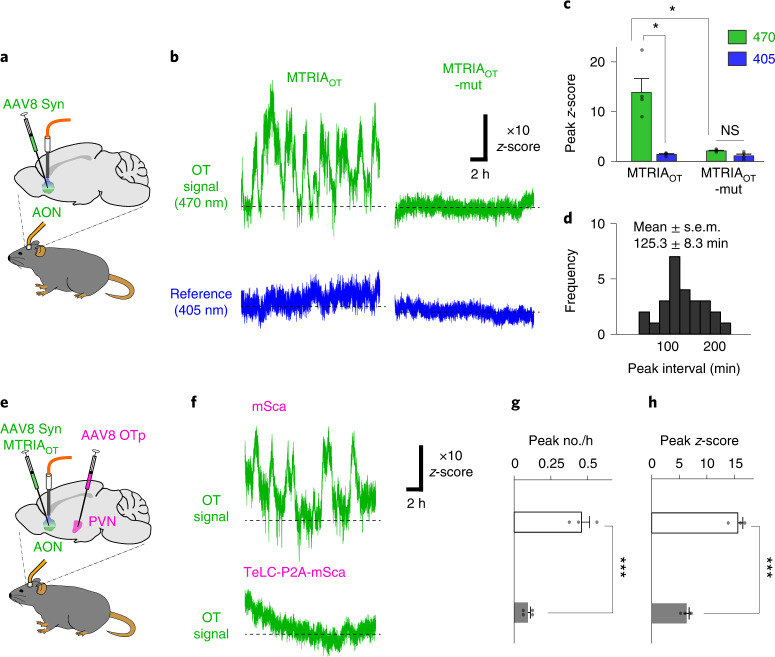
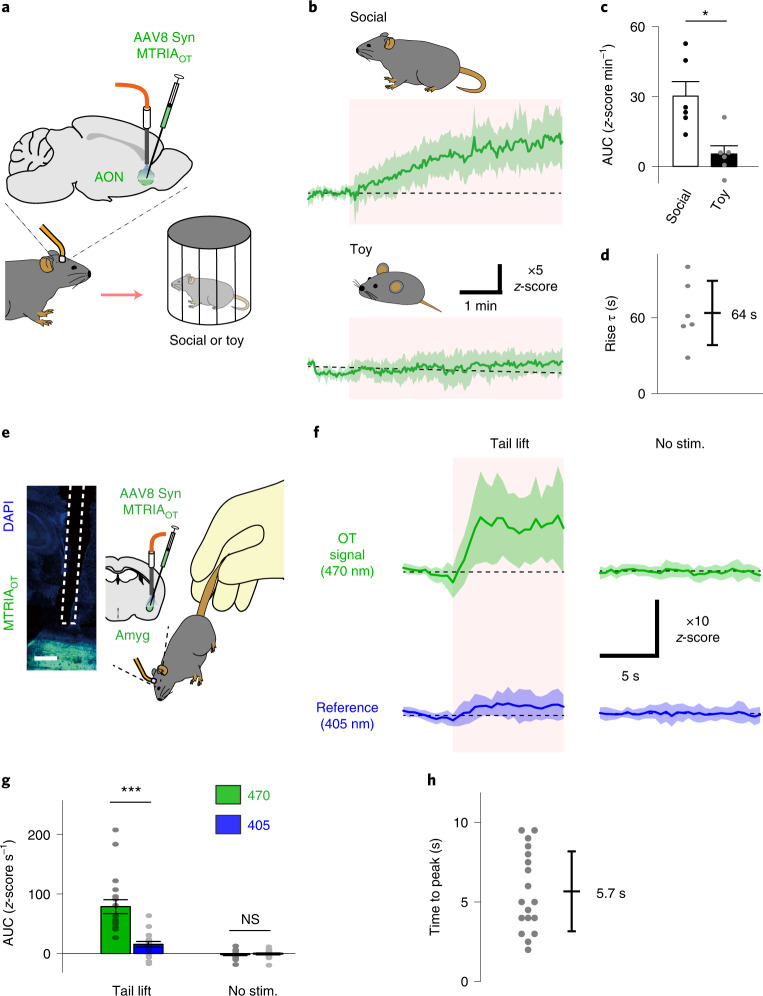
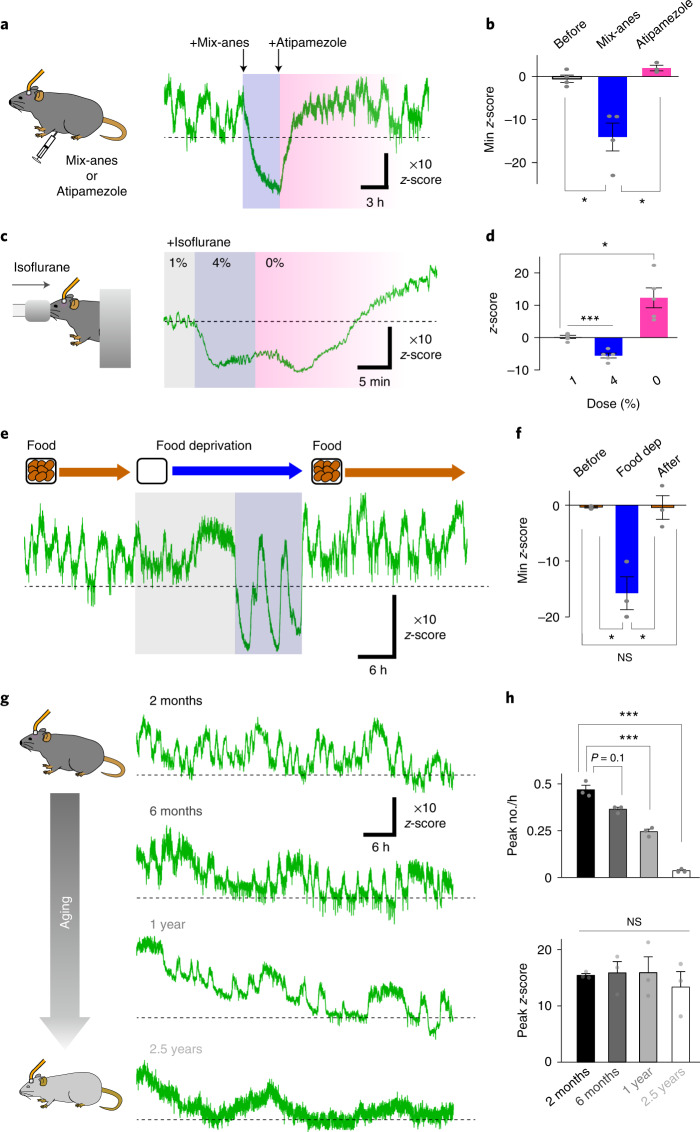
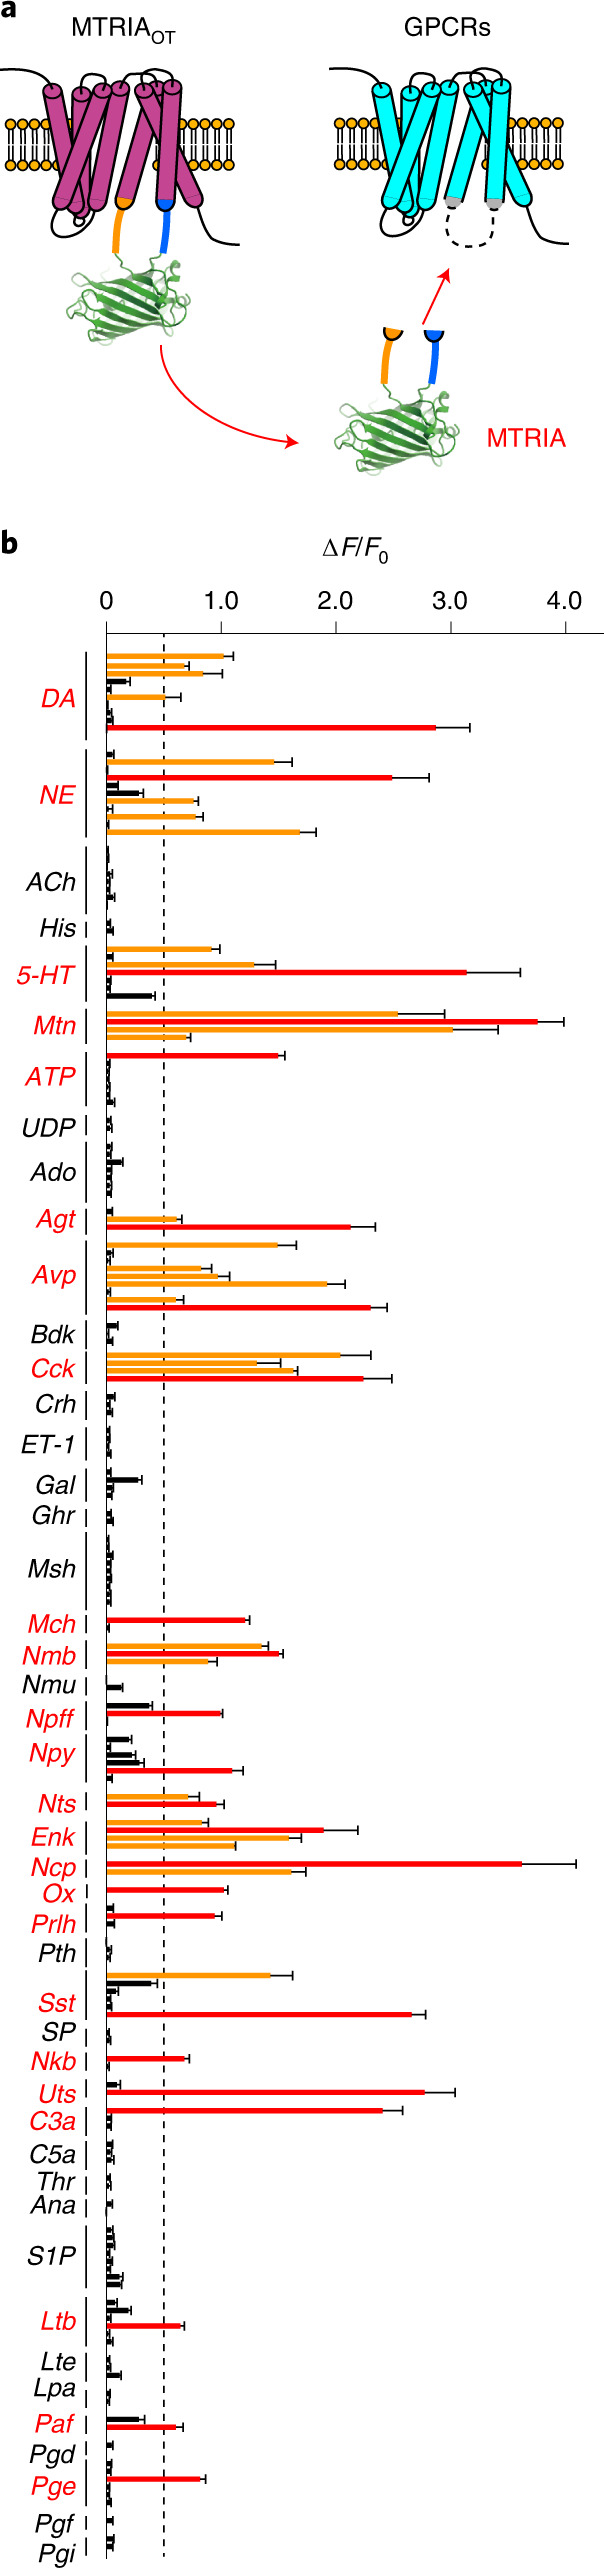
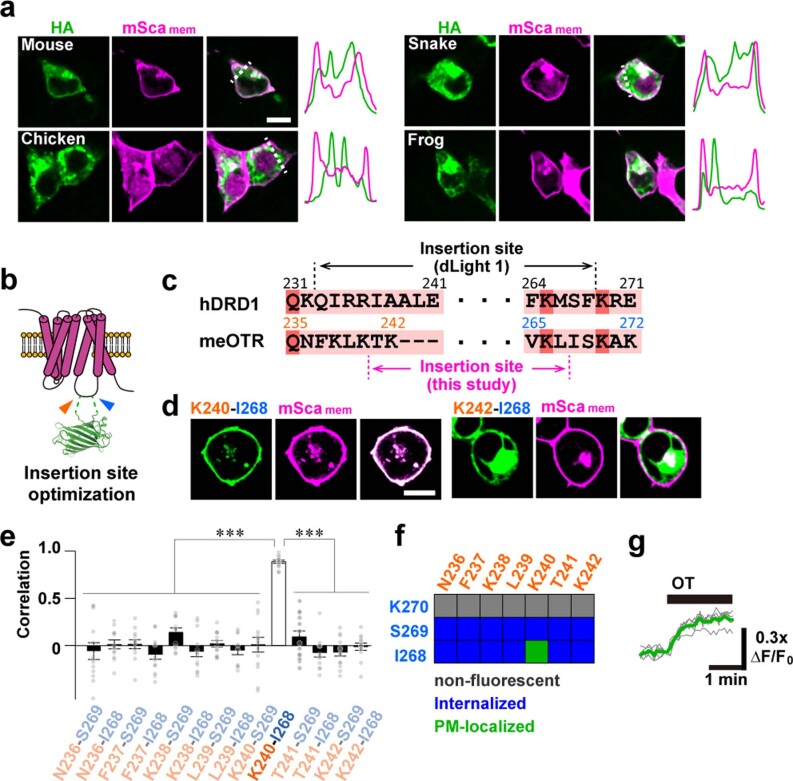
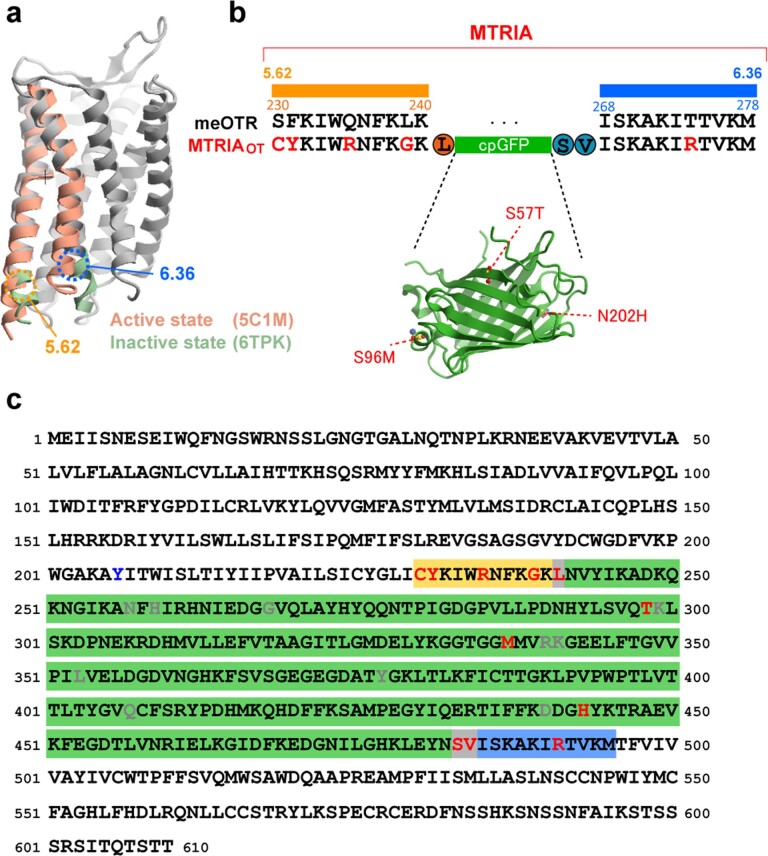
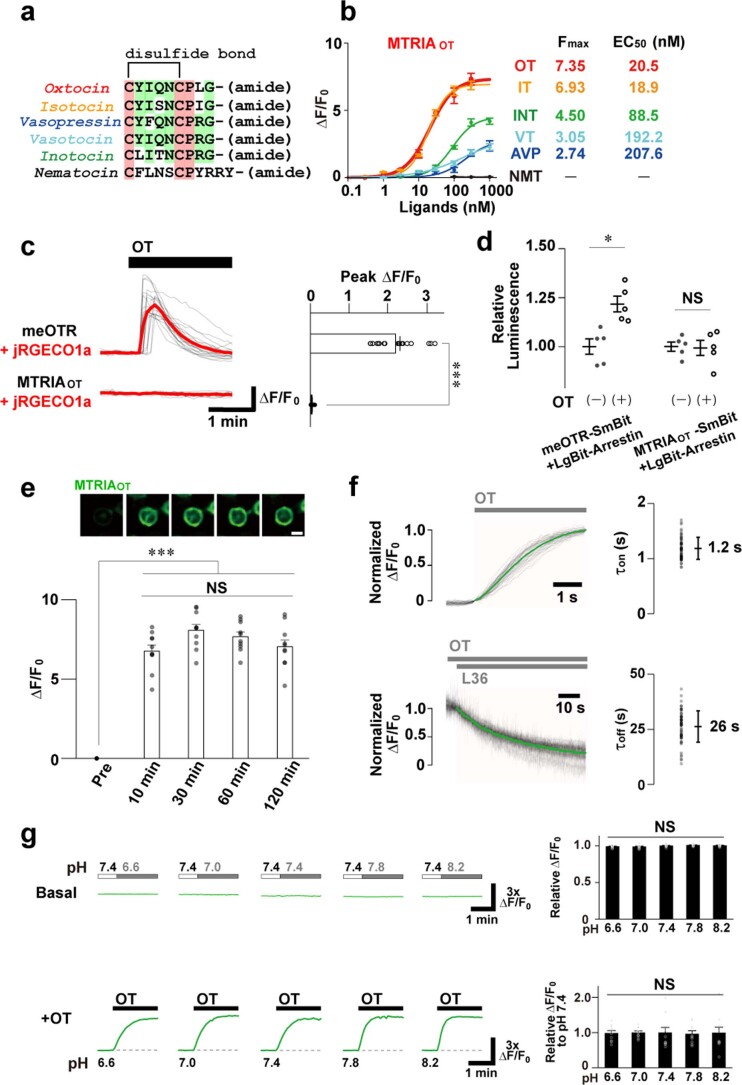
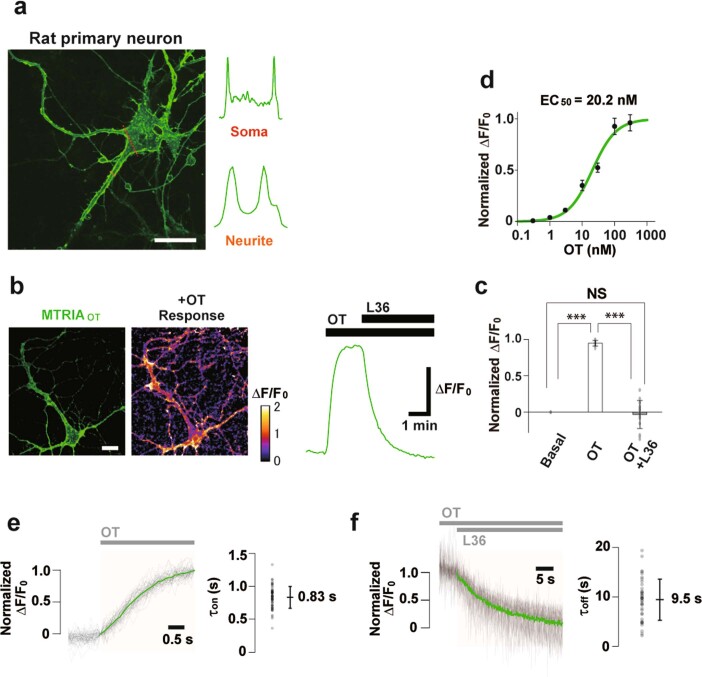
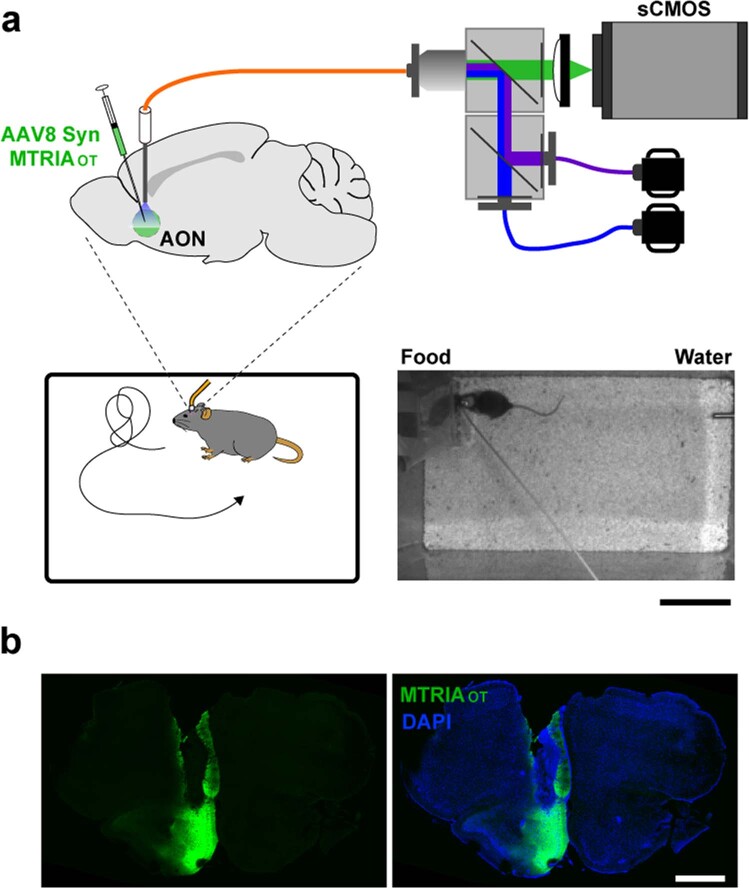
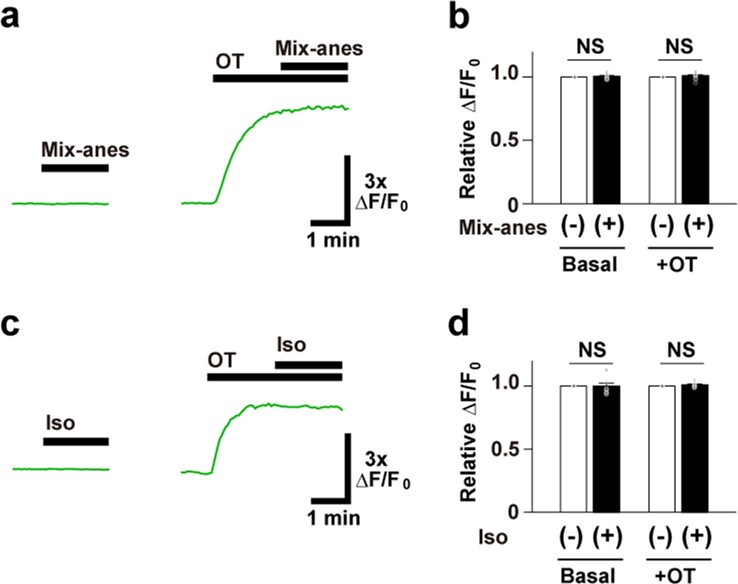
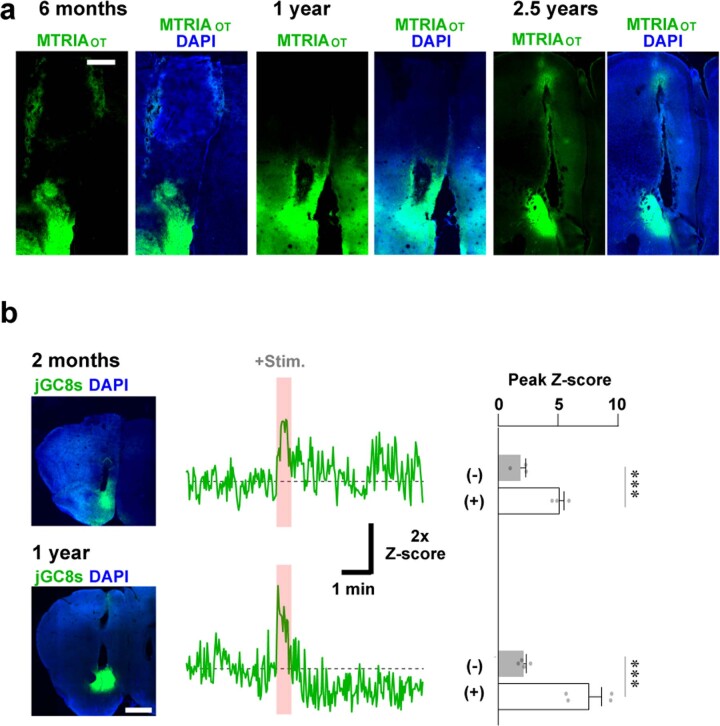
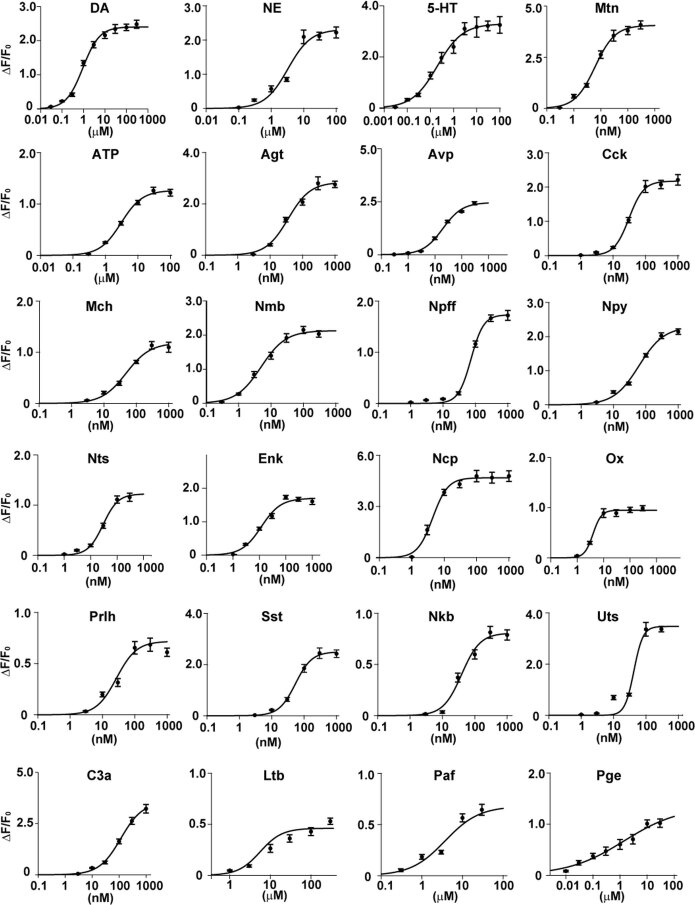
Oxytocin (OT), a hypothalamic neuropeptide that acts as a neuromodulator in the brain, orchestrates a variety of animal behaviors. However, the relationship between brain OT dynamics and complex animal behaviors remains largely elusive, partly because of the lack of a suitable technique for its real-time recording in vivo. Here, we describe MTRIAOT, a G-protein-coupled receptor-based green fluorescent OT sensor that has a large dynamic range, suitable affinity, ligand specificity for OT orthologs, minimal effects on downstream signaling and long-term fluorescence stability. By combining viral gene delivery and fiber photometry-mediated fluorescence measurements, we demonstrate the utility of MTRIAOT for real-time detection of brain OT dynamics in living mice. MTRIAOT-mediated measurements indicate variability of OT dynamics depending on the behavioral context and physical condition of an animal. MTRIAOT will likely enable the analysis of OT dynamics in a variety of physiological and pathological processes.


Conflict of interest statement

The authors declare no competing interests.

Figures

Fig. 1
Fig. 1. Development of a fluorescent oxytocin sensor.
a, Schematic of a PM-localized OTR conjugated with an HA-tag at the N terminus. b, Images of HEK293T cells coexpressing an HA-tagged OTR (HA, green) and PM-targeted mScarlet (mScamem, magenta). Traces on right compare the normalized fluorescence intensities of HA and mScamem signals along the dotted lines. c, Summary of Pearson correlation coefficients of fluorescence signals in b (n = 8, 17, 10, 10, 12 and 17 cells for human, mouse, chicken, snake, frog and medaka, respectively). Statistics used were one-way analysis of variance (ANOVA; F5,68 = 2.35, P = 4.9 × 10−19) with Bonferroni post hoc test (P = 3.3 × 10−9, human versus medaka; P = 8.9 × 10−9, mouse versus medaka; P = 5.4 × 10−14, chicken versus medaka; P = 2.4 × 10−19, snake versus medaka; P = 2.3 × 10−8, frog versus medaka). d, Schematic of the sensor architecture. e, Development of a sensitive fluorescent OT sensor over a three-step screening; optimization of linker regions, TM-to-loop region and cpGFP moiety. Schematics of mutagenesis (top), basal fluorescence images and heat maps depicting responses to 100 nM OT (middle), and scatterplots describing the relationship between basal brightness and the fluorescence response to 100 nM OT (bottom). f, Representative traces of fluorescence responses upon simulation with the indicated drug (green, OT-3.0-expressing cells upon stimulation with OT; cyan, OT-3.0-expressing cells upon stimulation with a mixture of OT and L-36; gray, OT-3.0-mut-expressing cells upon stimulation with OT). g, Summary of peak ΔF/F0 values (n = 10 cells per group). Statistics used were one-way ANOVA (F2,27 = 3.35, P = 5.7 × 10−16) with Bonferroni post hoc test (P = 4.3 × 10−10, left versus middle; P = 4.3 × 10−10, left versus right; P = 1, middle versus right). h, Dose–response curves of sensors (n = 10 cells per point). Fmax and EC50 values are summarized on the right. Scale bars, 10 µm (b and e). Graphs represent the mean ± s.e.m. (c, g and h). ***P < 0.001, NS, not significant (c and g). Source data
Fig. 2
Fig. 2. In vivo real-time measurement of brain oxytocin dynamics following exogenous oxytocin administration and optogenetic stimulation of oxytocin neurons.
a, Schematic illustrating fiber photometry recording of MTRIAOT in the AON. b, Representative trace of the z-scored fluorescence intensity of MTRIAOT following intracerebroventricular (ICV) injection of OT at the indicated doses. The amplitude of the signal is shown as a value normalized against the peak value of the highest dose (norm. z-score). c, Summary of normalized z-score (n = 5 mice). d, Representative traces of z-scores upon stimulation with either 20 µg OT or saline via the indicated administration routes (ICV, intranasal (IN) and intraperitoneal (IP)). e, Summary of peak z-scores (n = 3 mice). f, Schematic illustrating fiber photometry recording of MTRIAOT in the AON upon optogenetic stimulation of OT neurons in the PVN. g, Histological images showing transduction of the indicated gene products (ChRmine–mSca and mSca) in OT-positive neurons in the PVN. Overlaid images of the indicated gene product (magenta), OT staining (green) and DAPI staining (blue) are shown to the left. Magnified images within the dashed rectangles are shown on the right. h, Representative traces of MTRIAOT responses to the light stimuli at the indicated powers recorded in a mouse expressing either ChRmine–mSca or mSca in OT neurons. The period of light stimulation is indicated by the pink-shaded area. i, Summary of area under the curve (AUC) values during light stimulation (n = 5 mice in ChRmine–mSca, n = 3 mice in mSca). j, Summary of rise and decay time constants (n = 5 mice). Scale bars, 200 µm (left) and 20 µm (right) in g. Graphs represent the mean ± s.e.m. (c, e and i) and the mean ± s.d. (j). ***P < 0.001, **P < 0.01, *P < 0.05, NS (c, e and i). Statistics (c, e and i) are summarized in Supplementary Note 2. Source data
Fig. 3
Fig. 3. In vivo real-time measurement of brain oxytocin oscillation in freely behaving mice.
a, Schematic illustrating fiber photometry recording of MTRIAOT in the AON in freely behaving mice. b, Representative traces of 470-nm-excited signals (green) and 405-nm-excited signals (blue) from either MTRIAOT-expressing or MTRIAOT-mut-expressing mice. c, Summary of peak z-scores (n = 4 mice). Statistics used were one-way ANOVA (F3,12 = 3.49, P = 7.4 × 10−5) with Bonferroni post hoc test (P = 0.026, 470 nm versus 405 nm in MTRIAOT; P = 0.034, 470 nm in MTRIAOT versus 470 nm in MTRIAOT-mut; P = 0.21, 470 nm versus 405 nm in MTRIAOT-mut). d, Frequency histogram showing the intervals of OT signal peaks (n = 26 events from four mice). e, Schematic illustrating experimental protocol for assessing the involvement of OT release from PVN neurons in OT signal increases in the AON. f, Representative traces of MTRIAOT activities recorded from mice either expressing mSca or coexpressing TeLC and mSca in the PVN. g,h, Summary of the peak number every hour (g) and peak z-score (h; n = 3 mice in mSca and n = 4 mice in TeLC-P2A-mSca). Statistics used were an unpaired two-tailed t-test (P = 8.2 × 10−4 in g and P = 1.6 × 10−4 in h). Graphs represent the mean ± s.e.m. (c, g and h). ***P < 0.001, *P < 0.05, NS (c, g and h). Source data
Fig. 4
Fig. 4. In vivo real-time measurement of brain oxytocin responses upon social interaction and acute stress.
a, Schematic illustrating fiber photometry recording of social interaction-induced OT responses. b, Mean z-scored traces (green thick lines) showing MTRIAOT responses to encounters with either a mouse (top) or a toy (bottom). The regions covering s.d. values of the traces are shaded in light green. Stimulation was applied during the periods shaded in pink. c, Summary of AUC values during stimulation (n = 6 mice). Statistics used were a paired two-tailed t-test (P = 0.03). d, Summary of rise time constants for social interaction-induced OT responses determined by a single-exponential fitting (n = 6 mice). e, Histological verification of sensor expression around the recording region (left) and schematic illustrating fiber photometry recording of social interaction-induced OT responses (right). f, Mean z-scored traces showing MTRIAOT responses (green, 470-nm-excited signal; blue, 405-nm-excited signal) either following tail lift (left, tail lift) or without simulation (right: no stim.). The regions covering s.d. values of the traces are shaded in light colors. Tail lift was applied during the periods shaded pink. g, Summary of AUC values during stimulation (n = 18 trials from three mice). Statistics used were one-way ANOVA (F3,68 = 2.74, P = 7.5 × 10−14) with Bonferroni post hoc test (P = 5.0 × 10−5, 470 versus 405 in tail lift, P = 1 in 470 versus 405 in no stim.). h, Summary of times to peak for tail lift-induced OT responses (n = 18 trials from three mice). Scale bar, 200 µm (e). Graphs represent the mean ± s.e.m. (c and g) and mean ± s.d. (b, d, f and h). ***P < 0.001, *P < 0.05, NS (c and g). Source data
Fig. 5
Fig. 5. Alterations in brain oxytocin levels caused by anesthesia, food deprivation and aging.
a, Schematic illustrating the recording and representative trace of MTRIAOT activity showing the impact of mix-anes on OT oscillation. The background of the trace is shaded to indicate the period of anesthesia after mix-anes administration (dark blue) and period after release by the antagonist, atipamezole (pink). b, Summary of minimum z-score values before mix-anes administration, after administration of mix-anes and following subsequent administration of atipamezole (n = 4 mice in before and mix-anes, n = 3 mice in atipamezole). c, Schematic of the recording and representative trace of MTRIAOT activity showing the impact of isoflurane on OT signal. The background of the trace is shaded to indicate the period of 1% isoflurane administration (gray), of 4% isoflurane administration (dark blue), and after release from the anesthesia (0%, pink). d, Summary of the tail values of z-scores during the above three states (n = 5 mice). e, Representative trace of MTRIAOT activity showing the impact of food deprivation on OT oscillation. The background of the trace is shaded to indicate the period of food deprivation. The period of OT turbulence is colored dark blue and the peaks of undershot signal are indicated by arrowheads. f, Summary of minimum z-score values before, during and after food deprivation (n = 3 mice). g, Representative traces of MTRIAOT fluorescence signals in mice at the indicated age (2 months, 6 months, 1 year or 2.5 years). h, Summary of the peak number every hour (top) and peak z-score (bottom; n = 3 mice). Graphs represent the mean ± s.e.m. (b, d, f and h). ***P < 0.001, *P < 0.05 and NS unless otherwise stated (b, d, f and h). Statistics (b, d, f and h) are summarized in Supplementary Note 3. Source data
Fig. 6
Fig. 6. Development of various G-protein-coupled receptor-based sensors by conjugation with MTRIA.
a, Schematic illustrating the development of MTRIA sensors. b, ΔF/F0 values are given as the mean ± s.e.m. (n = 5 cells for each group). Sensors with ΔF/F0 > 0.5 are colored either red or orange. Sensors with the best performance among receptors sharing the same ligand are colored red. Source data
Extended Data Fig. 1
Extended Data Fig. 1. Optimization of a fluorescent OT sensor.
a, Representative images of HEK293T cells co-expressing an HA-tagged OTR (green) and a mScamem (magenta). Normalized fluorescence intensities on the dotted lines are shown on the right. b, Schematic representation of cpGFP insertion into the IL3 of OTR. c, Sequence alignment of regions of the IL3 of human dopamine receptor D1 (hDRD1), a scaffold of a dopamine sensor (dLight1), and meOTR. d, Representative images of HEK293T cells co-expressing the indicated meOTR-cpGFP chimera (green) and mScamem (magenta). e, Pearson correlation coefficients comparing meOTR-cpGFP chimeras and mScamem are summarized as mean ± SEM (n = 13, 12, 12, 13, 12, 13, 13, 11, 13, 13, 13, 12, 13, and 12 cells; left to right). Statistics: one-way ANOVA (F13,167 = 1.78, P = 5.5 × 10⁻³²) with Bonferroni post-hoc test (P = 5.1 × 10⁻⁹: N236–S269, P = 7.9 × 10⁻¹⁴: N236–I268, P = 1.2 × 10⁻¹³: F237–S269, P = 4.1 × 10⁻¹⁴: F237–I268, P = 3.1 × 10⁻¹²: K238–S269, P = 4.9 × 10⁻¹⁴: K238–I268, P = 1.6 × 10⁻¹⁶: L239–S269, P = 2.9 × 10⁻¹⁴: L239–I268, P = 1.2 × 10⁻⁹: K240–S269, P = 9.6 × 10⁻¹¹: T241–S269, P = 5.4 × 10⁻¹⁵: T241–I268, P = 2.7 × 10⁻¹⁶: K242–S269, P = 2.0 × 10⁻¹⁶: K242–I268, compared with K240–I268). ***P < 0.001. f, Summary of insertion site-dependent characteristics of meOTR-cpGFP chimeras. g, Traces showing fluorescence responses of the K240–I268 meOTR-cpGFP chimera upon stimulation with 100 nM OT. Scale bars, 10 µm (a, d). Source data
Extended Data Fig. 2
Extended Data Fig. 2. Sequence of our fluorescent OT sensor.
a, Superposition of active- and inactive-GPCR structures, adapted from the Protein Data Bank (PDB) archives (IDs: 5C1M and 6TPK). TM5–TM6 regions of active and inactive states are colored pink and green, respectively. b, Alignment of the TM5–TM6 region between meOTR and MTRIAOT; the structure of cpGFP is adapted from a PDB archive (ID: 3SG2). Mutations introduced in MTRIAOT are shown as red. c, Full amino acid sequence of MTRIAOT. Mutations in MTRIAOT, the point mutation in MTRIAOT-mut, and mutations of cpGFP that were adapted in the other fluorescent sensors are shown in red, blue, and gray, respectively.
Extended Data Fig. 3
Extended Data Fig. 3. The basic properties of MTRIAOT in HEK293T cells.
a, Sequence alignment of OT and its orthologous neuropeptides. b, Dose-response curves of MTRIAOT to OT and its orthologous neuropeptides (n = 10 cells per point). c, Assay for G protein coupling. Traces of jRGECO1a fluorescence responses in either meOTR- or MTRIAOT-co-expressing cells upon stimulation with 100 nM OT (gray: each trace, red: average trace). Summary of peak ΔF/F0 responses are shown on the right (n = 20 cells). d, Assay for β-arrestin coupling. Traces showing the relative luminescence increase induced by NanoLuc luciferase complementation upon stimulation with 100 nM OT (n = 5 wells). e, Time-course of the fluorescence intensity of MTRIAOT over 120 min following 100 nM OT stimulation. Representative images (top) and summary of ΔF/F0 responses (bottom: n = 10 cells). f, Traces showing the kinetics of MTRIAOT in the fluorescence rise (top left: τon) upon 5 μM OT and decay (bottom left: τoff) upon 300 nM OT and subsequent 10 μM L36 (gray: each trace, green: average trace; n = 60 cells). The time constants determined by a single-exponential fitting are summarized to the right. g, Representative traces showing the dependence of MTRIAOT fluorescence intensity on extracellular pH (left top: basal fluorescence levels, bottom: OT-induced responses). Summary of basal fluorescence levels normalized by the value just before pH change (right top: n = 10 cells) and OT-induced responses formalized by the mean of ΔF/F0 at pH 7.4 (right bottom: n = 10 cells). Scale bar, 10 µm (e). Graphs represent mean ± SEM (b–e, g) and mean ± SD (f). ***P < 0.001, *P < 0.05, NS: not significant (c–e, g). Statistics (b, d, e, g) are summarized in Supplementary Note 4. Source data
Extended Data Fig. 4
Extended Data Fig. 4. The basic properties of MTRIAOT in rat hippocampal primary neurons.
a, Representative image showing a rat primary neuron expressing MTRIAOT and profiles of fluorescence intensities along the dotted lines (red: soma, orange: neurite). b, Fluorescence image (left), heatmap image depicting the response to 300 nM OT (middle), and representative trace of MTRIAOT response upon 300 nM OT and subsequent 1 μM L36 (right). c, Summary of ΔF/F0 responses normalized by a peak value during OT stimulation (n = 15 cells). Statistics: one-way ANOVA (F2, 42 = 3.22, P = 3.5 × 10⁻²⁷) with Bonferroni post-hoc test (P = 1.0 × 10⁻²⁰: Basal vs. OT, P = 8.1 × 10⁻¹¹: OT vs. OT + L36, P = 1: Basal vs. OT + L36). d, Dose-response curves of MTRIAOT in primary neurons (n = 18, 24, 26, 18, 15, 35, and 42 cells for 0.3, 1, 3, 10, 30, 100, and 300 nM, respectively). Values were normalized against a maximum value of the fitted-sigmoidal curve. e–f, Traces showing the kinetics of MTRIAOT in the fluorescence rise (e left: τon) upon 5 μM OT and decay (f left: τoff) upon 300 nM OT and subsequent 1 μM L36 (gray: each trace, green: average trace; n = 59 cells in e and 38 cells in f). Time constants determined by a single-exponential fitting are summarized to the right. Scale bars, 20 µm (a) and 30 µm (b). Graphs represent mean ± SEM (c, d) and mean ± SD (e, f). ***P < 0.001, NS: not significant (c). Source data
Extended Data Fig. 5
Extended Data Fig. 5. Fiber photometry setup and confirmation of the measurement site.
a, Schematic illustrating fiber photometry measurements in a freely behaving mouse. A representative image of an experimental arena captured by an overhead camera is shown in the bottom right. b, Histology showing expression of MTRIAOT (green) and the placement of an implanted cannula. DAPI (blue) was used for counterstaining nuclei. Scale bars, 10 cm (a) and 1 mm (b).
Extended Data Fig. 6
Extended Data Fig. 6. Histological verification of specific gene transduction in OT neurons.
Histology showing transduction of the indicated AAV vectors (left: AAV8 OTp mSca; right: AAV8 OTp TeLC P2A mSca) in OT-positive neurons in the PVN. Overlaid images of mSca (magenta), OT staining (green), and DAPI staining (blue) are shown in the top panels. Magnified images within the dotted rectangles are shown in the bottom panels. Scale bars, 100 µm (top) and 20 µm (bottom).
Extended Data Fig. 7
Extended Data Fig. 7. Effects of anesthetic drugs on MTRIAOT fluorescence level in HEK293T cells.
a, Representative traces (left: basal fluorescence level, right: OT-induced response) showing the dependence of MTRIAOT fluorescence intensity on mix-anes (0.11 mg/mL dexmedetomidine hydrochloride, 0.6 mg/mL midazolam, and 0.75 mg/mL butorphanol tartrate). b, Summary of ΔF/F0 responses by the value just before mix-anes application (n = 10 cells). Statistics: paired two-tailed t-test (P = 0.48: Basal, P = 0.24: +OT). c, Representative traces (basal fluorescence level: left, OT-induced response: right) showing the dependence of MTRIAOT fluorescence intensity on isoflurane (1:100 dilution). d, Summary of ΔF/F0 responses by the value just before isoflurane application (n = 10 cells). Statistics: paired two-tailed t-test (P = 0.97: Basal, P = 0.18: +OT). Graphs represent mean ± SEM (b, d). NS: not significant (b, d). Source data
Extended Data Fig. 8
Extended Data Fig. 8. Verification of sensor expression and viability of brain tissue following surgery in aged mice.
a, Histology showing transduction of MTRIAOT in the AON of mice at 6 months, 1 year, and 2.5 years of age (green: MTRIAOT, blue: DAPI). b, Data on fiber photometry recordings of odor-induced Ca2+ responses in the AON using mice aged either 2 months (top) or 1 year (bottom). Histology showing jGCaMP8s expression (left), representative traces of the recordings (middle), and summary of peak z-scores of the jGCaMP8s signals before (-) and during (+) odor simulation are summarized (n = 3 mice for 2 months and n = 4 mice for 1 year), respectively. As an odor stimulant, a small piece of a filter paper soaked with limonene was displayed for 30 s during the period shown in pink in the middle panel. Statistics: unpaired two-tailed t-test (P = 0.006: 2 months, P = 0.002: 1 year). Graphs represent mean ± SEM (b). ***P < 0.01 (b). Scale bars, 500 µm (a) and 1 mm (b). Source data
Extended Data Fig. 9
Extended Data Fig. 9. Dose-response curves of MTRIA sensors.
Dose-response curves of the fluorescent sensors for 24 ligands that were examined in HEK293T cells. Data are shown as mean ± SEM (n = 10 cells for each data point). Ligands were as follows: dopamine (DA), norepinephrine (NE), serotonin (5-HT), melatonin (Mtn), adenosine 5′-triphosphate (ATP), angiotensin (Agt), arginine-vasopressin (Avp), cholecystokinin (Cck), melanin-concentrating hormone (Mch), neuromedin B (Nmb), neuropeptide FF (Npff), neuropeptide Y (Npy), neurotensin (Nts), enkephalin (Enk), nociception (Ncp), orexin (Ox), prolactin-releasing hormone (Prlh), somatostatin (Sst), neurokinin B (Nkb), urotensin (Uts), complement component C3a (C3a), leukotriene B (Ltb), platelet-activating factor (Paf), and prostaglandin E (Pge). Source data

References

    1. Jurek B, Neumann ID. The oxytocin receptor: from intracellular signaling to behavior. Physiol. Rev. 2018;98:1805–1908. doi: 10.1152/physrev.00031.2017. - DOI - PubMed
    1. Cochran DM, Fallon D, Hill M, Frazier JA. The role of oxytocin in psychiatric disorders: a review of biological and therapeutic research findings. Harv. Rev. Psychiatry. 2013;21:219–247. doi: 10.1097/HRP.0b013e3182a75b7d. - DOI - PMC - PubMed
    1. Huffmeijer R, van Ijzendoorn MH, Bakermans-Kranenburg MJ. Ageing and oxytocin: a call for extending human oxytocin research to ageing populations—a mini-review. Gerontology. 2013;59:32–39. doi: 10.1159/000341333. - DOI - PubMed
    1. Kosfeld M, Heinrichs M, Zak PJ, Fischbacher U, Fehr E. Oxytocin increases trust in humans. Nature. 2005;435:673–676. doi: 10.1038/nature03701. - DOI - PubMed
    1. Leng G, Ludwig M. Intranasal oxytocin: myths and delusions. Biol. Psychiatry. 2016;79:243–250. doi: 10.1016/j.biopsych.2015.05.003. - DOI - PubMed

Publication types