. 2022 Oct;3(10):1228-1246.
doi: 10.1038/s43018-022-00427-5. Epub 2022 Sep 22.

Mesenchymal and adrenergic cell lineage states in neuroblastoma possess distinct immunogenic phenotypes

Affiliations

Mesenchymal and adrenergic cell lineage states in neuroblastoma possess distinct immunogenic phenotypes

Satyaki Sengupta et al. Nat Cancer. 2022 Oct.

Abstract

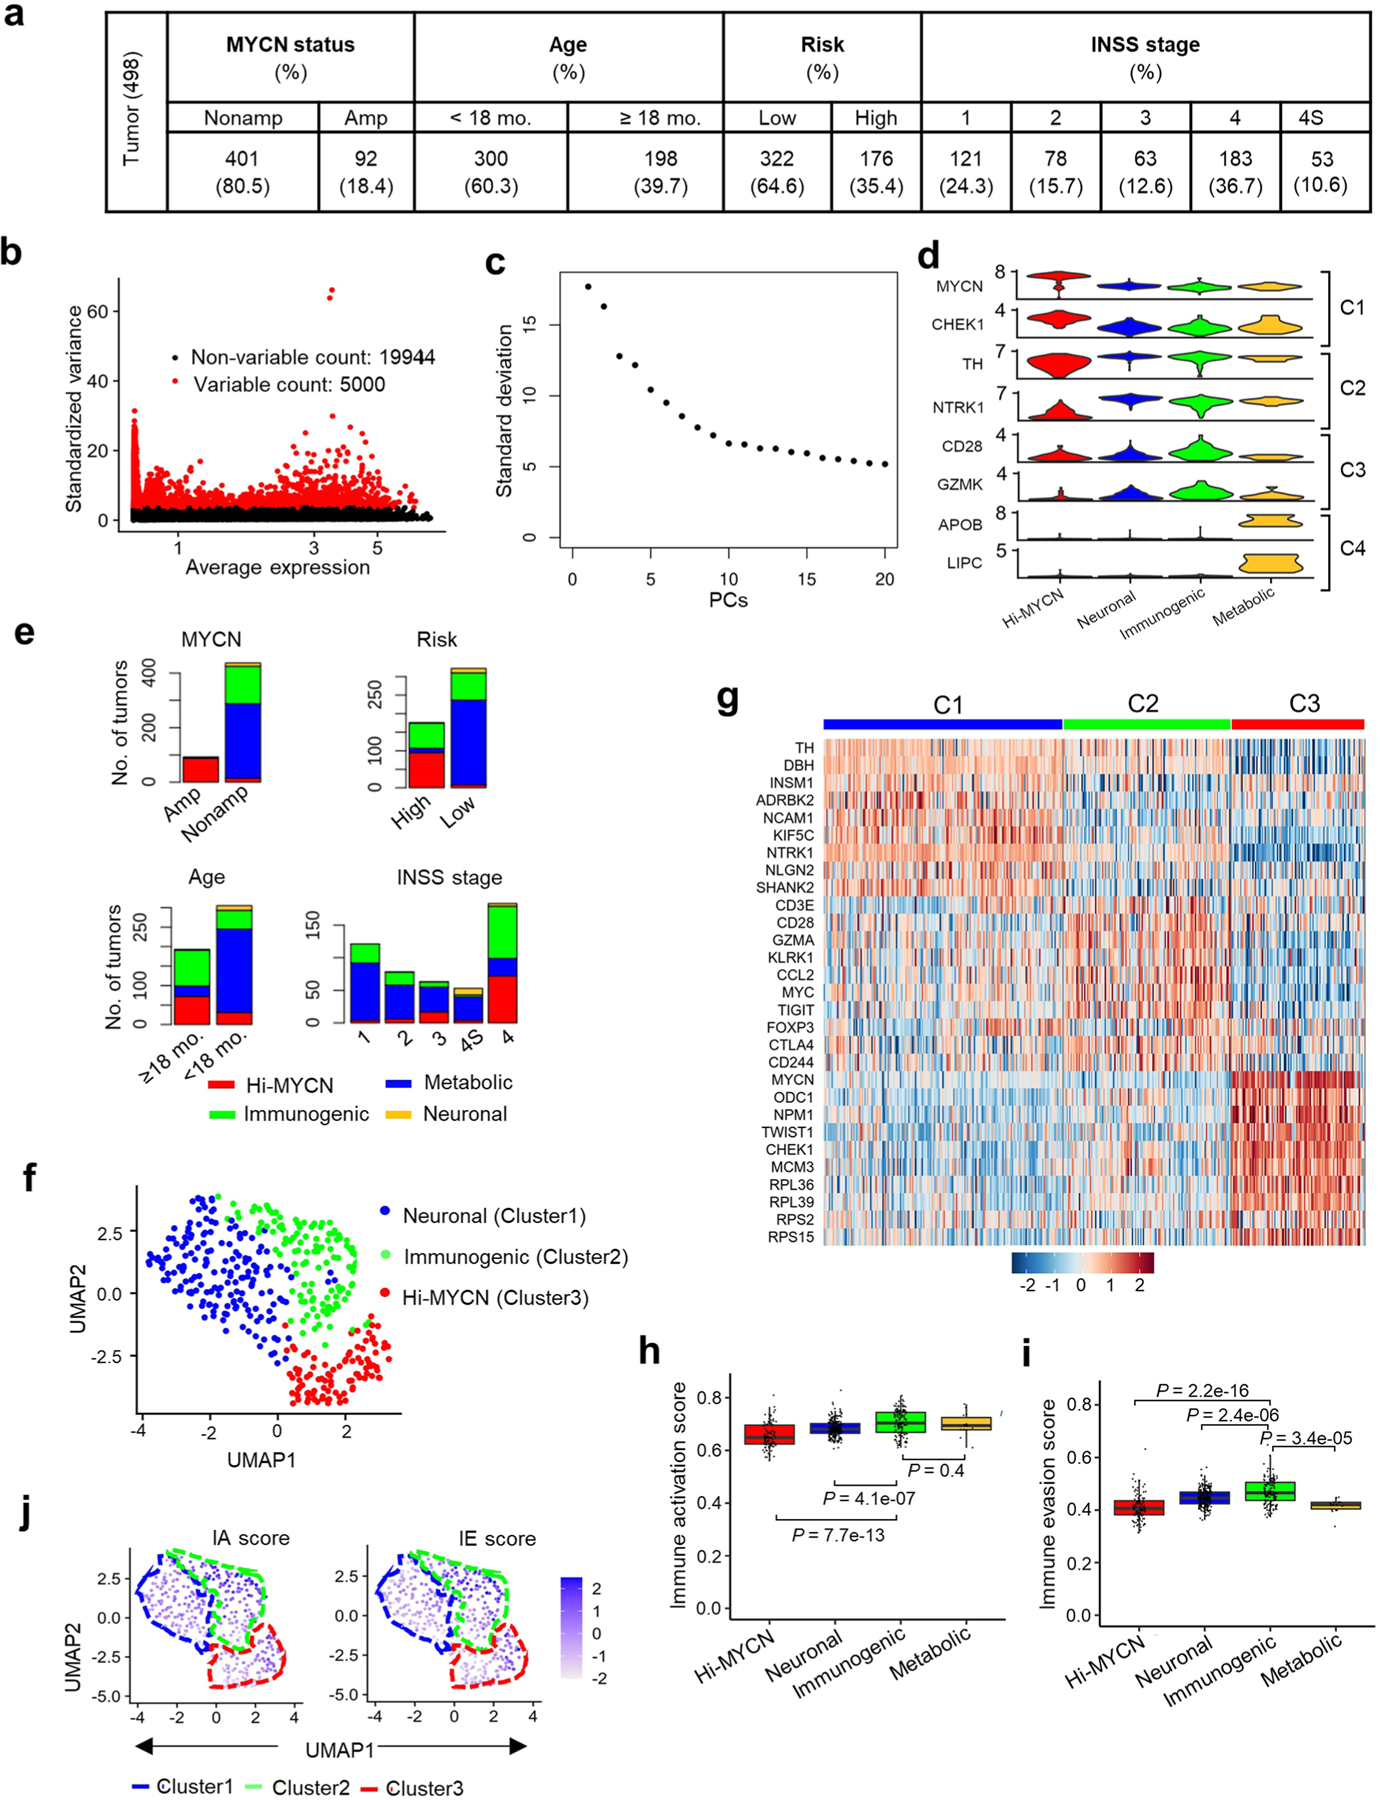
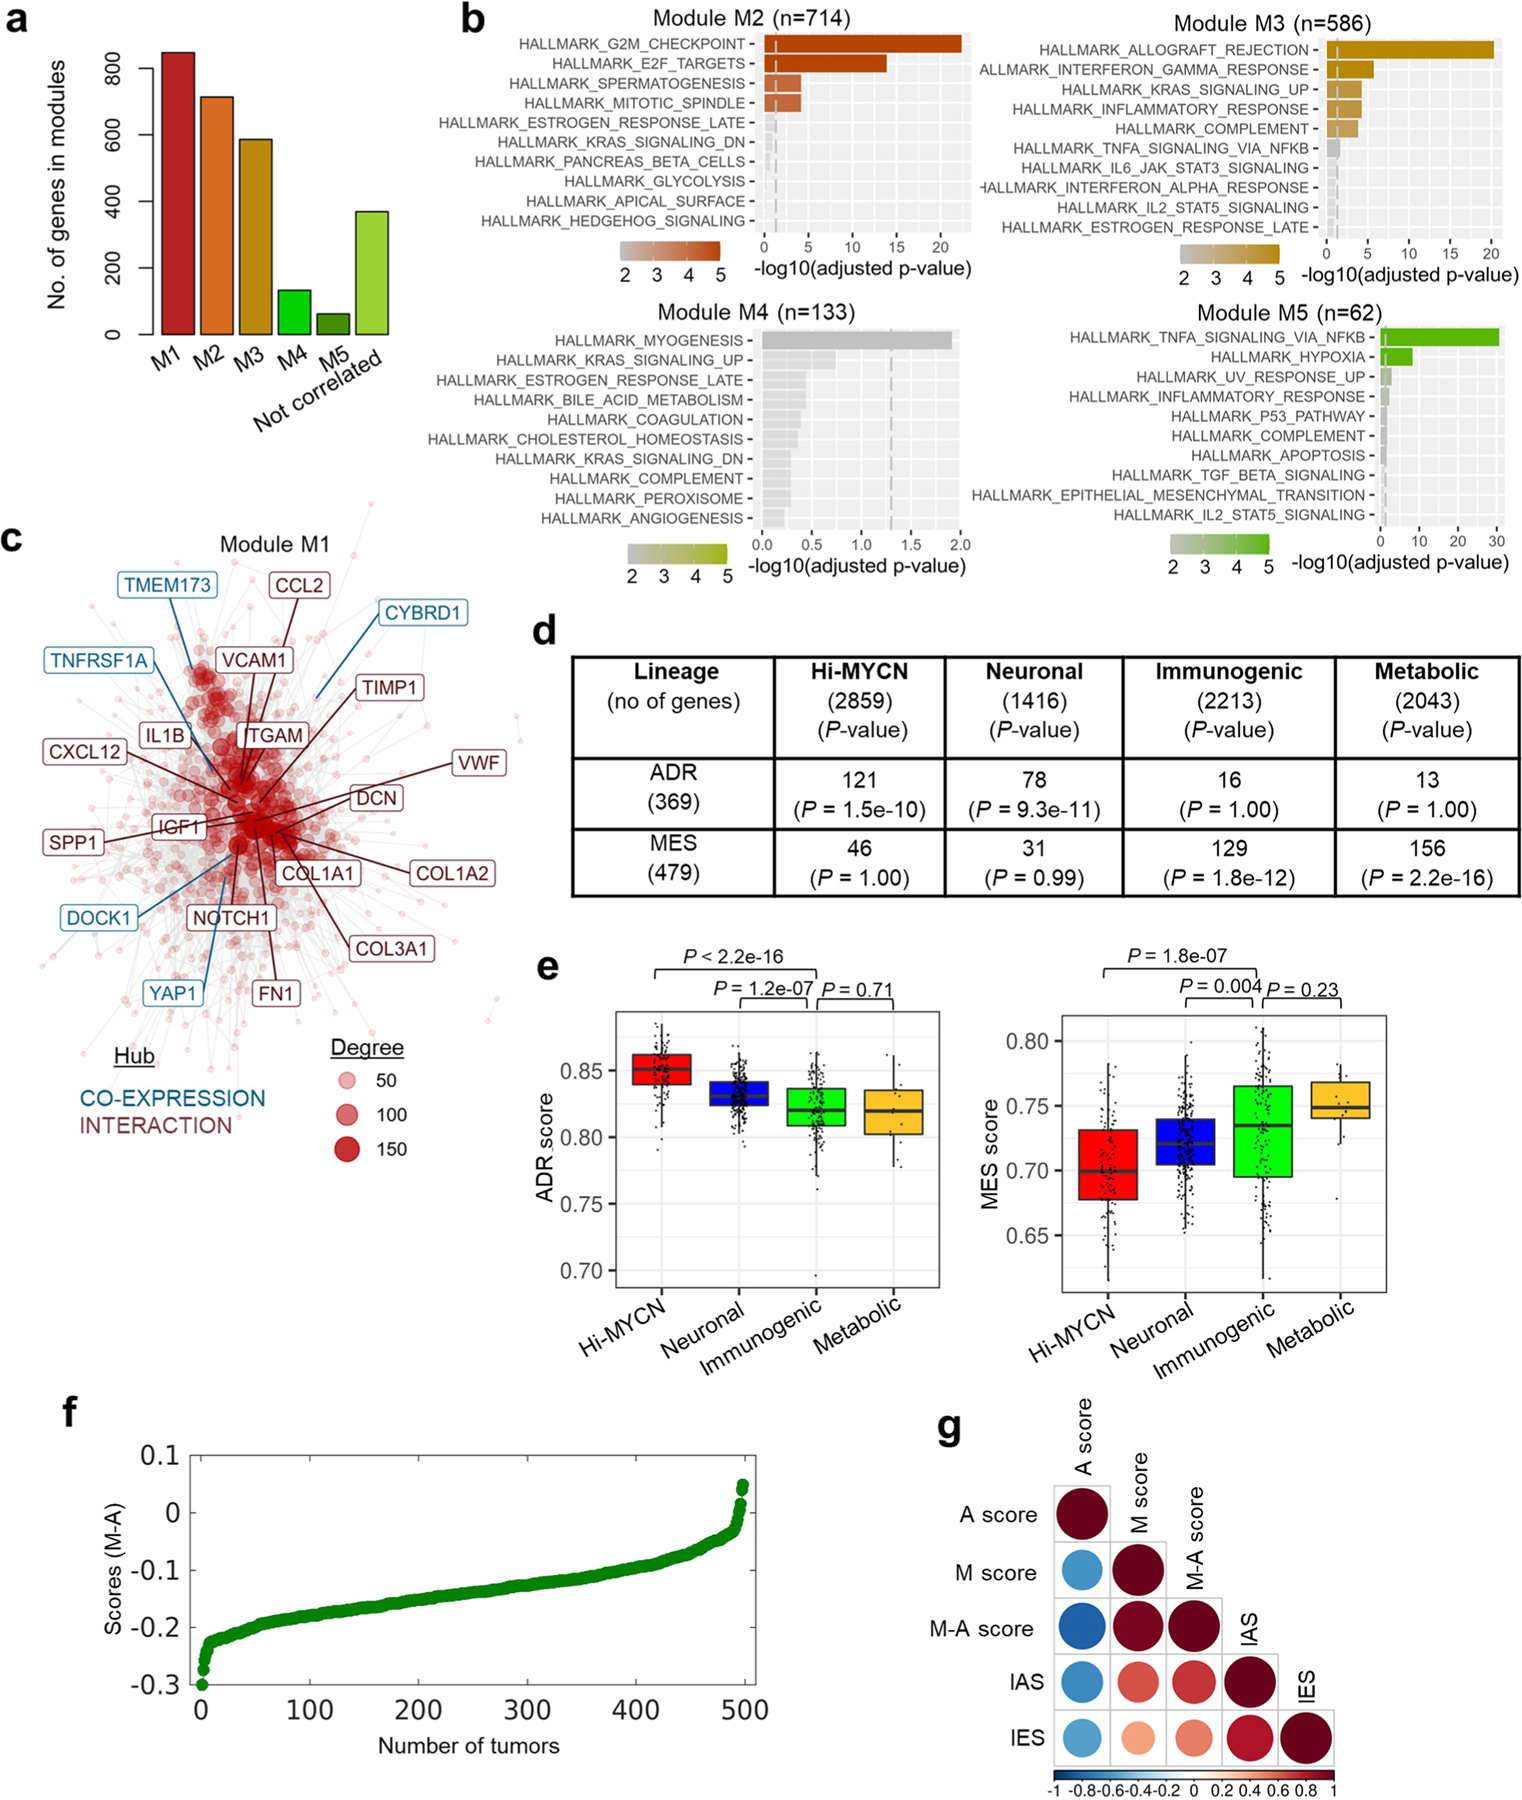
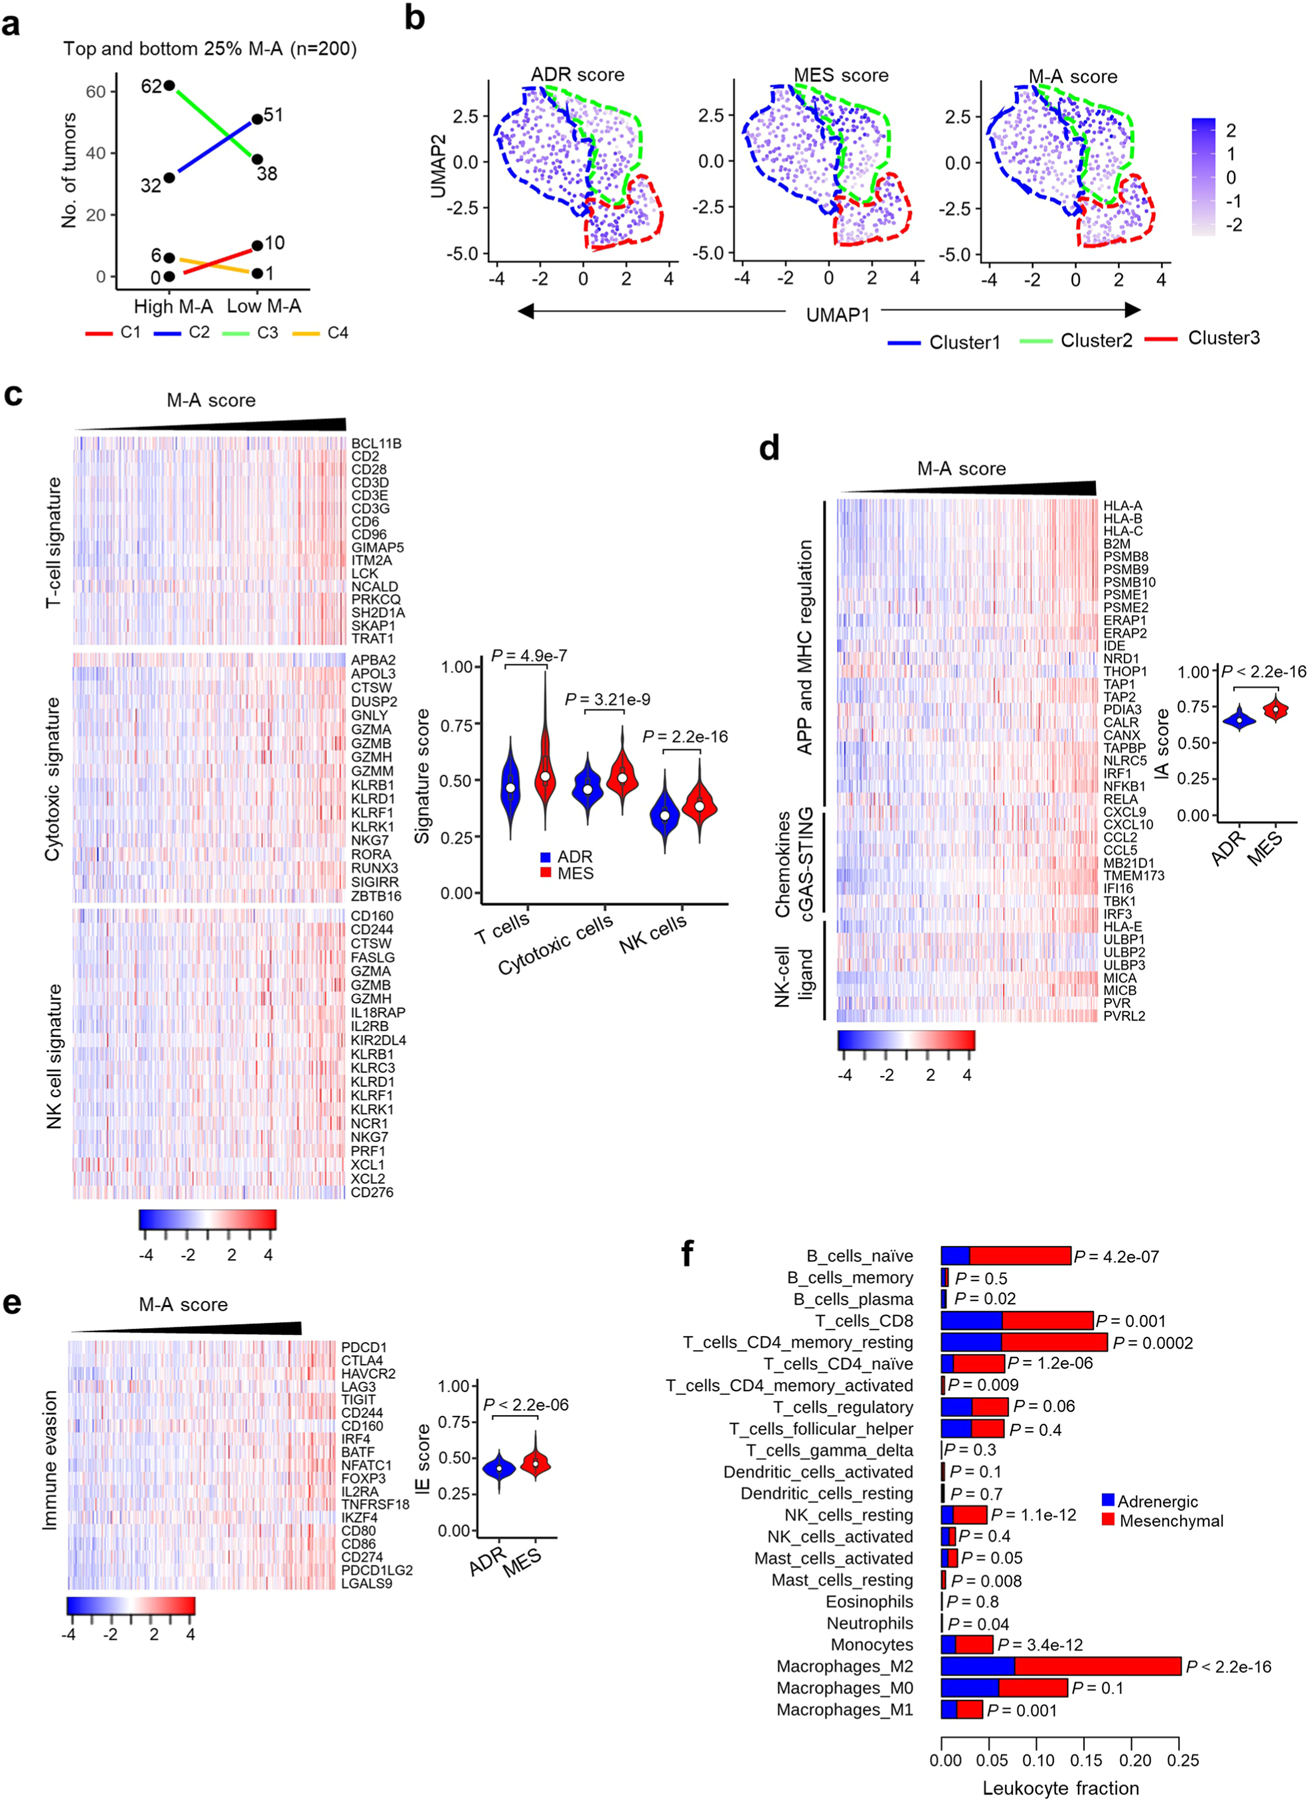
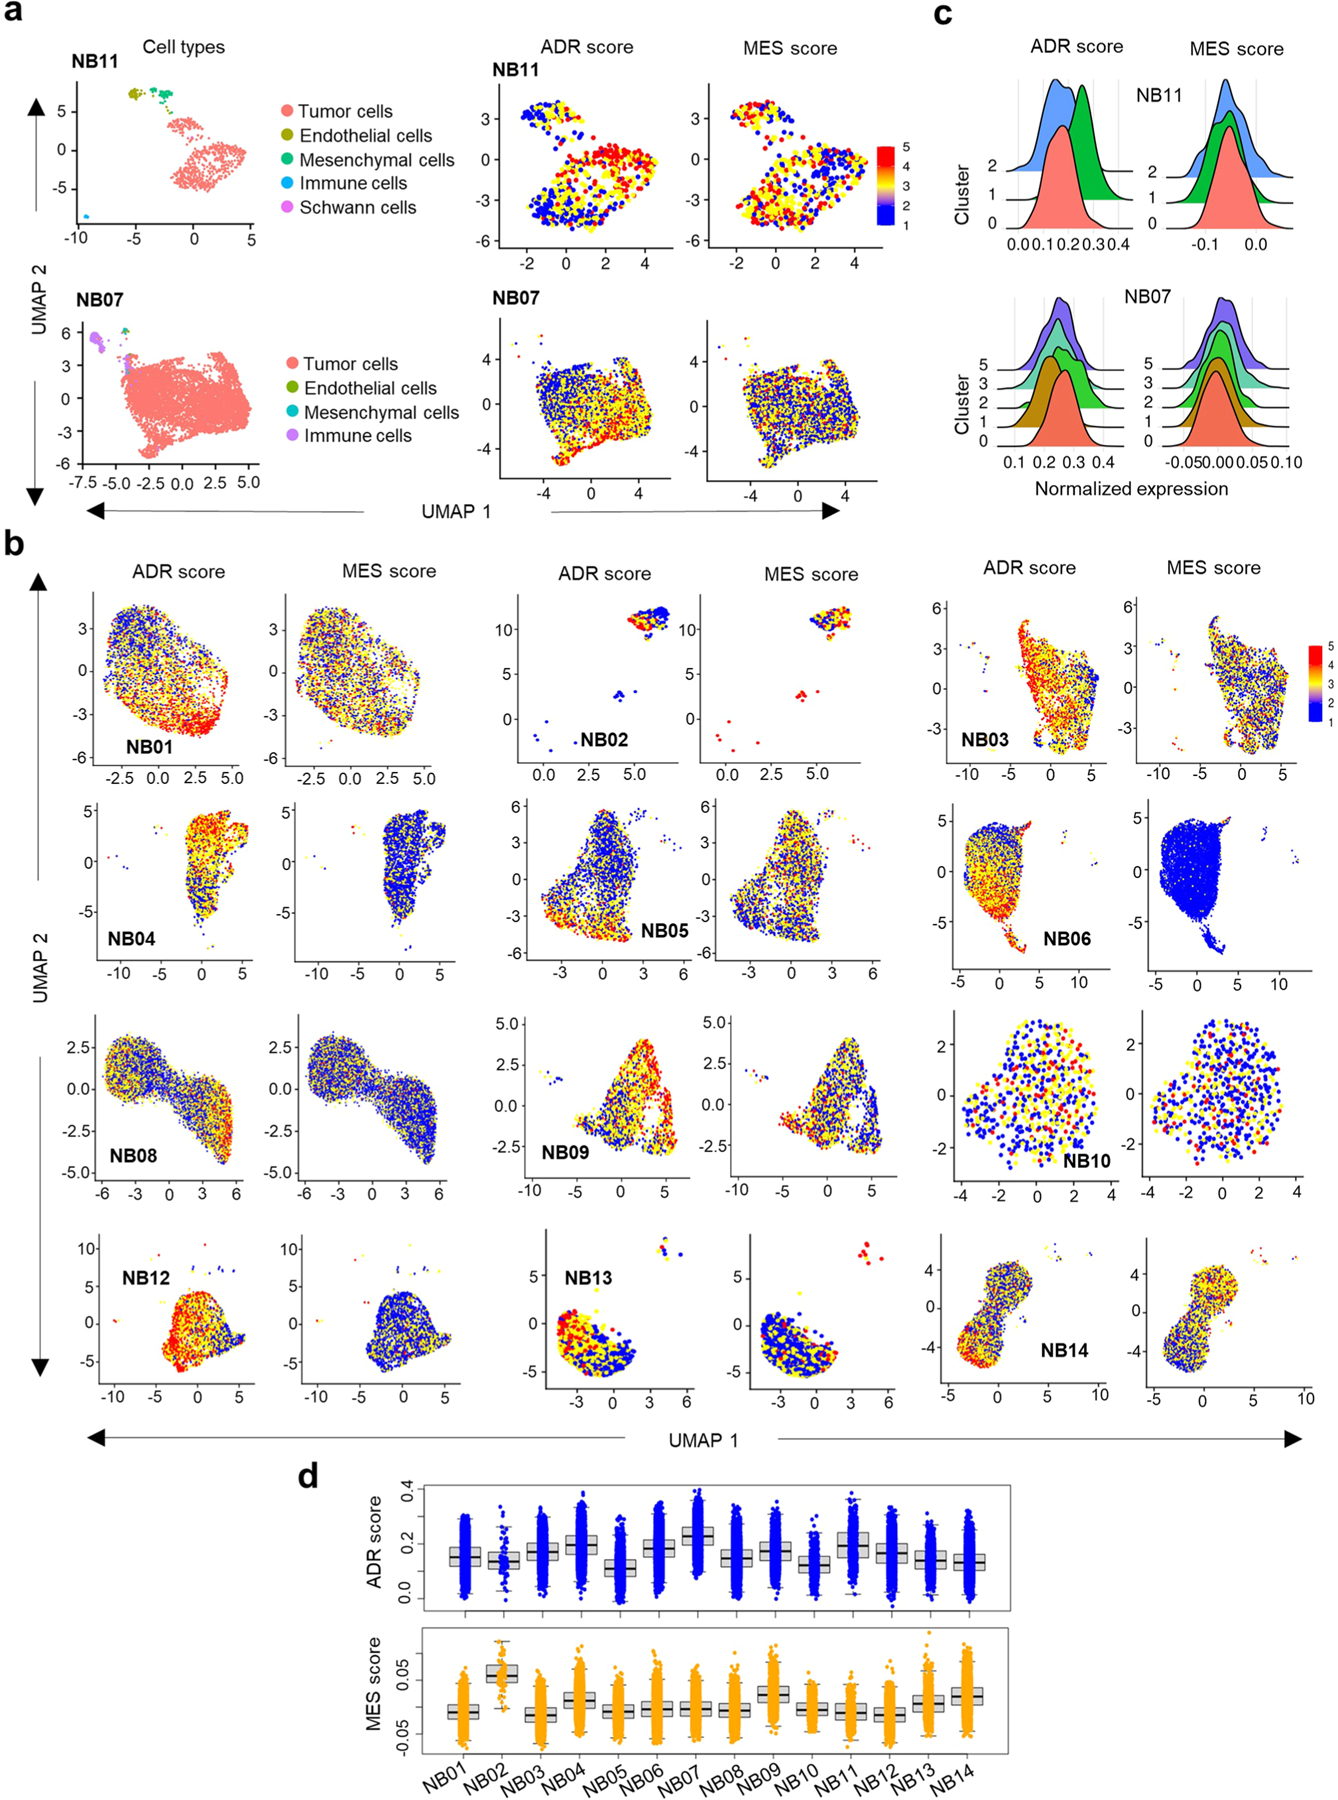
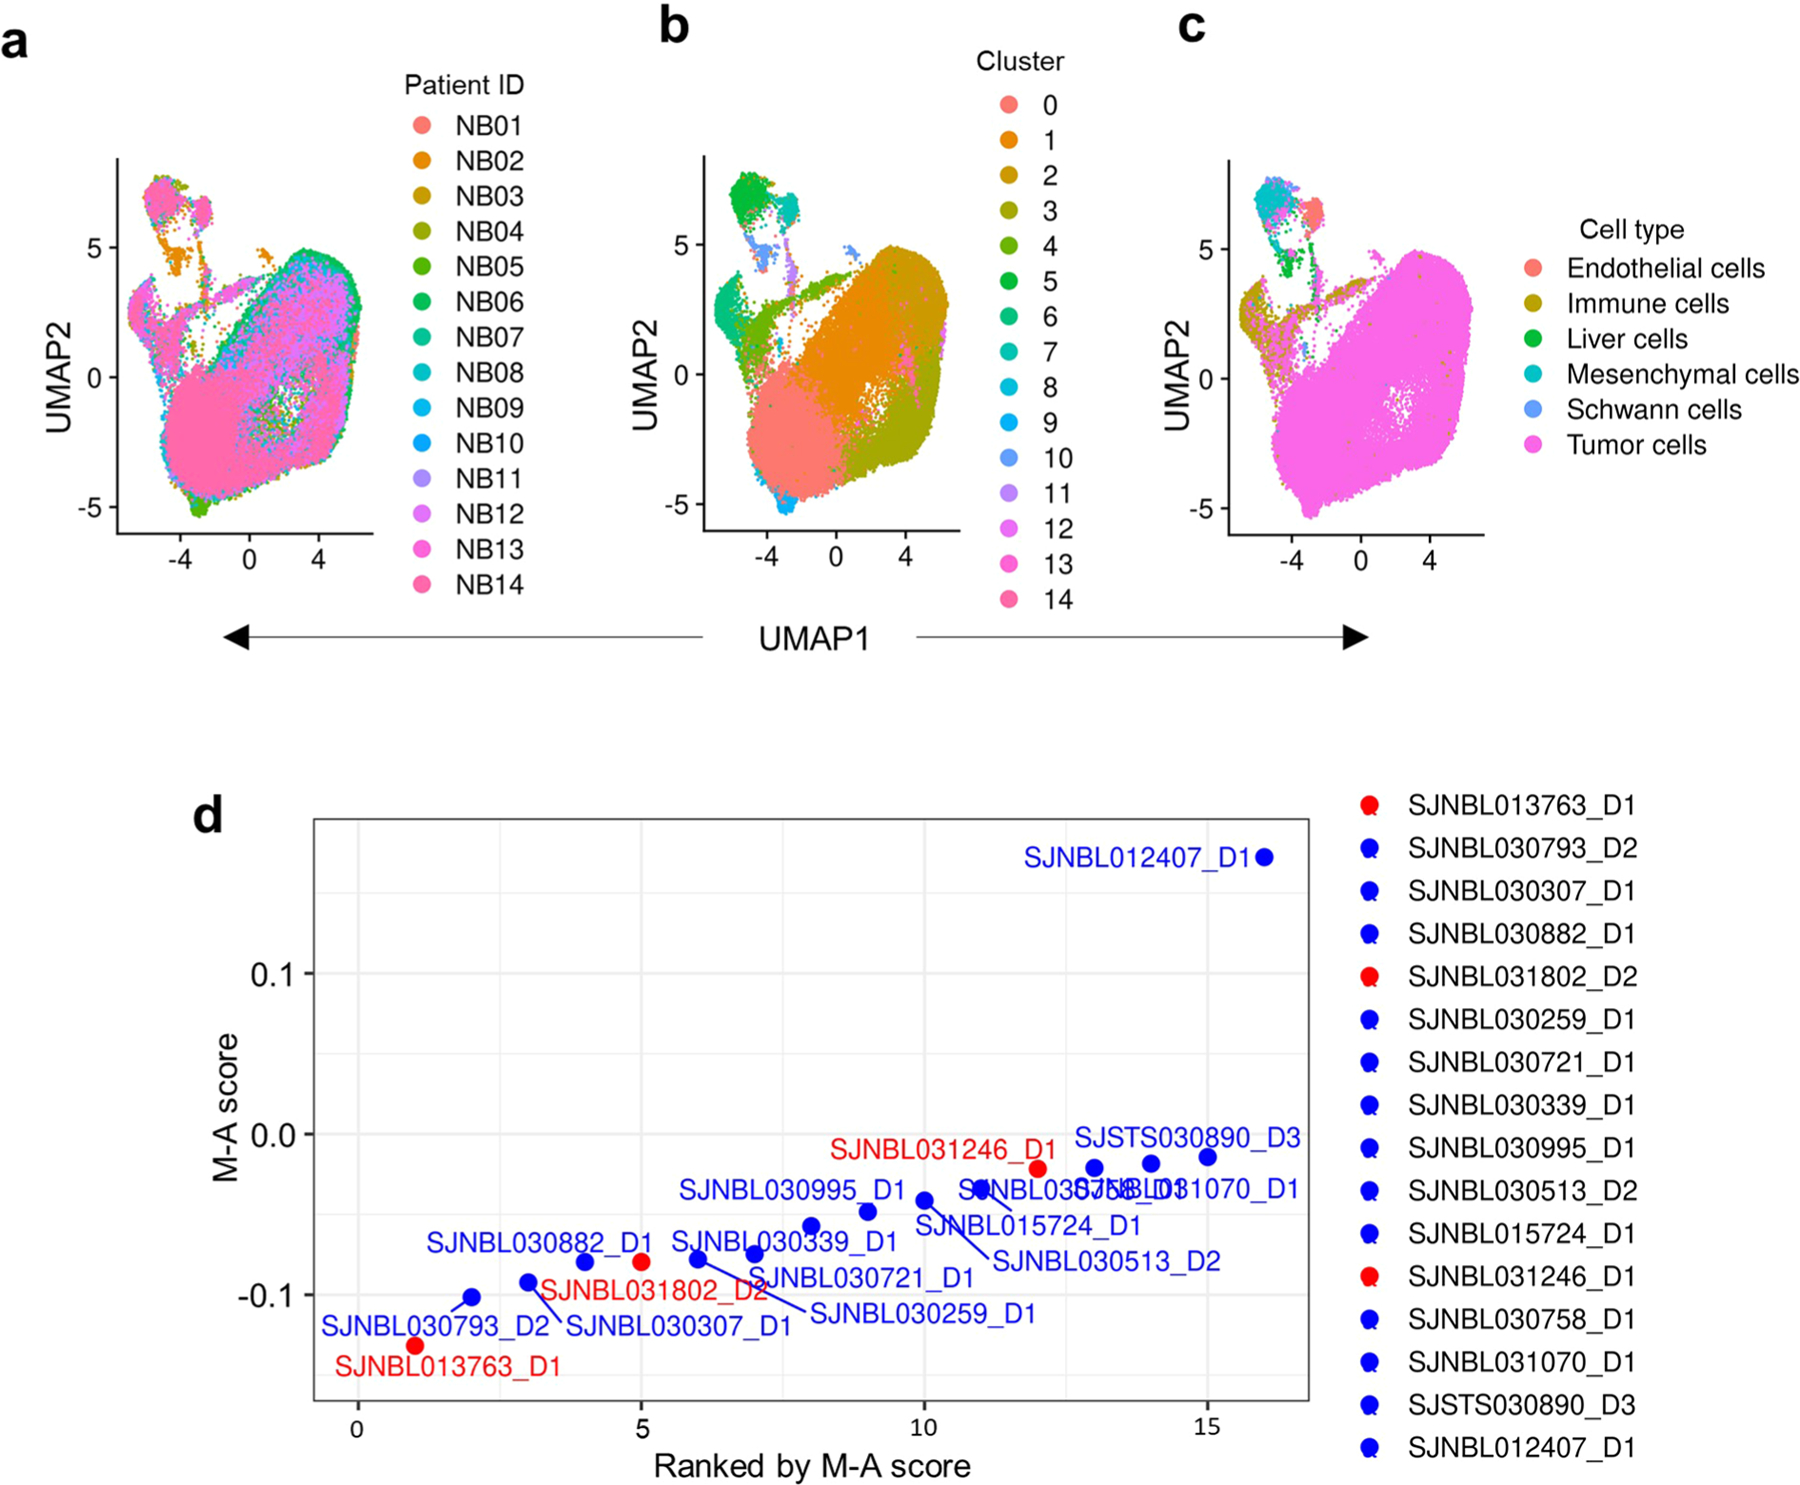
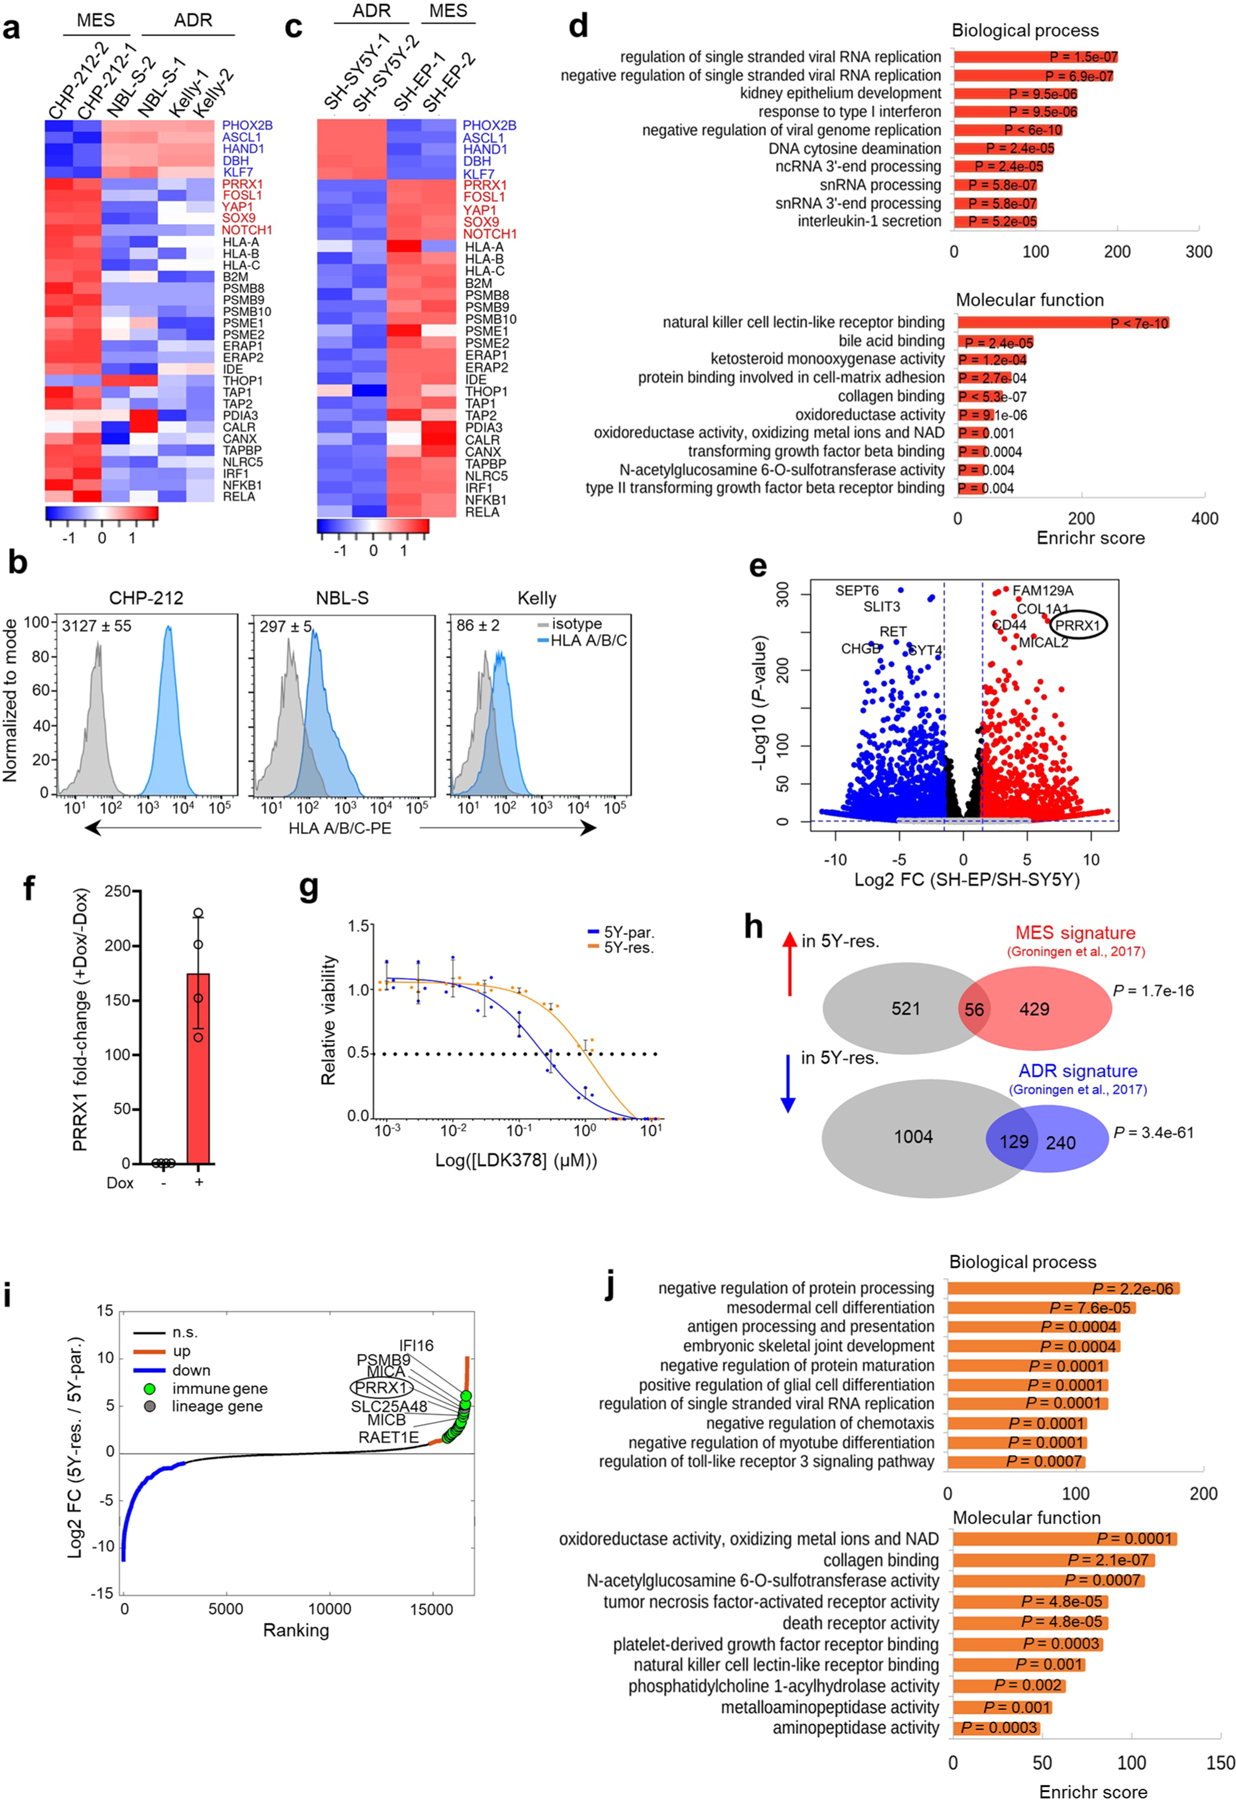
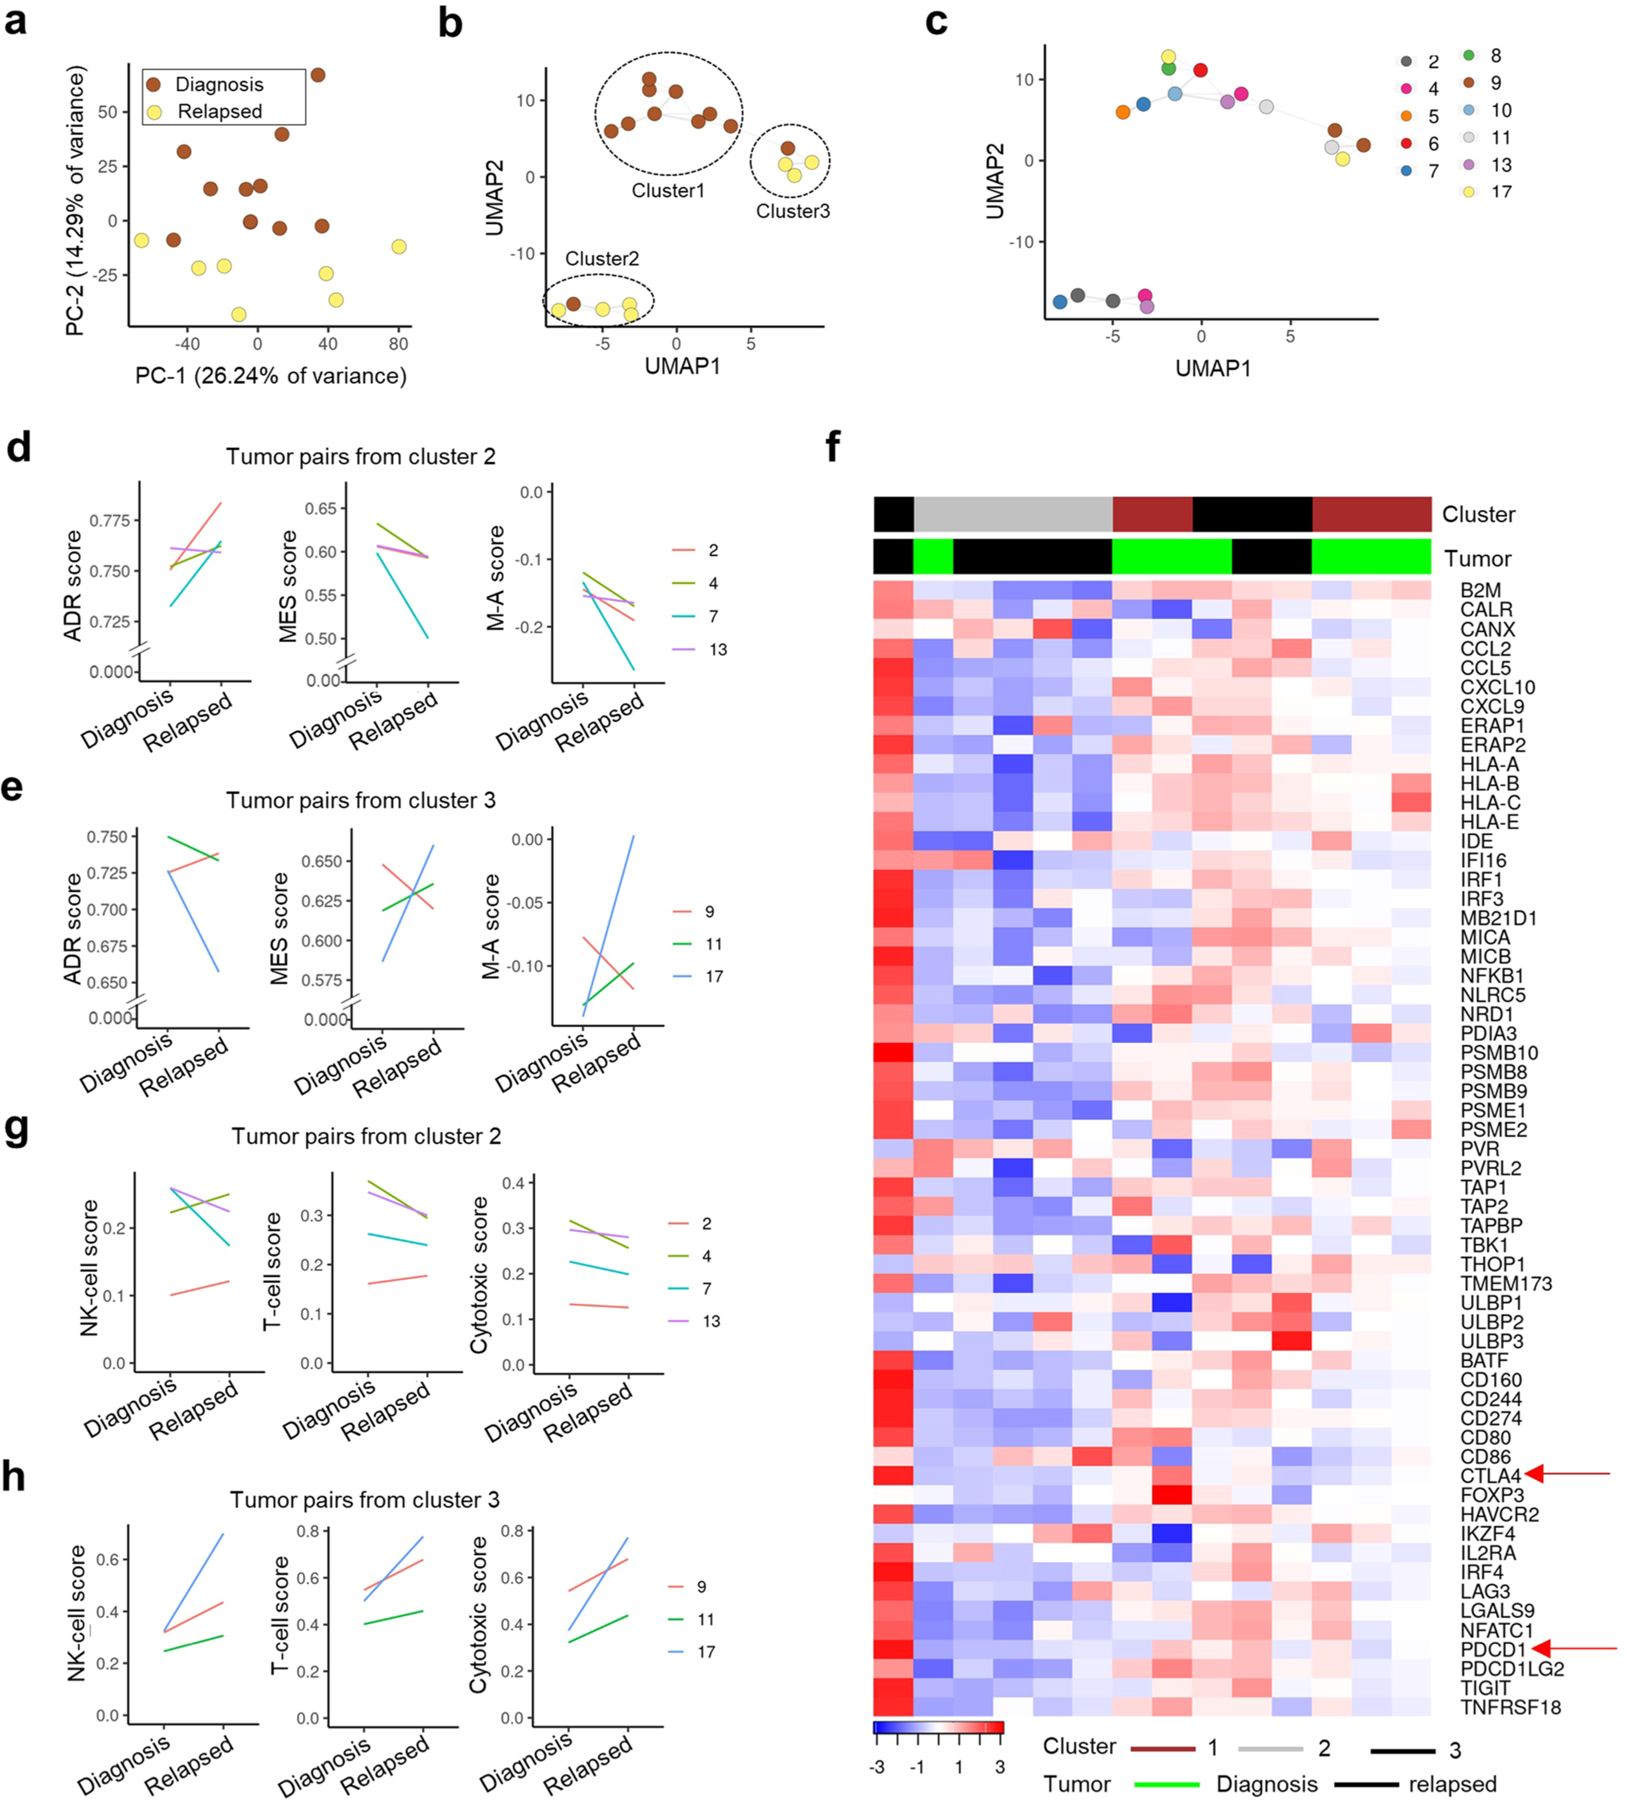
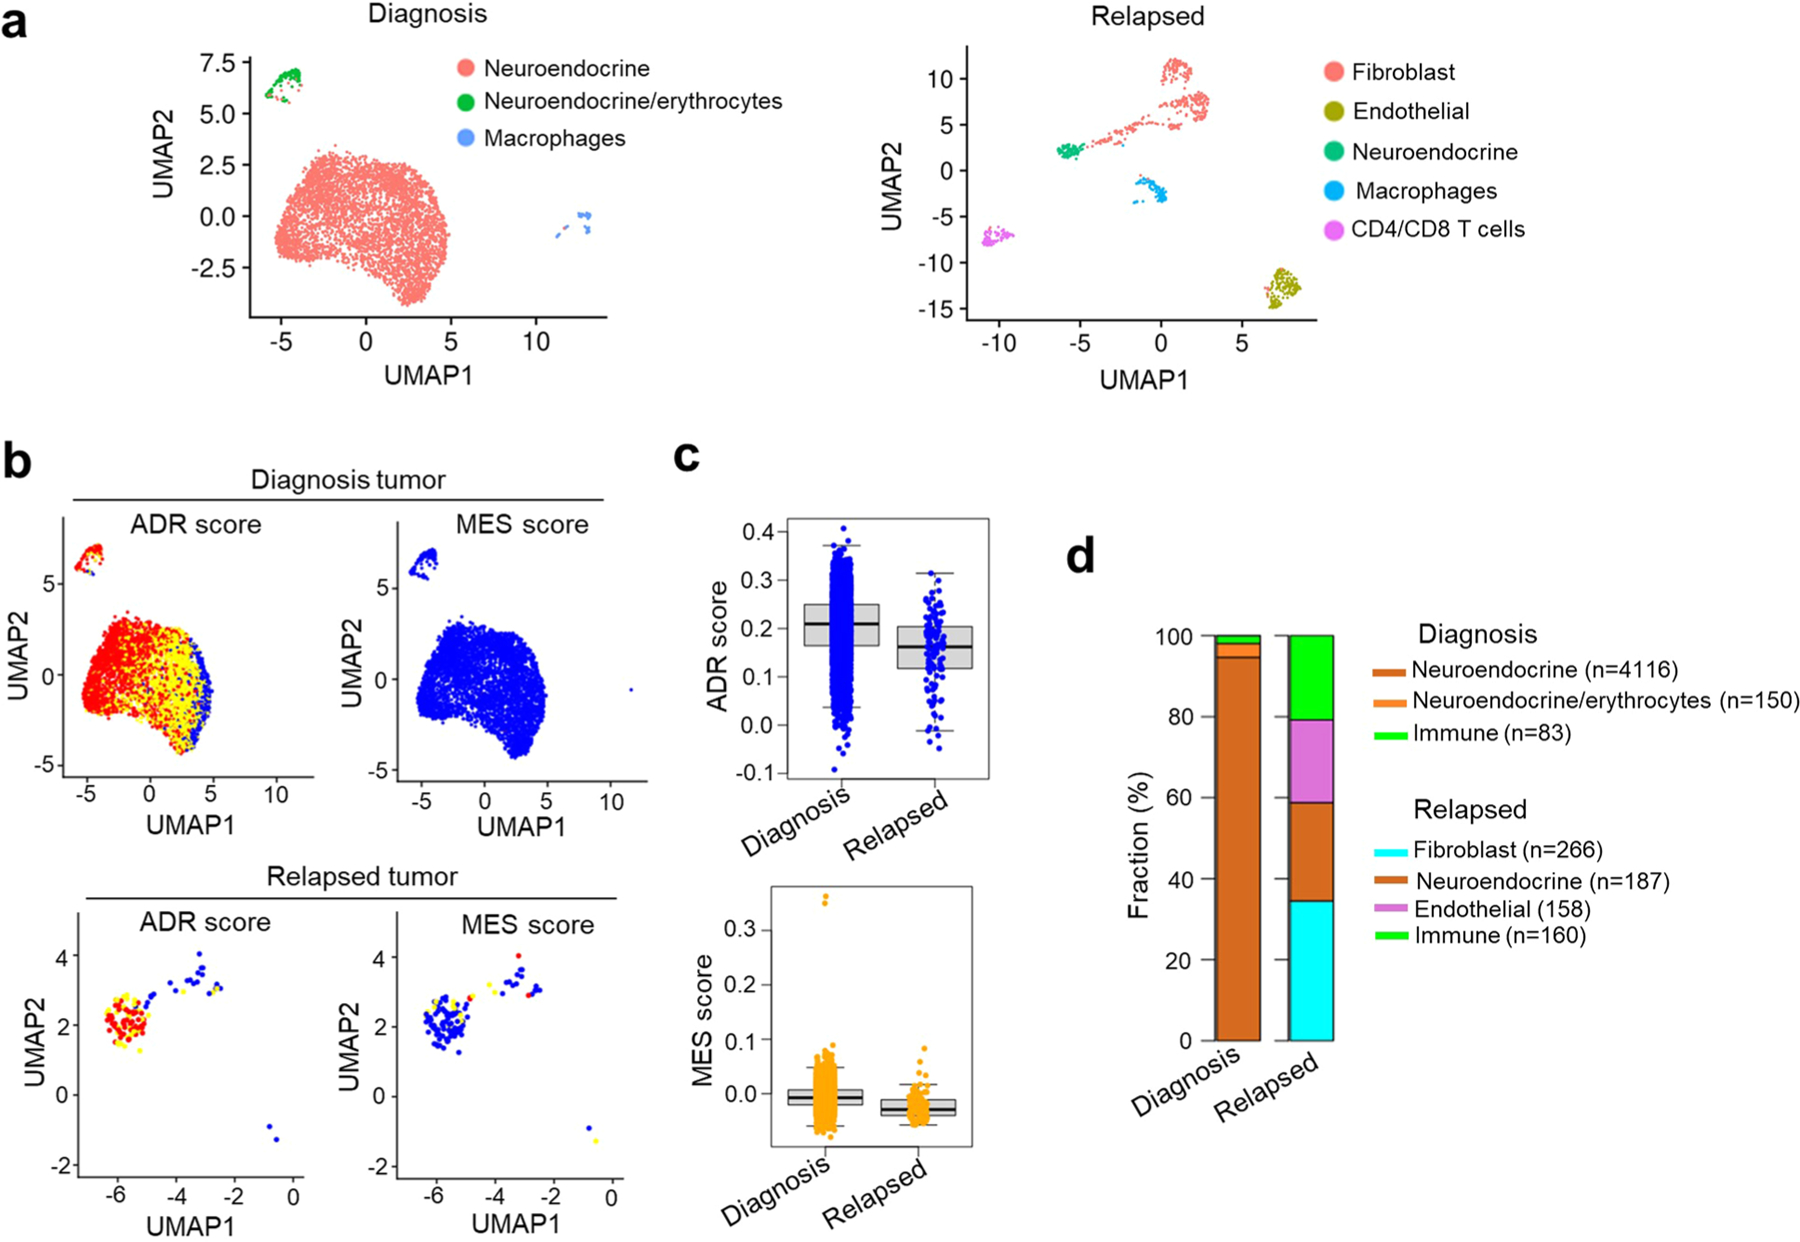
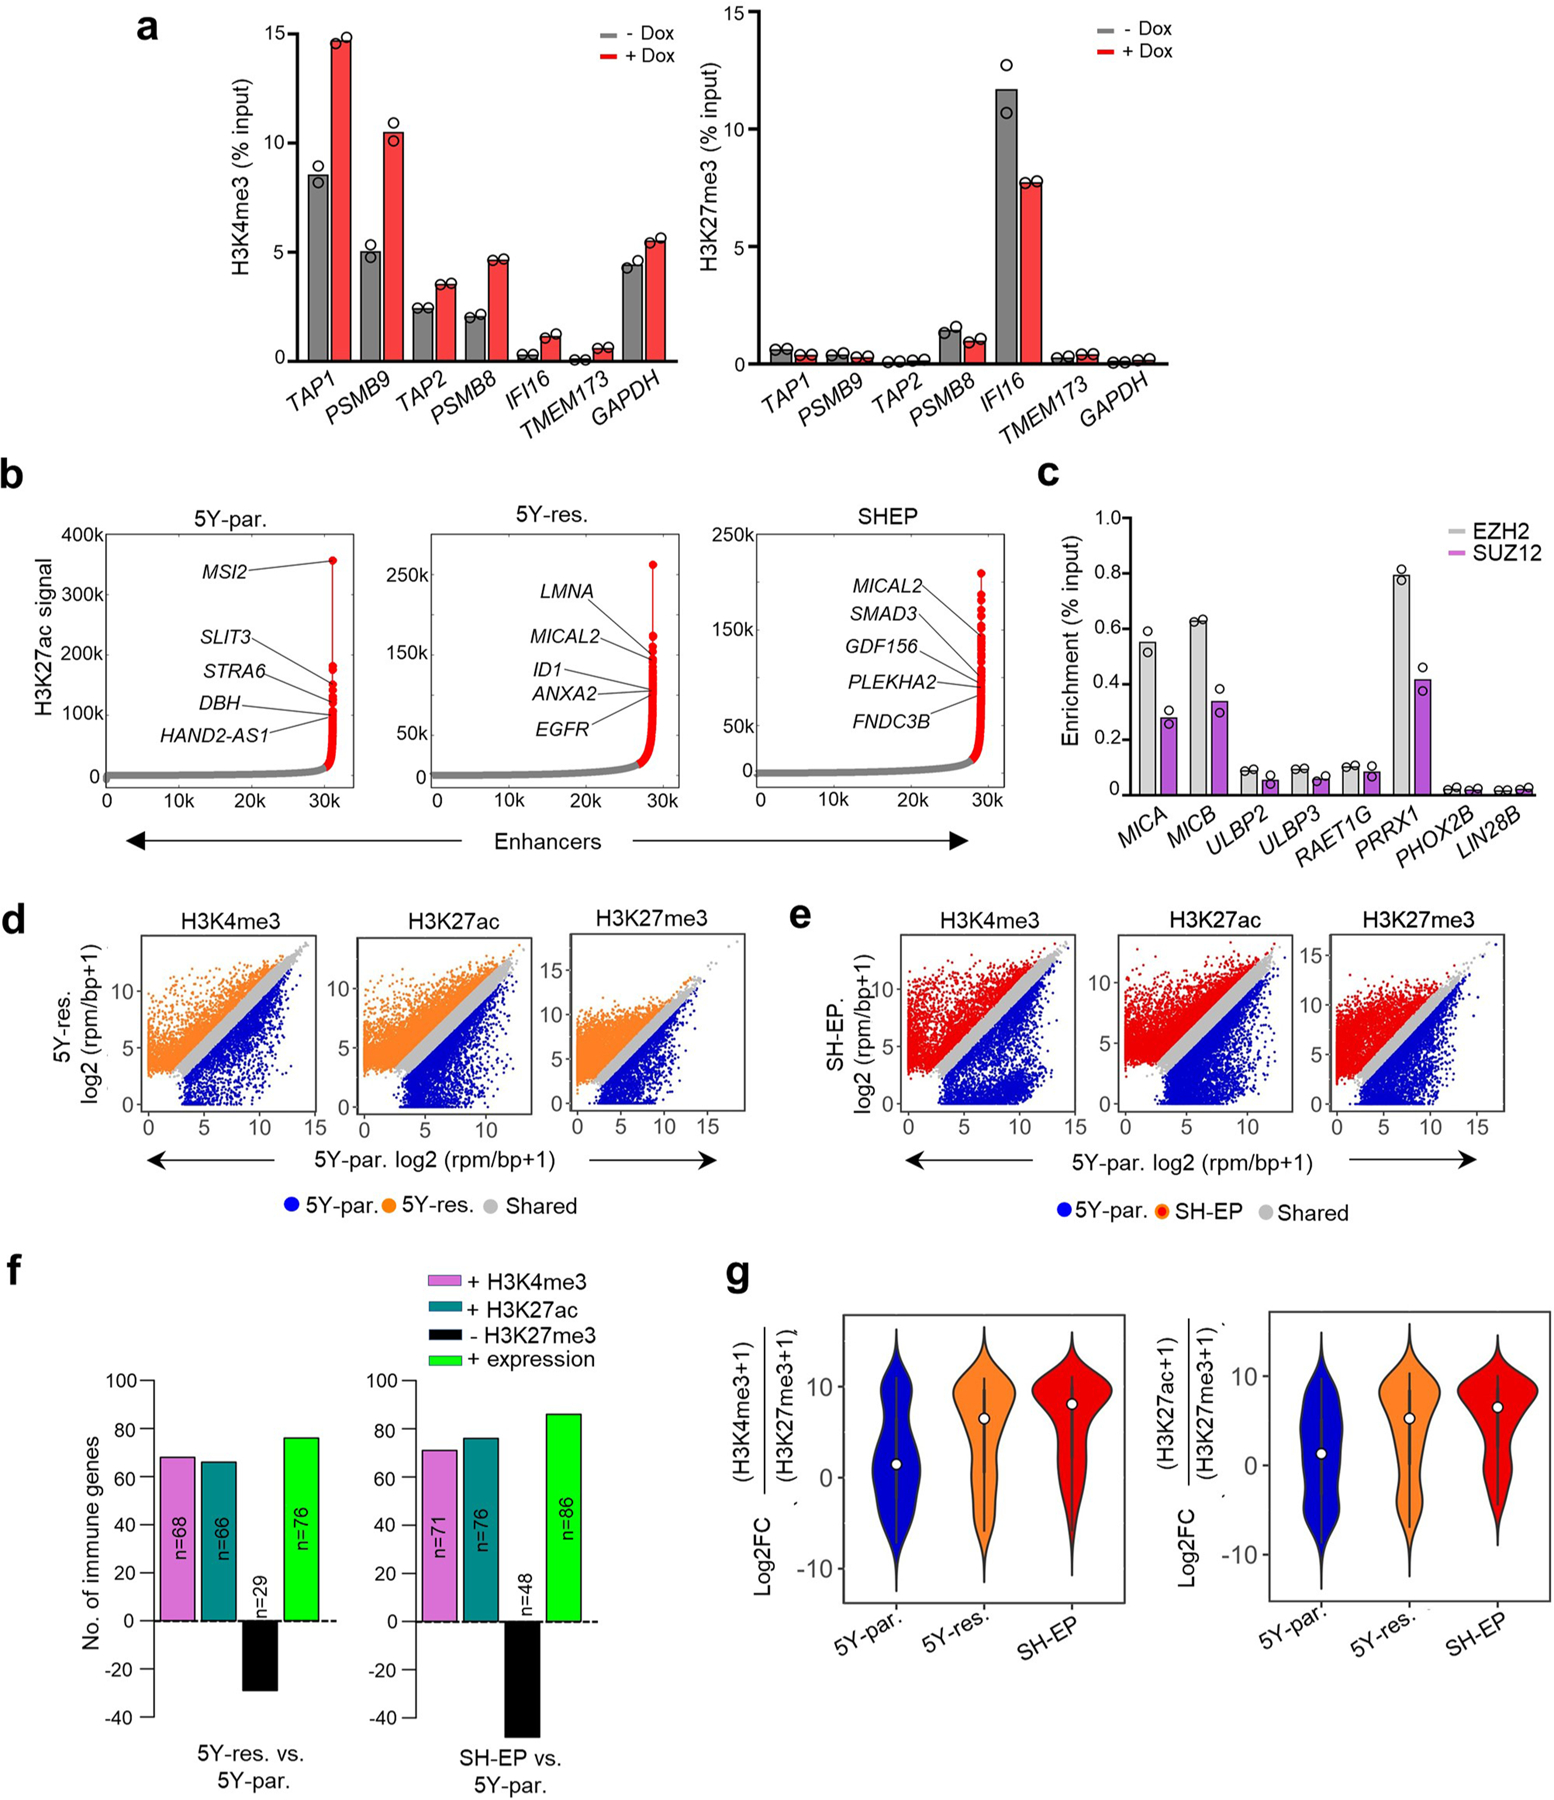
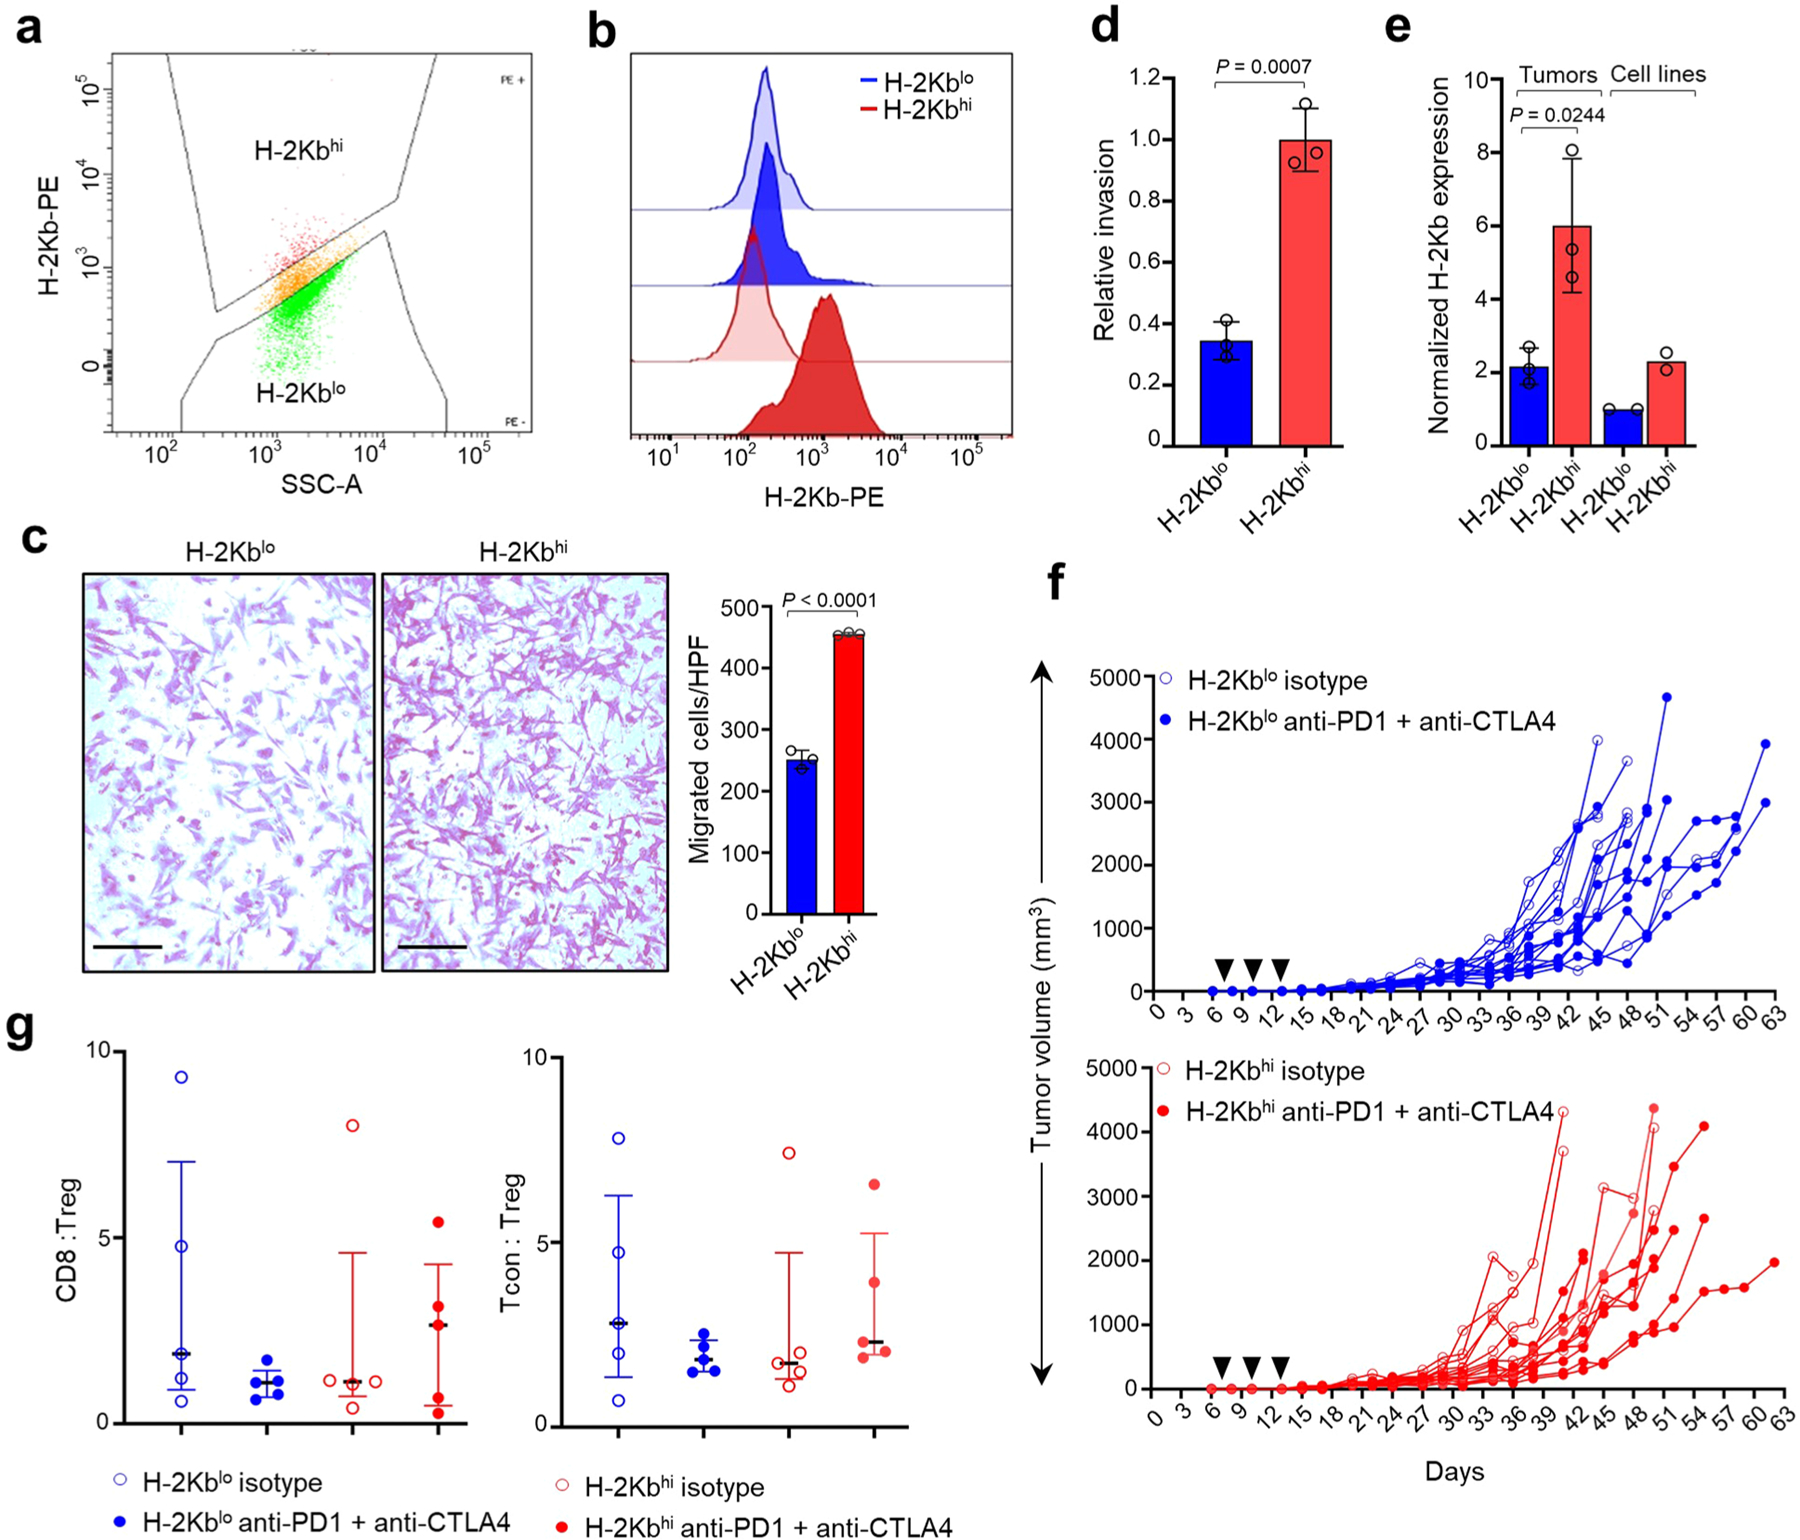
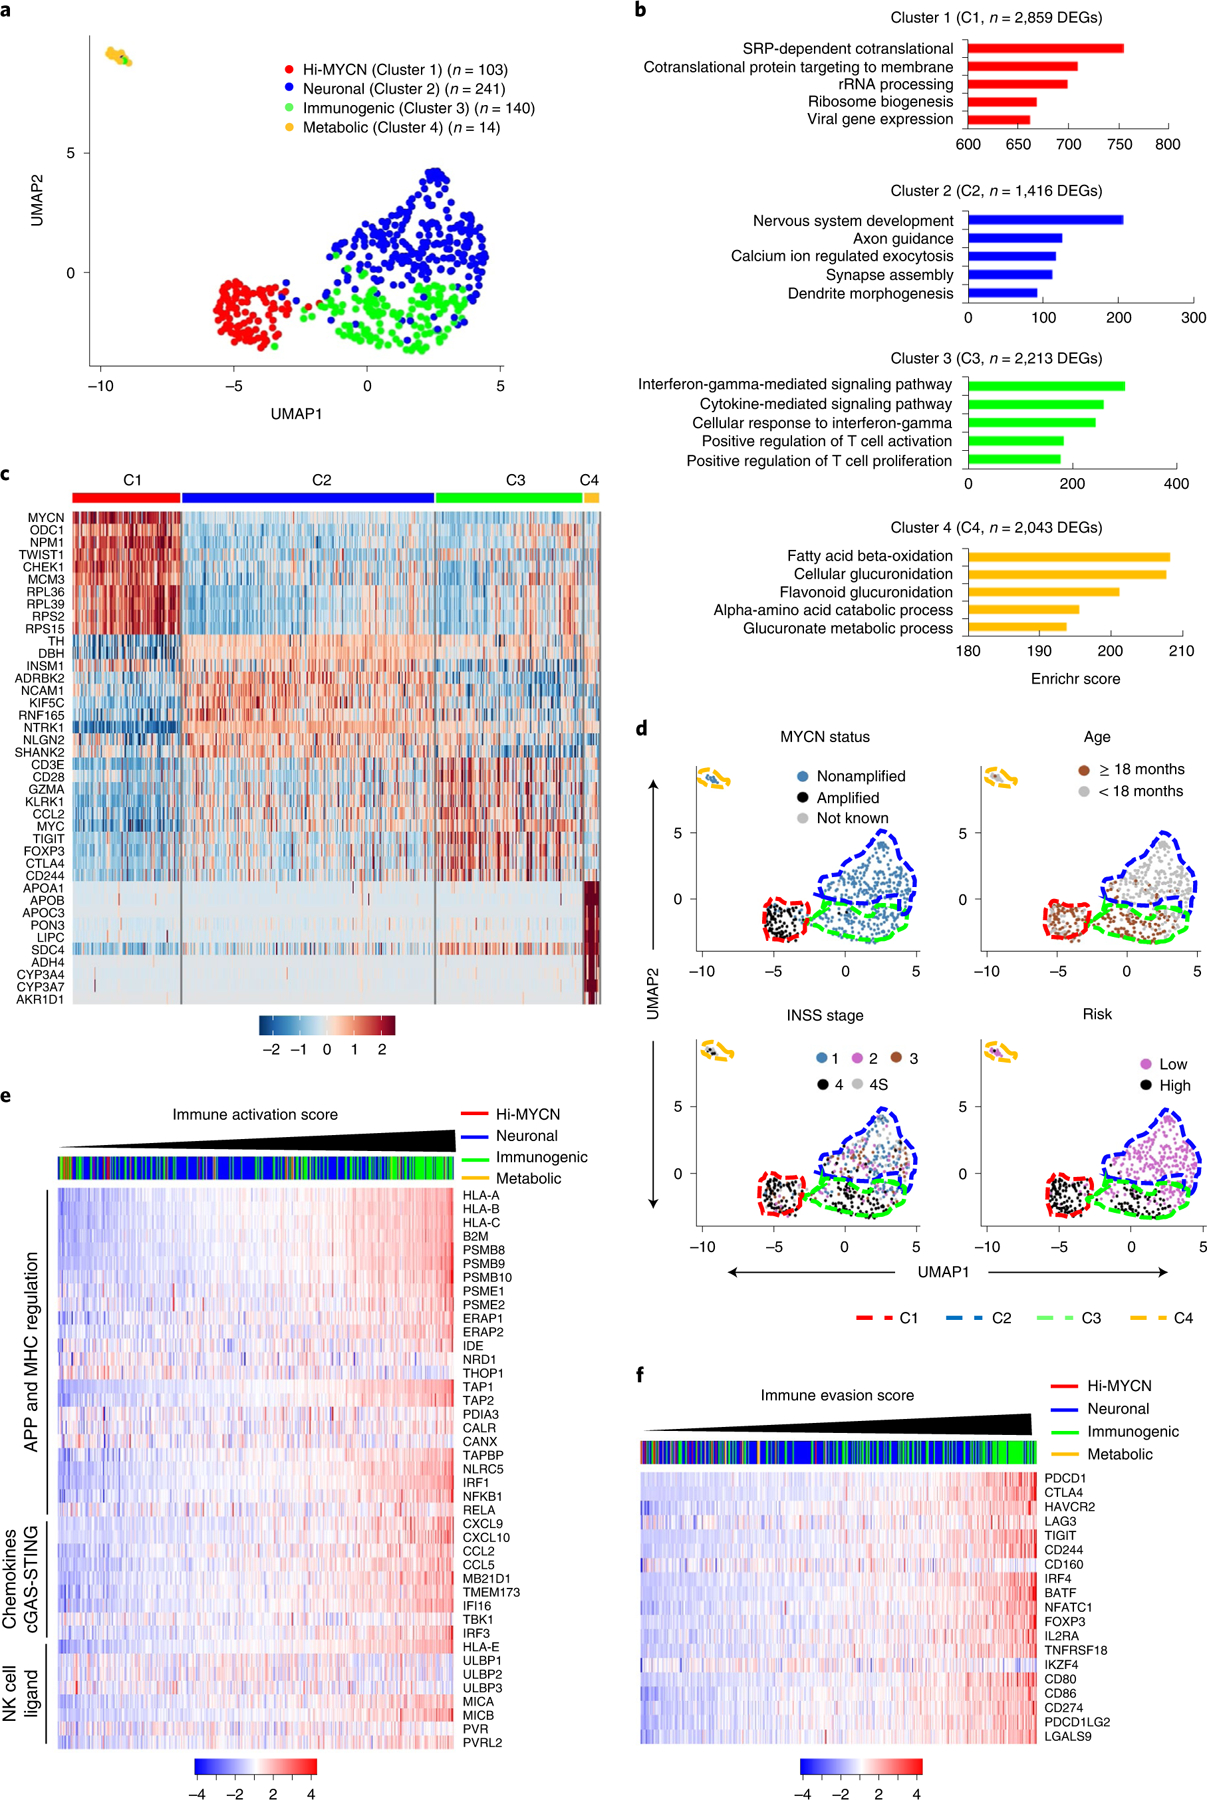
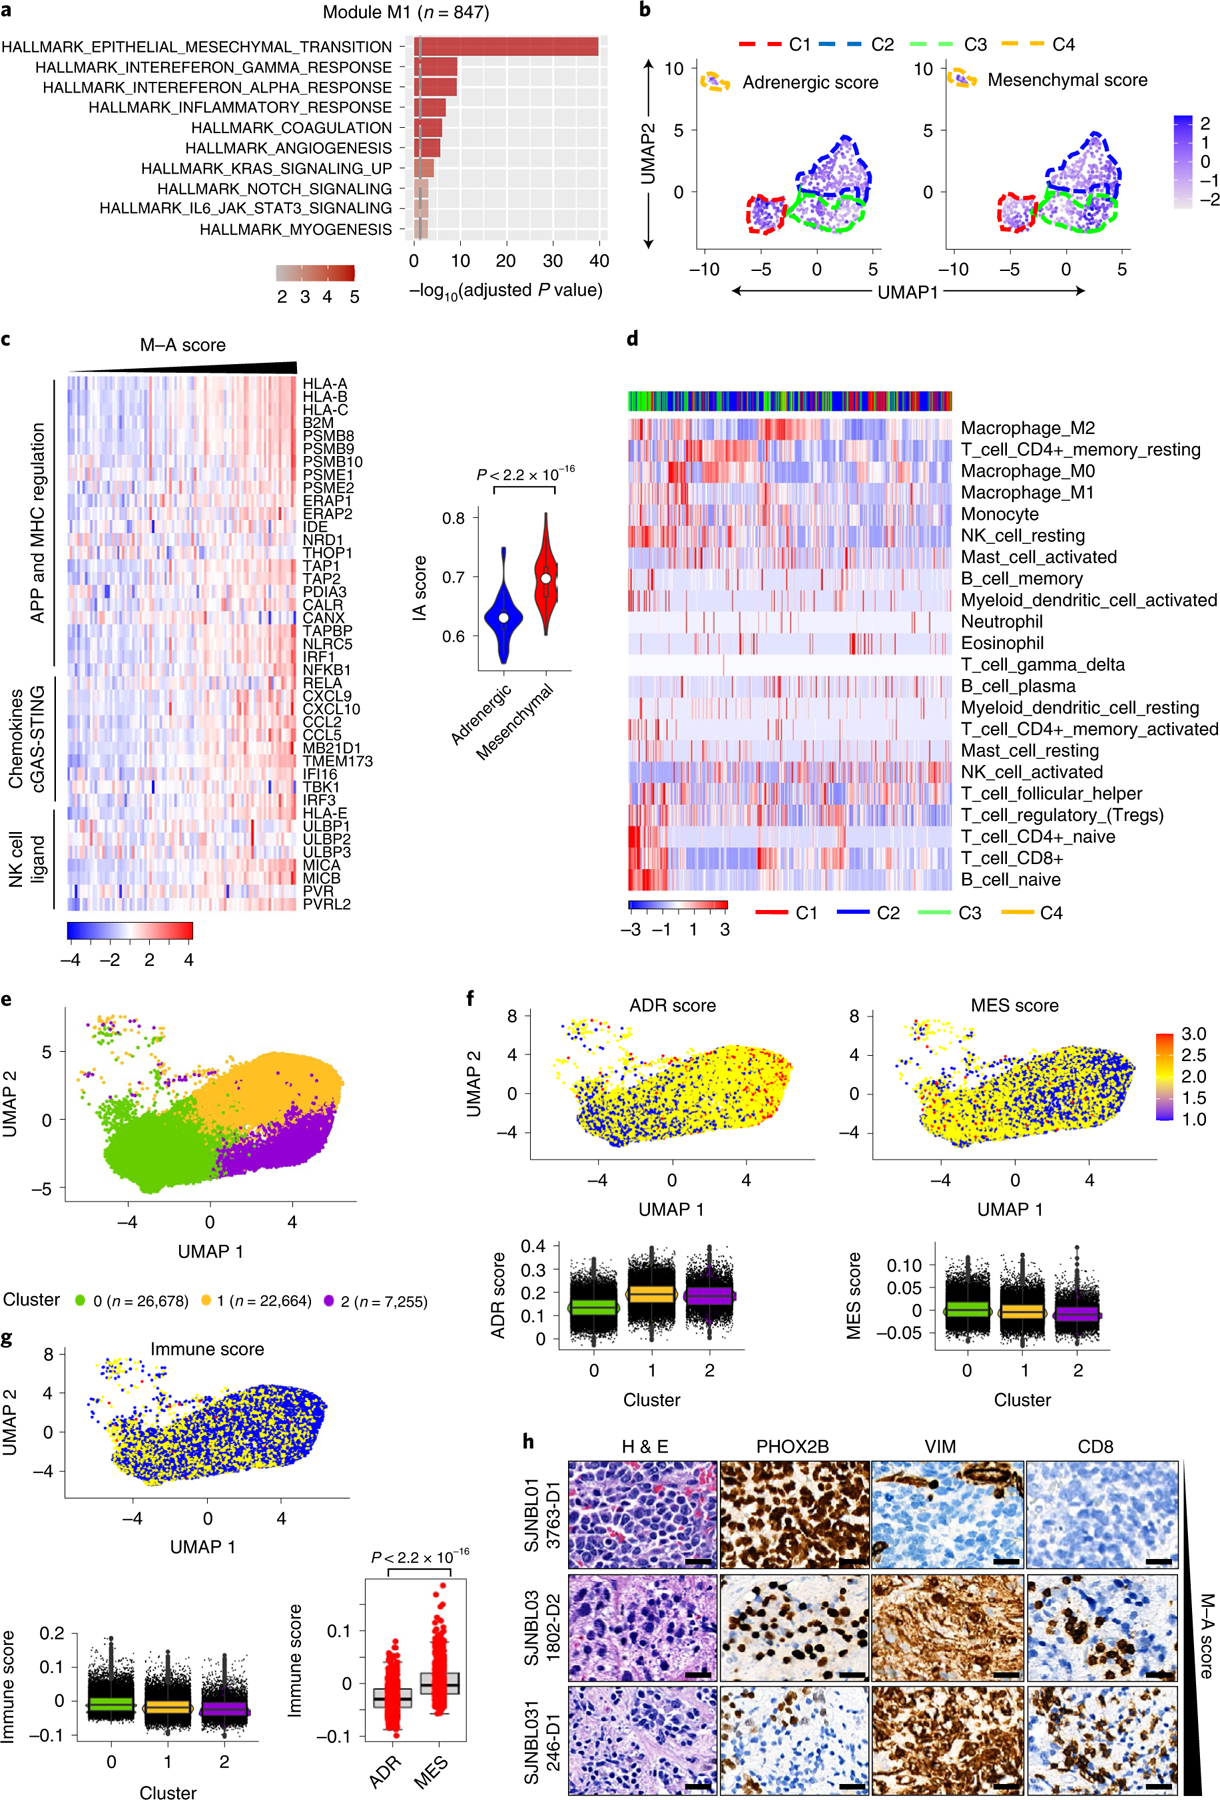
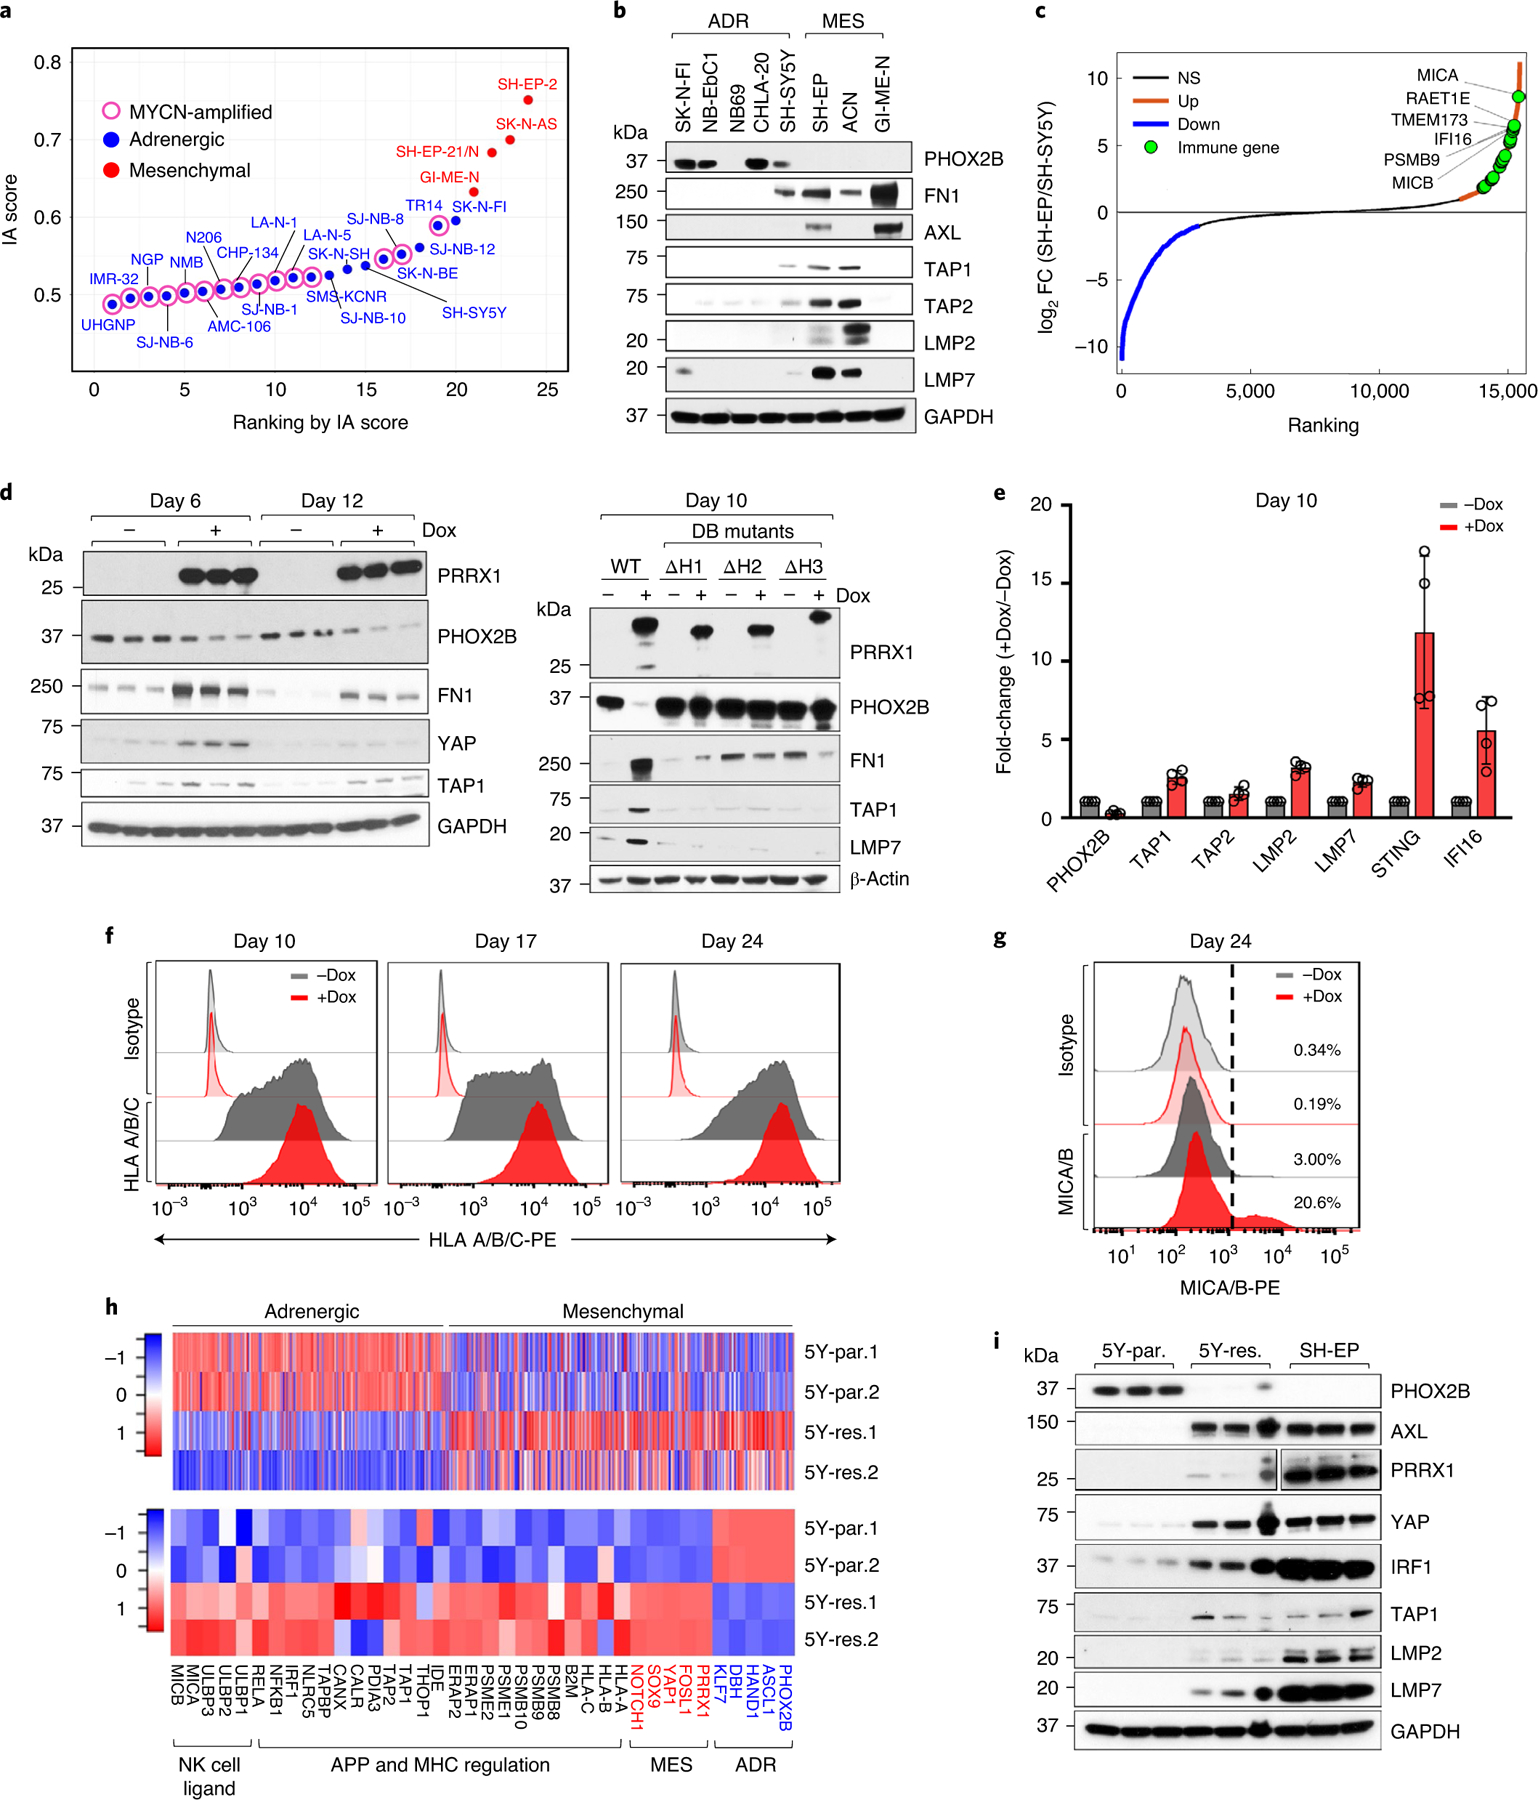
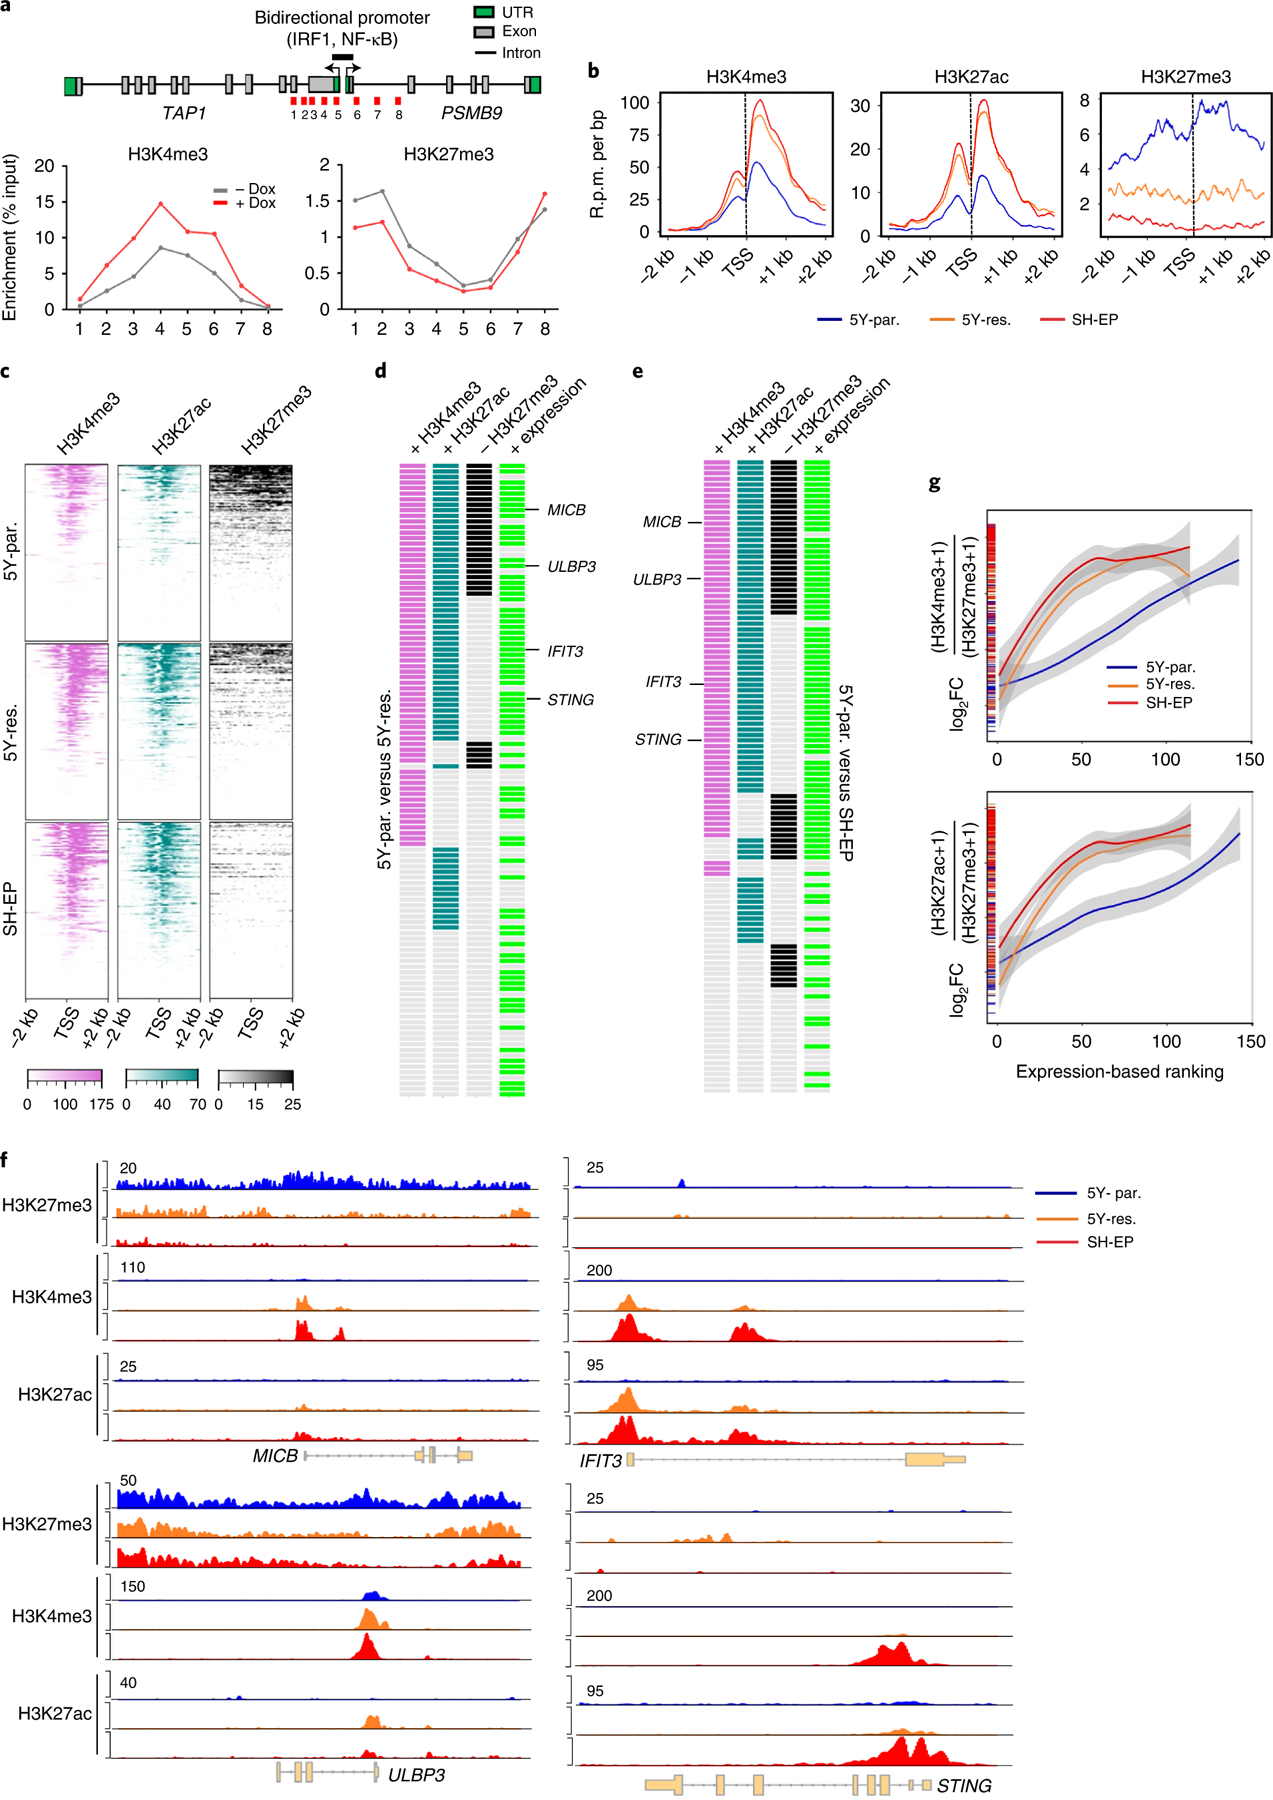
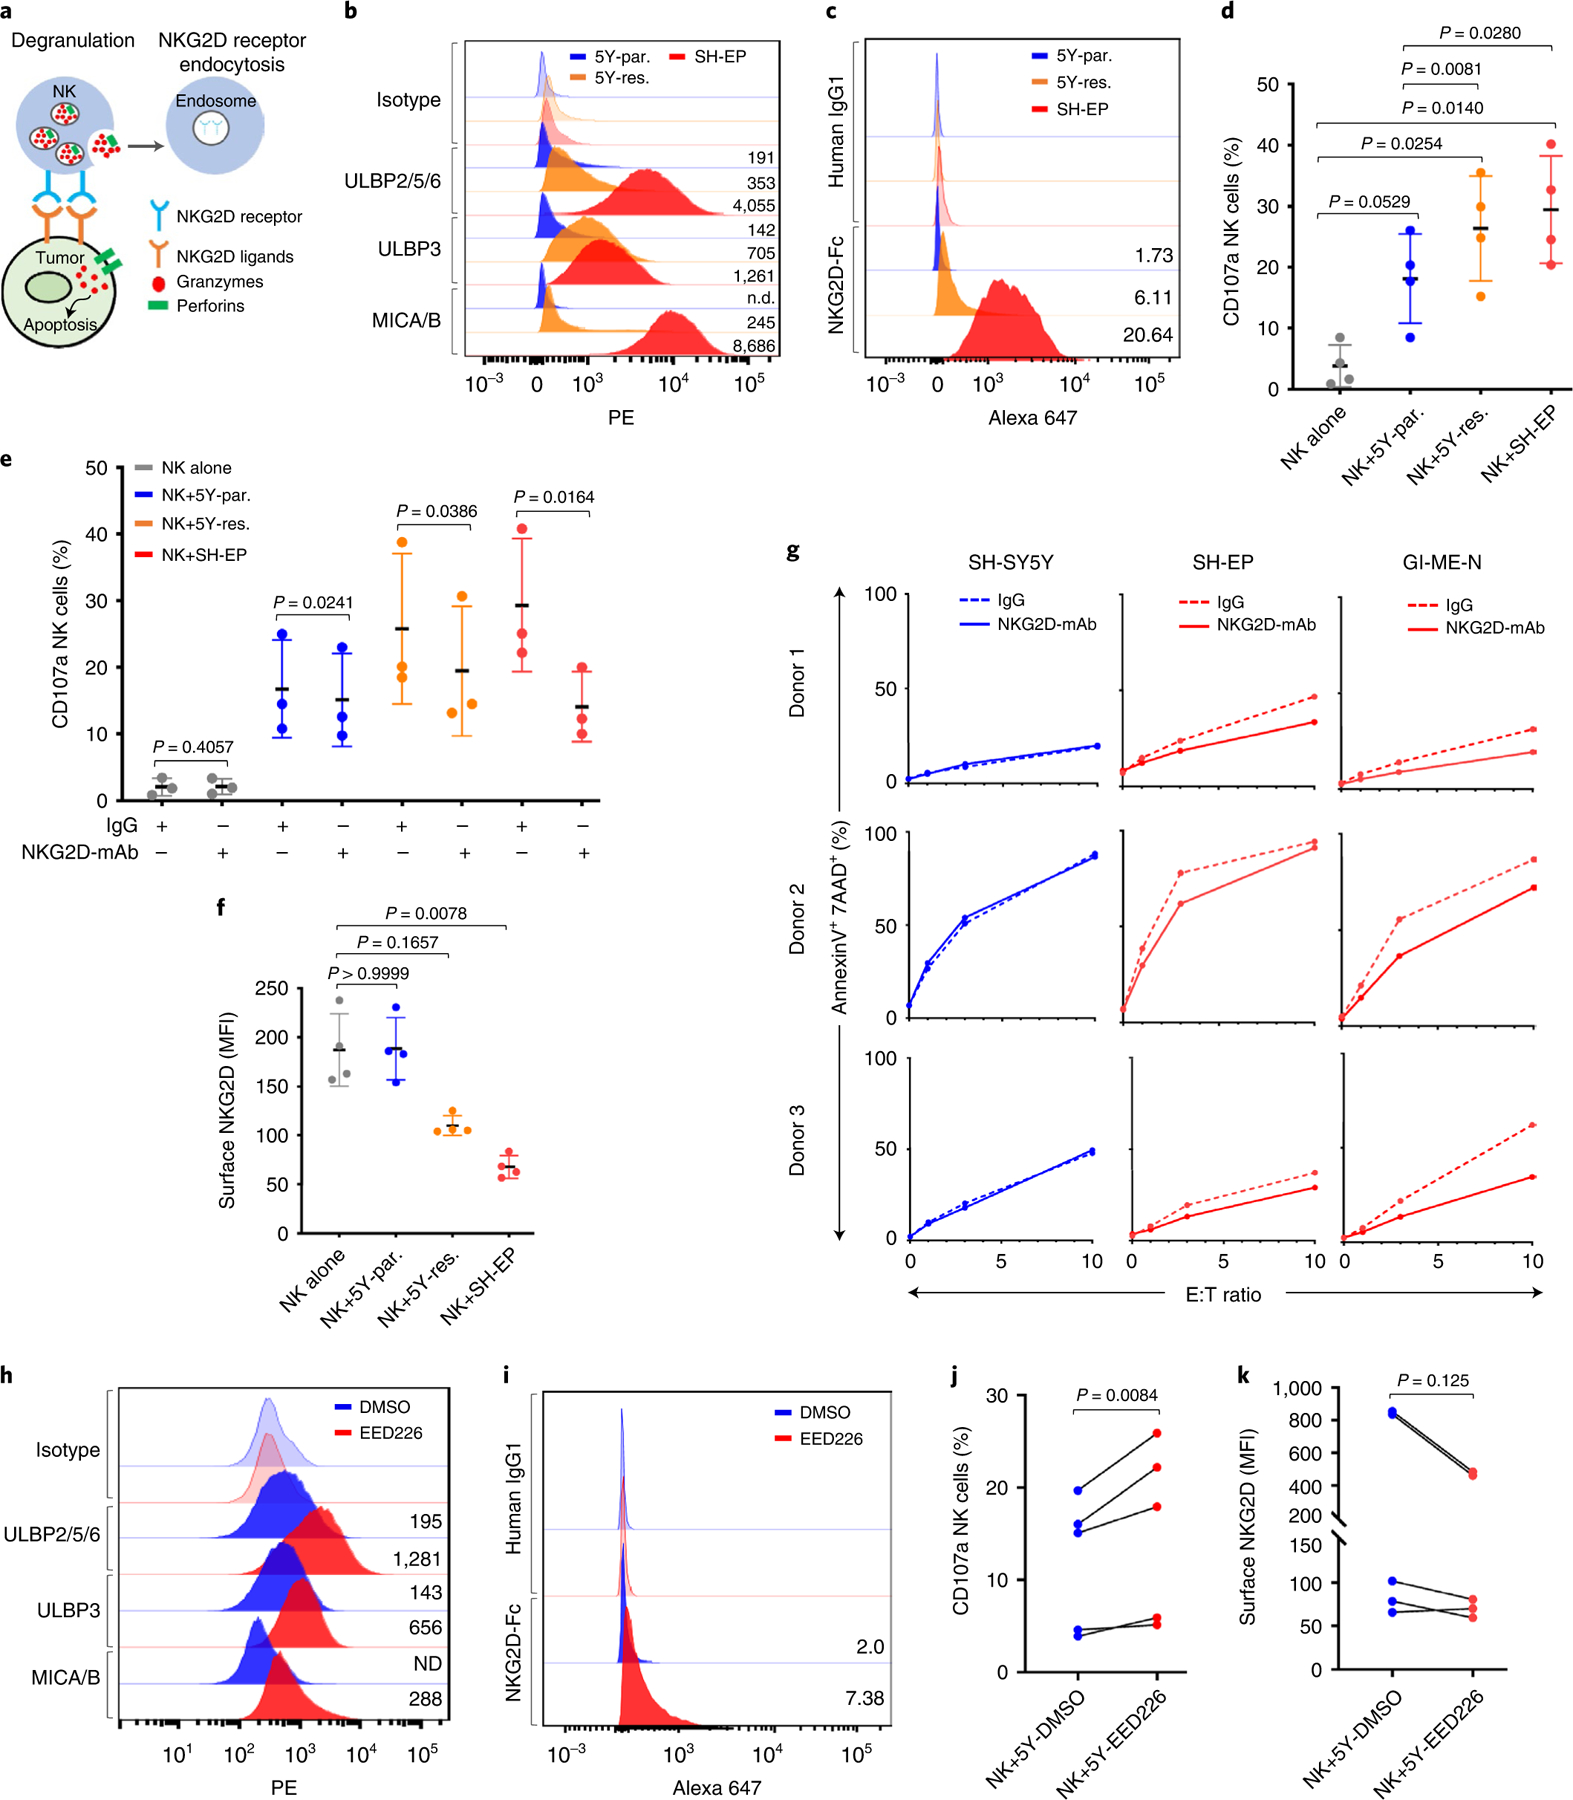
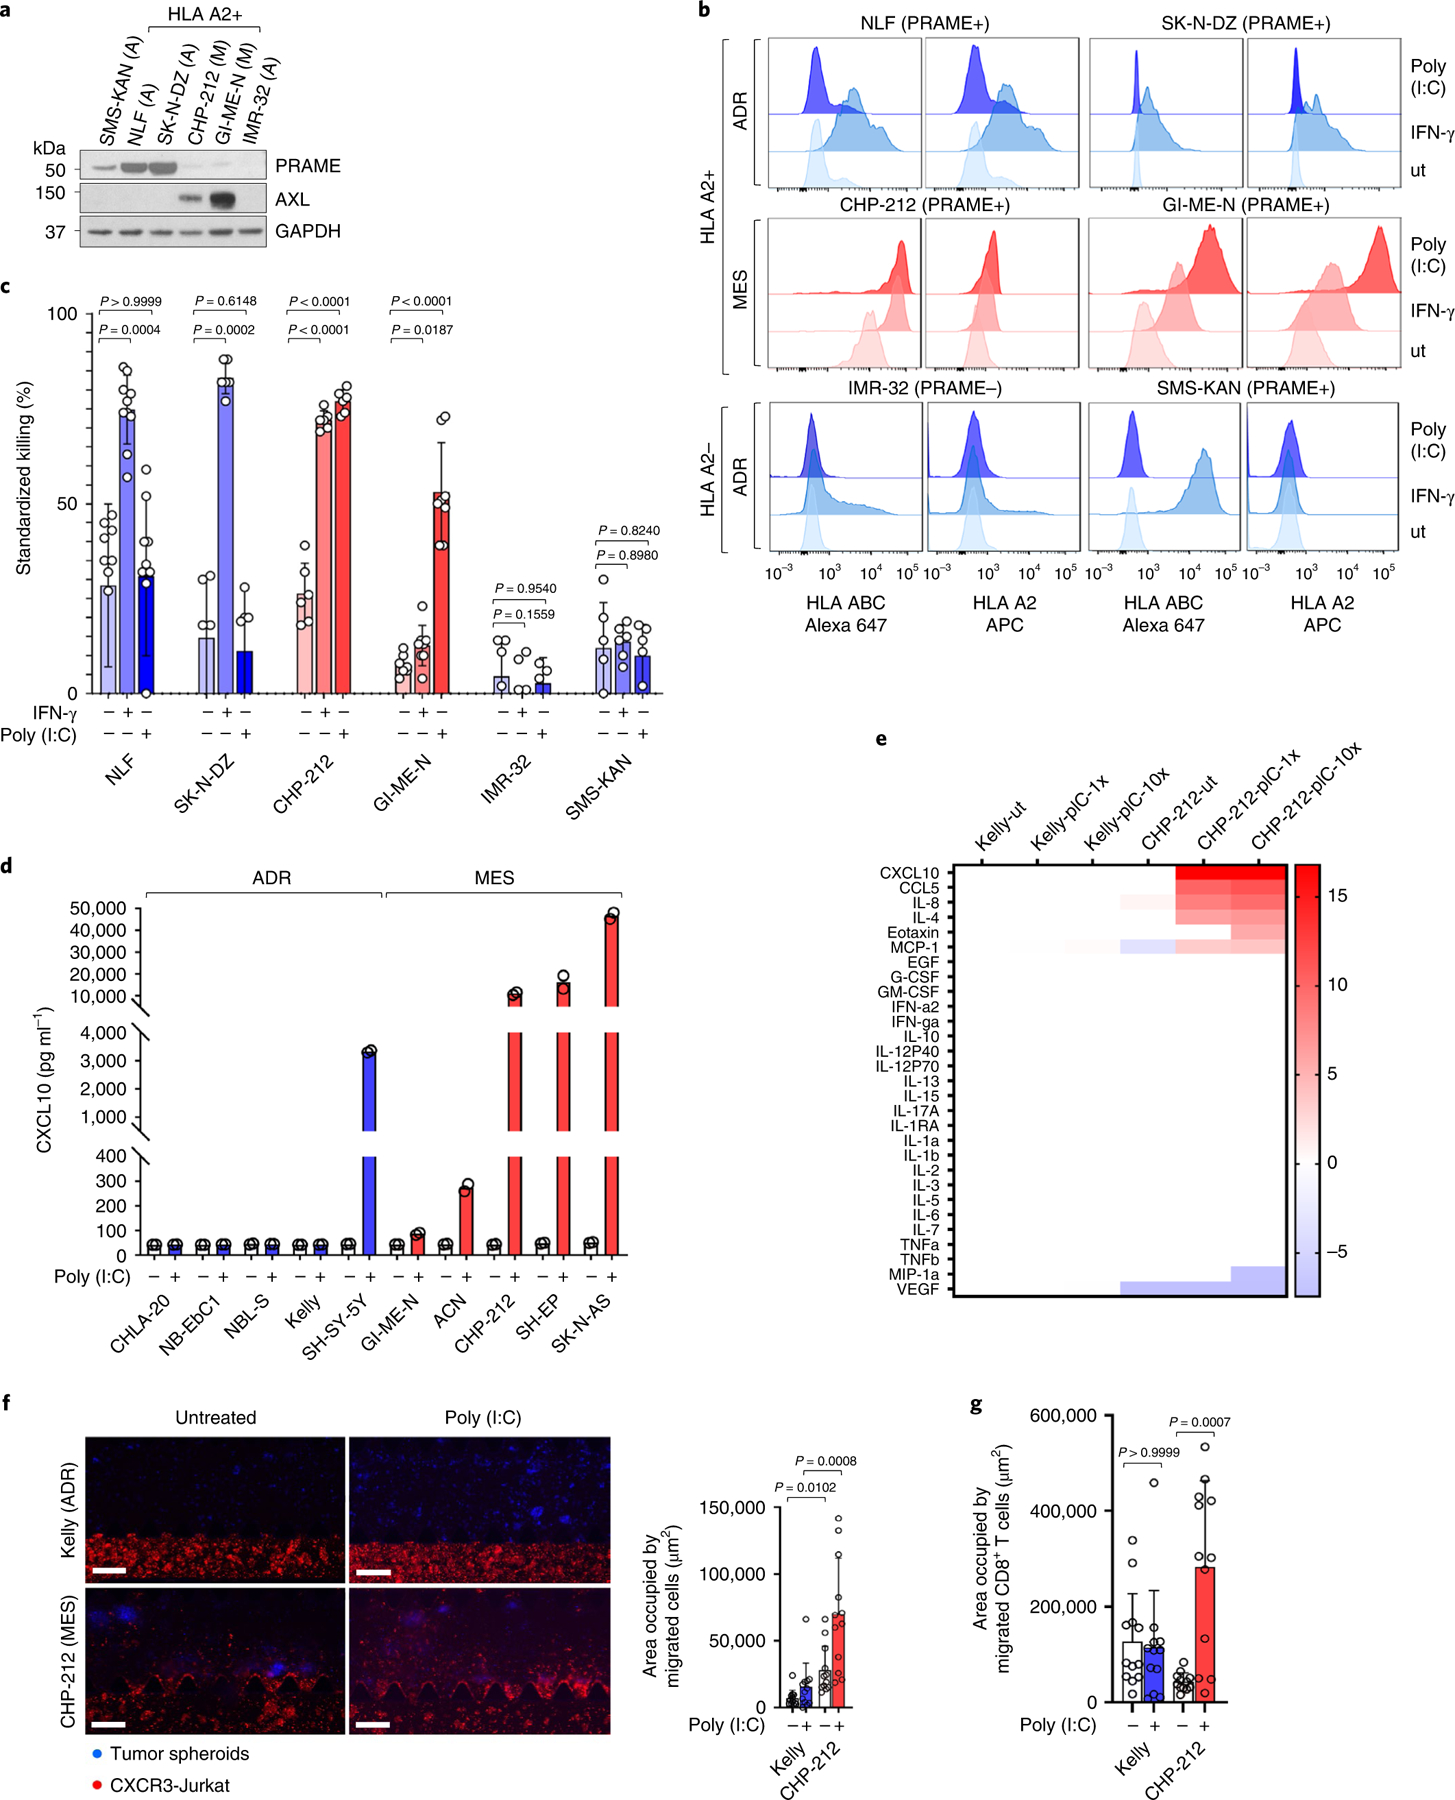
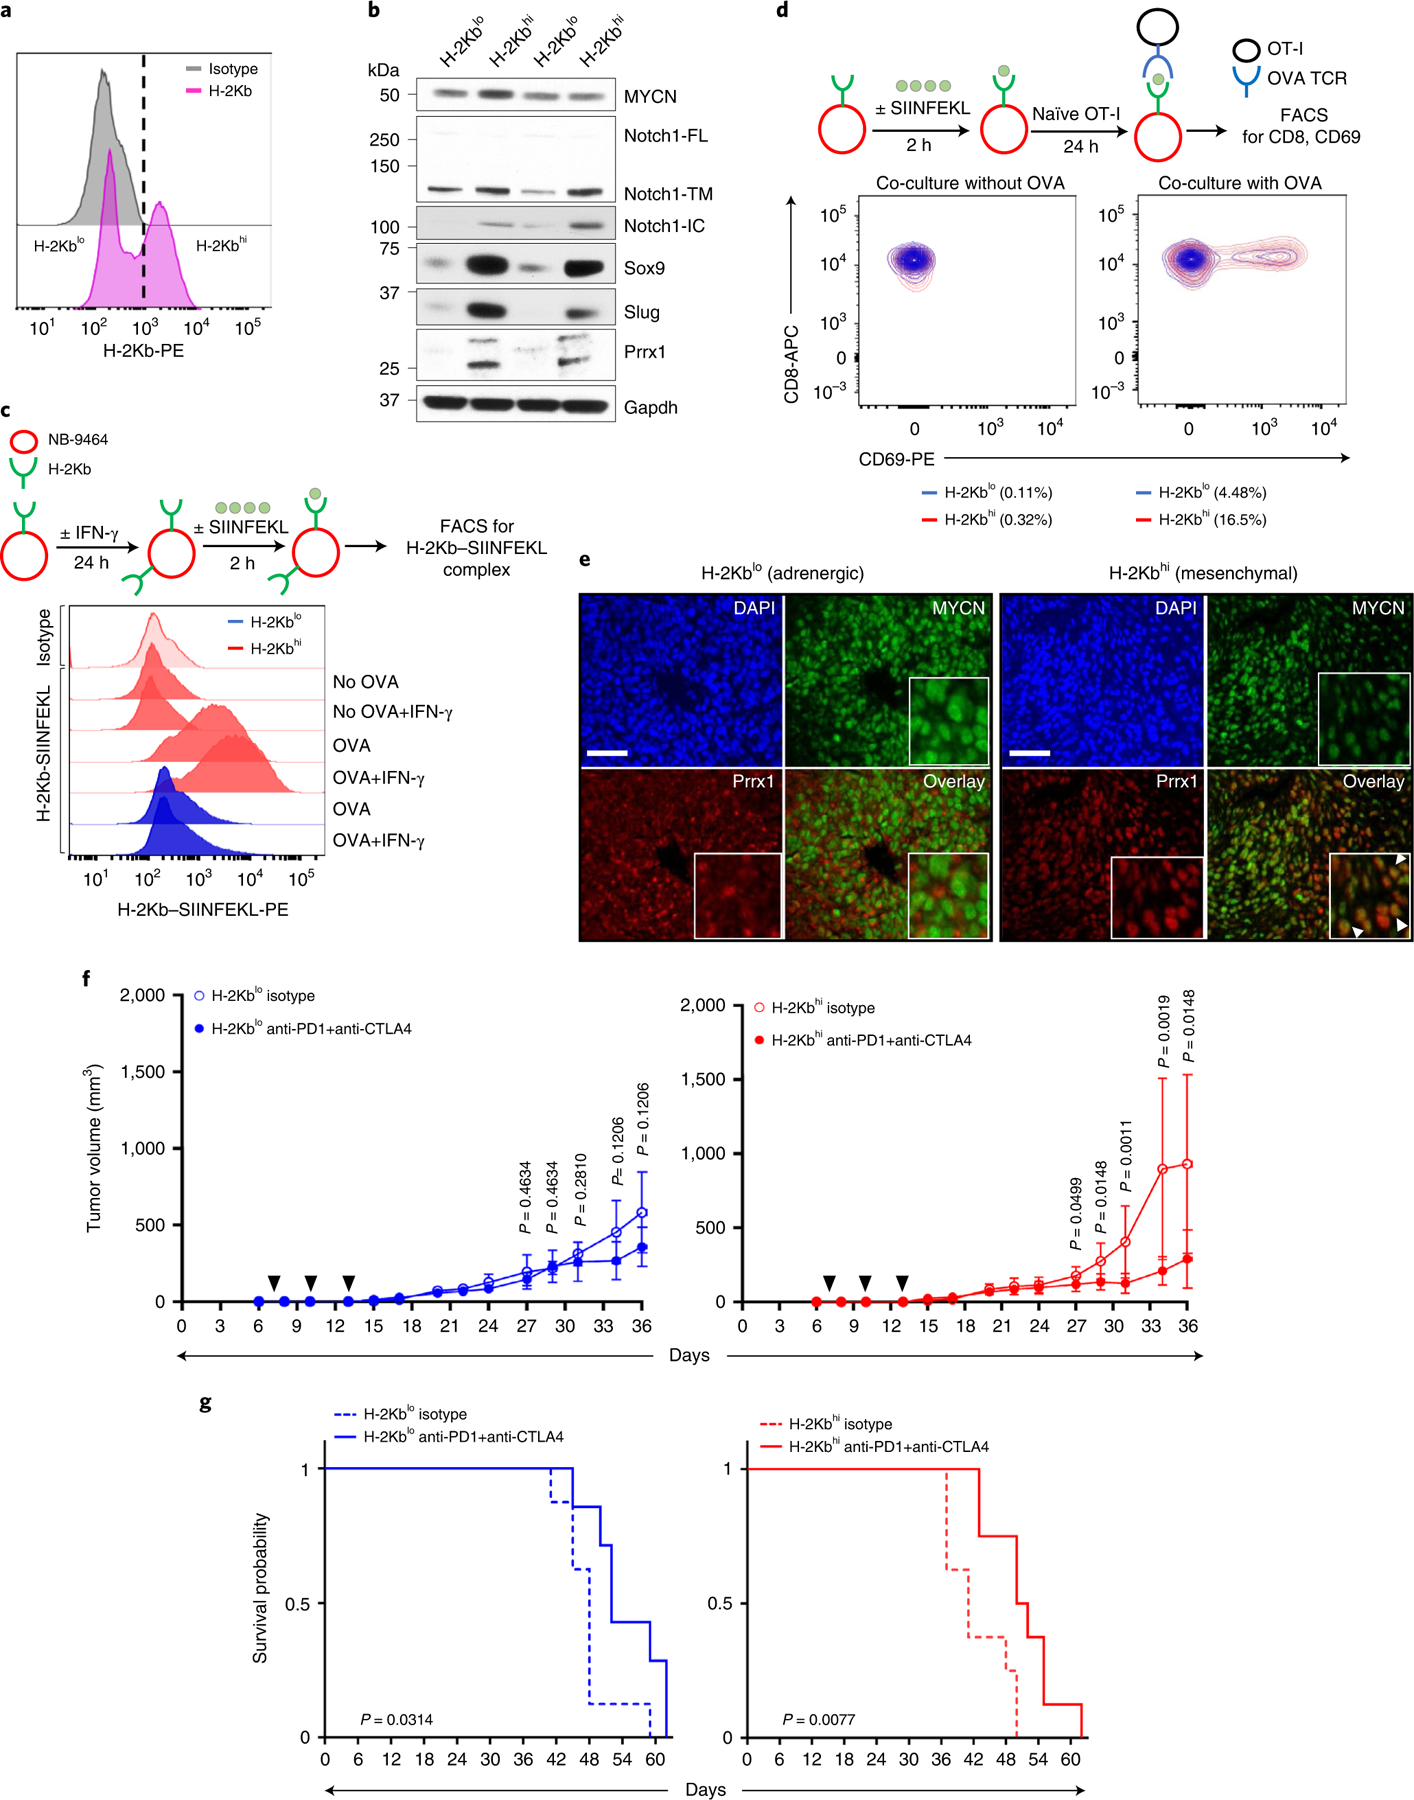
Apart from the anti-GD2 antibody, immunotherapy for neuroblastoma has had limited success due to immune evasion mechanisms, coupled with an incomplete understanding of predictors of response. Here, from bulk and single-cell transcriptomic analyses, we identify a subset of neuroblastomas enriched for transcripts associated with immune activation and inhibition and show that these are predominantly characterized by gene expression signatures of the mesenchymal lineage state. By contrast, tumors expressing adrenergic lineage signatures are less immunogenic. The inherent presence or induction of the mesenchymal state through transcriptional reprogramming or therapy resistance is accompanied by innate and adaptive immune gene activation through epigenetic remodeling. Mesenchymal lineage cells promote T cell infiltration by secreting inflammatory cytokines, are efficiently targeted by cytotoxic T and natural killer cells and respond to immune checkpoint blockade. Together, we demonstrate that distinct immunogenic phenotypes define the divergent lineage states of neuroblastoma and highlight the immunogenic potential of the mesenchymal lineage.


Conflict of interest statement

Competing interests

The authors declare no competing interests.

Figures

Extended Data Fig. 1 |
Extended Data Fig. 1 |. Tumors within the immunogenic cluster express both IA and IE markers.
a, Distribution of the 498 primary NB tumors in the data set (SEQC-498; GSE49711) within the indicated prognostic categories. Risk stratification was based on the Children’s Oncology Group risk classification. INSS, International Neuroblastoma Staging System. b, Scatter plot of the standardized variance in expression of all protein coding genes within the 498 tumors. Red dots indicate the top 5000 variably expressed genes. c, Elbow plot representing the percentage variance for the top 20 principal components, PCs (n = 20). d, Violin plots showing the expression of representative marker genes across the four clusters in 498 tumors. e, Stacked bar plots showing the distribution of tumors within the defined prognostic features within each cluster. Amp, amplified; Nonamp, nonamplified. f, Two-dimensional UMAP representations of the gene expression profiles in 394 NB tumors (GSE120572). Each dot represents a tumor. The top 3000 highly variable genes were selected based on the variance-stabilizing method and 20 significant principal components (PCs) selected and processed in UMAP to generate three clusters representing three NB subtypes. The DEGs were identified for each cluster using the receiver operating characteristics (ROC) curve to compare one cluster with others (log2 FC > 0.25). g, Heat map of expression values of 10 representative DEGs within each cluster in (f). Rows are z-score scaled average expression levels for each gene in all three clusters. h, i, Box plots comparing IA (h) and IE (i) scores within the four clusters (n = 103 tumors in Hi-MYCN, 241 in neuronal, 140 in Immunogenic and 14 in metabolic) from the SEQC-498 tumor data set. All box plots are defined by center lines (medians), box limits (25th and 75th percentiles) and whiskers (minima and maxima; the smallest and largest data range). Significance was determined by the two-tailed Wilcoxon rank-sum test. j, UMAP visualization of the distribution of IA and IE scores among the three tumor clusters derived from the 394 NBs in the GSE120572 dataset. Color bar represents normalized z-scores. Values <2.5 and >2.5 were set to −2.5 and +2.5, respectively, to reduce the effects of extreme outliers.
Extended Data Fig. 2 |
Extended Data Fig. 2 |. Cell lineage is significantly associated with immune gene signatures in NB.
a, Bar plots representing the numbers of co-expressed genes within each module. b, GO analysis of co-expressed genes associated with indicated modules (KEGG database). The vertical dashed lines indicate the adjusted P-value of 0.05, two-tailed hypergeometric test. c, Gene network representing all possible interactions in module M1. The topmost connected genes (hubs) are indicated. Hubs derived from module M1 are colored blue (co-expression) and those from the STRING database are indicated in red (interaction). The size of each node corresponds to the degree of interaction. d, Summary of the overlap between the DEGs associated with the four tumor clusters and the adrenergic or mesenchymal signature genes as per Groningen et al., 2017. Significance determined by two-tailed Fisher’s exact test. e, Box plots comparing the expression of adrenergic and mesenchymal scores within the four clusters (n = 498 tumors [Hi-MYCN (n = 103), neuronal (241), immunogenic (140), metabolic (14)] derived from the SEQC-498 tumor data set. All box plots are defined by center lines (medians), box limits (25th and 75th percentiles) and whiskers (minima and maxima; the smallest and largest data range). The immunogenic cluster was compared with the other three clusters and significance determined by the two-tailed Wilcoxon rank-sum test. f, Scatter plot of the 498 primary NB tumors ranked based on increasing M-A scores. g, Pearson correlation matrix showing pairwise correlation values among the indicated parameters. The colors and sizes of the circles indicate the correlation coefficient values, with the least (smaller blue circles) to the most (larger brown circles) degree of association between the parameters shown.
Extended Data Fig. 3 |
Extended Data Fig. 3 |. The relative mesenchymal score (M-A score) is positively correlated with an immunogenic signature.
a, Dot plots showing the distribution of MYCN-nonamplified tumors (n = 400) within each of the clusters based on ranked M-A scores. Tumors from the upper (high M-A) and lower (low M-A) M-A score quartiles are shown (n = 200 tumors; P = 0.0011 for C3). Statistical significance assessed by the two-tailed Fisher’s exact test. b, UMAP visualization of the distribution of adrenergic, mesenchymal, and M-A scores among the three tumor clusters derived from 394 NBs in the GSE120572 dataset. Color bar represents normalized z-scores. Values <2.5 and >2.5 were set to −2.5 and +2.5, respectively, to reduce the effects of extreme outliers. c, Left, Heat map of the indicated immune cell signatures in MYCN-nonamplified tumors (n = 401), ranked by increasing M-A scores. Log2 gene expression values were z-score transformed for heat map visualization. Right, violin plots comparing the quantitative scores of the indicated immune cell signatures in 100 tumors each from the upper (mesenchymal) and lower (adrenergic) quartiles of the tumor M-A scores using the two-sided K-S test. Box plots within the violin plots are defined by center lines (medians), box limits (25th and 75th percentiles) and whiskers (minima and maxima; 1.5X the interquartile range). d, e, Heat maps depicting IA (d) and IE (e) signatures in MYCN-nonamplified tumors, ranked by increasing M-A score. Log2 gene expression values were z-score transformed for visualization. Violin plots comparing the distribution of IA (d) and IE (e) signatures in 100 tumors each from upper (mesenchymal) and lower (adrenergic) quartiles of the tumor M-A scores are shown next to the heat maps. Significance determined by the two-sided K-S test. Box plots within the violin plots are defined as in (c). f, Bar diagram comparing the CIBERSORT-estimated fractional content of the indicated tumor-infiltrating leukocytes between MYCN-nonamplified adrenergic and mesenchymal tumors. Adrenergic and mesenchymal tumors were assigned as in (c). Data represent the mean, n = 100 tumors, P determined by the two-tailed Welch’s t-test.
Extended Data Fig. 4 |
Extended Data Fig. 4 |. Cellular heterogeneity predicts immune gene expression in NB tumors.
a, UMAP embedding of 691 (top left) and 6498 (bottom left) cell signatures derived from two representative MYCN-amplified and nonamplified tumors (NB11 and NB07), respectively. Clusters of transcriptionally similar cells are colored by cell type. UMAP representation of 573 (top right) and 6299 (bottom right) malignant cell signatures from the same samples as in left panel. b, UMAP representation of the distribution of malignant cells in 12 NB tumors. Cells are colored based on the score calculated from the average expression of genes per cell38. c, Ridge plot representing the distributions of the ADR and MES scores of the malignant cells within the indicated clusters. d, Box plot representing ADR and MES scores of 56,597 malignant cells from 14 primary NB tumor samples based on transcriptional diversity (n = 4543 cells in NB01, 66 in NB02, 4429 in NB03, 3914 in NB04, 3769 in NB05, 7782 in NB06, 6047 in NB07, 10675 in NB08, 2353 in NB09, 587 in NB10, 568 in NB11, 3596 in NB12, 1024 in NB13 and 7244 in NB14). Box plots are defined by center lines (medians), box limits (25th and 75th percentiles) and whiskers (minima and maxima; 1.5X the interquartile range).
Extended Data Fig. 5 |
Extended Data Fig. 5 |. NB tumors are highly heterogeneous at the inter- and intra-tumoral level.
a, b, c, UMAP visualization of 63,291 cells from 14 NB tumors, colored by samples (a), cells (b) and cell type (c). d, Scatter plot of M-A scores derived from bulk RNA-seq data from 16 NB tumors (St Jude Cloud). Samples are arranged based on increasing M-A scores. The samples analyzed by IHC are colored in red.
Extended Data Fig. 6 |
Extended Data Fig. 6 |. Tumor cell-intrinsic immune marker genes are upregulated in mesenchymal NBs.
a, Heat maps of lineage marker (blue, adrenergic; red, mesenchymal) and MHC and APM gene (black) expression in the indicated adrenergic and mesenchymal cells (n = 2 independent experiments). Rows are z-scores calculated for each transcript in each cell type. b, FACS analysis of cell surface HLA expression in the cells depicted in a. Numbers on bottom right indicate isotype-normalized HLA gMFI values expressed as mean ± SD, n = 3 independent experiments. c, Heat map of lineage marker (blue, adrenergic; red, mesenchymal), MHC and APM gene (black) expression in SH-SY5Y and SH-EP adrenergic and mesenchymal cells, respectively (n = 2 independent experiments). Rows are z-scores calculated for each transcript in each cell type. d, GO analysis of differentially upregulated genes in mesenchymal SH-EP and adrenergic SH-SY5Y cells. Significance determined by the Fisher’s exact test. e, Volcano plot showing the gene expression changes between mesenchymal SH-EP and adrenergic SH-SY5Y cells. The top ten lineage marker genes are highlighted. The fold changes are represented in log2 scale (X-axis) and the -log10 of the P-values depicted on Y-axis (FDR < 0.1 and log2FC > 1.5). Significance was determined by two-tailed Wald test. f, RT-qPCR analysis of PRRX1 expression in SH-SY5Y cells expressing dox-inducible PRRX1 ± dox for 10 days. Data represent mean ± SD, n = 4 independent experiments. g, Dose-response curves of ceritinib-sensitive (5Y-par.) and -resistant (5Y-res.) cells treated with increasing concentrations of LDK378 for 72 h. Data show mean ± SD, n = 3 technical replicates and is representative of n = 3 independent experiments. h, Venn diagrams depicting the overlap between the DEGs in 5Y-res. cells (compared to 5Y-par. cells) and mesenchymal or adrenergic signatures. P-values were determined by two-tailed Fisher’s exact test. i, Waterfall plot of the fold-change in RNA expression levels of up- and down-regulated genes in 5Y-res. cells compared to 5Y-par. cells; selected lineage and immune genes are highlighted. j, GO analysis of differentially upregulated genes in 5Y-res. compared to 5Y-par. cells. Significance determined by the two-tailed Fisher’s exact test.
Extended Data Fig. 7 |
Extended Data Fig. 7 |. NBs that acquire mesenchymal phenotypes at relapse show increased immune gene expression.
a, PCA plot showing the segregation of the depicted tumors using the 1st and 2nd PCs in 7 matched pairs and 4 single primary tumors. b, c, UMAP plot showing the segregation of primary and relapsed tumors (b) overlaid with the sample numbers (c). d, e, Line plots depicting changes in ADR, MES and M-A (MES-ADR) scores between primary and relapsed tumor pairs in clusters 2 (d) and 3 (e). f, Heat map of z-score-transformed log2 normalized expression values of tumor cell-intrinsic IA and IE genes in the 7 matched tumor pairs (n = 14 tumor samples). g, h, Line plots depicting the changes in the indicated immune cell scores in primary and relapsed tumor pairs in clusters 2 (g) and 3 (h).
Extended Data Fig. 8 |
Extended Data Fig. 8 |. Enrichment of immune cells is seen at relapse in a matched diagnosis-relapsed NB tumor pair.
a, UMAP embedding of single cell profiles (dots) from diagnosis (left; n = 4349 cells) and relapsed (right; n = 771 cells) samples, colored by cell subset signatures. b, UMAP visualization of the distribution of ADR and MES scores of malignant cells at diagnosis (top; n = 4266 cells) and relapse (bottom; n = 113 cells). c, Box plot depicting the ADR (top) and MES (bottom) scores of the malignant cells in each sample [diagnosis (n = 4266), relapse (n = 113)]. Box plots are defined by center lines (medians), box limits (25th and 75th percentiles) and whiskers (minima and maxima; the smallest and largest data range). d, Bar plot representing the proportion of neuroendocrine cells (tumor), fibroblasts, endothelial cells and immune cells in each sample.
Extended Data Fig. 9 |
Extended Data Fig. 9 |. Immune gene activation associated with the mesenchymal state is epigenetically regulated.
a, ChIP-qPCR analysis of the indicated histone marks at the indicated immune gene promoters in SH-SY5Y cells expressing dox-inducible PRRX1 ± dox. Data points represent mean of 2 technical replicates of 2 independent experiments. Enrichments at TAP1 and PSMB9 loci represent the data corresponding to amplicons 4 and 6, respectively, in Fig. 4a. b, Enhancer regions in 5Y-par., 5Y-res. and SH-EP cells. H3K27ac bound regions identified as significant peaks were stitched together if they were within 12.5 kb of each other (typical enhancers; grey). SEs (red) were defined as stitched enhancers surpassing the threshold signal based on the inclination point in all cell types. In 5Y-par., 5Y-res. and SH-EP cells, 2.94% (915/31116), 6.56% (1880/28635) and 4.18% (1215/29057) of the enhancers were classified as SEs, respectively. The top five SE-associated lineage-specific genes are highlighted. c, ChIP-qPCR analysis of EZH2 and SUZ12 enrichment at the indicated immune genes in 5Y-par. cells. Negative control loci, PHOX2B and LIN28B. Data represent mean of n = 2 independent experiments. d, e, Scatter plots representing the differential binding of the indicated histone marks at the promoter regions of all protein coding genes between 5Y-par and 5Y-res. (d), and 5Y-par. and SH-EP cells (e). rpm/bp, reads per million per base pair. A ≥ 0.75 log2FC threshold was used to identify unique peaks for each histone mark. f, Bar plots representing the numbers of immune genes with increased promoter deposition of H3K4me3 and H3K27ac (log2 FC ≥ 0.75) and loss of H3K27me3 (log2 FC ≥ 0.75) marks, together with increased RNA expression (log2 FC ≥ 1) in 5Y-res. (left) or SH-EP (right) compared to 5Y-par. cells. g, Violin plots of the ratios of active to repressive histone marks surrounding immune gene promoters in the indicated cells. Significance determined by the two-tailed Wilcoxon rank-sum test. Box plots within the violin plots defined by center lines (medians), box limits (25th and 75th percentiles) and whiskers (minima and maxima; 1.5X the interquartile range).
Extended Data Fig. 10 |
Extended Data Fig. 10 |. Tumors derived from NB-9464 H-2Kbhi cells show mesenchymal properties.
a, FACS plot showing gating conditions for sorting NB-9464 cells into H-2Kbhi and H-2Kblo populations. X-axis, side scatter; Y axis, H-2Kb fluorescence intensity. A logscale expression value of 103 was used to gate H-2Kbhi (≥ 103) and H-2Kblo (<103) populations. b, FACS analyses of H-2Kb expression (dark colored histograms) in H-2Kblo and H-2Kbhi cells compared to isotype controls (light colored histograms). Plots representative of 2 independent experiments. c, Left, Bright field images of crystal violet-stained H-2Kblo and H-2Kbhi cells in transwell migration assays. Scale bar, 100 µm. Right, Quantification of migrating cells per high-power field (HPF). Data represent mean ± SD of cells from three HPFs per cell line, significance derived using unpaired two-tailed Student’s t-test. Data representative of n = 3 independent experiments. d, Quantification of the relative invasiveness of H-2Kblo and H-2Kbhi cells. Data represent mean ± SD from three technical replicates, significance derived using unpaired two-tailed Student’s t-test. Data representative of 2 independent experiments. e, RT-qPCR analysis of H-2Kb expression in H-2Kblo and H-2Kbhi tumors and the cell lines from which they were derived. Data were normalized to H-2Kb expression in H-2Kblo cells and represent mean ± SD, n = 3 tumors per group, P determined by the unpaired two-tailed Student’s t-test. f, Tumor volumes in C57BL/6 mice injected subcutaneously with 1 ×10⁶ H-2Kblo or H-2Kbhi cells and treated with anti-PD1 + anti-CTLA4 antibodies or isotype control (black arrowheads) on days 7, 10, and 13 after tumor inoculation. Data represent growth of individual mouse tumors, n = 8, H-2Kblo isotype; n = 7, H-2Kblo anti-PD1 + anti-CTLA4; n = 8, H-2Kbhi isotype; n = 8, H-2Kbhi anti-PD1 + anti-CTLA4. g, FACS analysis of the ratios between tumor infiltrating CD8 + T or conventional T (Tcon) and Treg cells (CD8:Treg and Tcon:Treg, respectively) in H-2Kblo and H-2Kbhi tumors treated with isotype control or anti-PD1 + anti-CTLA4 antibodies. Data represent medians with interquartile ranges, n = 5 tumors per group.
Fig. 1 |
Fig. 1 |. A subset of neuroblastomas expresses signatures of an immune response.
a, Two-dimensional UMAP representations of the gene expression profiles in 498 neuroblastoma (NB) tumors. Each dot represents a tumor. The top 5,000 highly variable genes were selected based on the variance-stabilizing method and 20 significant principle components (PCs) selected and processed to generate clusters representing four NB subtypes. Differentially expressed genes (DEGs) were identified for each cluster using the receiver operating characteristics (ROC) curve to compare one cluster with the other three (log2FC > 0.25). b, GO analysis of DEGs in the four clusters. Significance was assessed by the two-tailed Fisher’s exact test. c, Heat map of expression values of ten representative DEGs within each cluster. Rows are z-score-scaled average expression levels for each gene in all four clusters. d, UMAP visualization of the distribution of the indicated prognostic features among the four clusters. e,f, Heat map of z-score-transformed log2 normalized expression values of IA (e) and IE (f) genes in MYCN-nonamplified NBs (n = 401 tumors). Tumors were ranked based on increasing IA or IE scores. Cluster annotations of the tumors are indicated on the top horizontal bar.
Fig. 2 |
Fig. 2 |. The mesenchymal cell state is associated with an immunogenic signature.
a, GO analysis of coexpressed genes associated with module M1, n = 847 genes. The vertical dashed line indicates the adjusted P value of 0.05. Significance was determined by the two-tailed hypergeometric test. b, UMAP visualization of the distribution of adrenergic and mesenchymal scores among the four tumor clusters. Color bar represents normalized z-scores. Values <2.5 and >2.5 were set to −2.5 and +2.5, respectively, to reduce the effects of extreme outliers (n = 498 tumors). c, Left: heat map representation of tumor cell-intrinsic IA gene expression in MYCN-amplified tumors (n = 92). Samples are ranked by increasing M − A score. The log2 gene expression values were z-score-transformed for visualization. Right: violin plots of tumor immune score distribution, classified as adrenergic or mesenchymal based on the median M − A score. Box plots within the violin plots are defined by center lines (medians), box limits (25th and 75th percentiles) and whiskers (minima and maxima; 1.5 × interquartile range). Significance was determined by the two-tailed Kolmogorov–Smirnov (KS) test. d, Heat map of the hierarchical clustering of z-score-transformed fractional content of the indicated TILs within the four clusters (n = 498 tumors). e,f, UMAP visualization of scRNA-seq data from 56,597 malignant cells from 14 primary NB tumor samples clustered on the basis of transcriptional diversity (e) and the distribution of adrenergic (ADR) and mesenchymal (MES) scores (f, upper). Lower: box plots representing the ADR and MES scores of the malignant cell clusters (cluster 0, n = 26,678; cluster 1, n = 22,664; cluster 2, n = 7,255 cells). g, UMAP visualization (upper) and box plot representation (lower left) of the immune scores of the malignant cell clusters in e. Box plots (lower right) of the immune scores from the upper (MES) and lower (ADR) quartiles of the tumor cells (n = 1,000) ranked according to M − A scores. Significance was determined by the two-tailed KS test. Box plots (f, g) are defined as in c. h, Hematoxylin & eosin (H&E) and IHC analyses of the indicated lineage markers and infiltrating CTLs in human NB tumors arranged based on M − A score. Data are representative of seven tumors. Scale bar, 25 μm.
Fig. 3 |
Fig. 3 |. Reprogramming adrenergic cells to the mesenchymal lineage induces immune gene expression.
a, Scatter plot of IA scores in human NB cell lines arranged based on increasing scores and designated as adrenergic or mesenchymal based on lineage-specific gene expression. b, Western blot (WB) analysis of lineage markers and APPs in NB cells (n = 2 independent repeats). c, Waterfall plot of the fold-change in RNA expression levels of up- and downregulated genes in SH-EP compared with SH-SY5Y cells. Significance was determined by the two-tailed Wald test. d, Left: WB analysis of the indicated proteins in SH-SY5Y cells expressing dox-inducible PRRX1 in the presence or absence of dox (200 ng ml−1) at the indicated time points (n = 3 independent experiments). Right: WB analysis of the indicated proteins in SH-SY5Y cells expressing WT or DNA-binding (DB) mutants of PRRX1 (n = 1 independent experiment). e, RT–qPCR analysis of immune response genes in the same cells as in d. Data represent mean ± standard deviation (s.d.) (n = 4 independent experiments). f, FACS analysis of HLA expression following PRRX1 overexpression in SH-SY5Y cells at the indicated time points. PRRX1 induction for 10, 16 and 23 days led to a 2.07 ± 0.127 (P = 0.0066), 1.95 ± 0.097 (P = 0.0031) and 1.61 ± 0.021 (P < 0.0001) fold increase in HLA geometric mean fluorescent intensity (gMFI), respectively. Data represent mean ± s.d. (n = 3 independent experiments); two-tailed paired Student’s t-test. g, FACS analysis of MICA/MICB expression after PRRX1 induction for 24 days as in f. Plots are representative of two independent experiments. h, Heat maps of lineage gene signatures (top), and individual lineage marker, APP and NKG2D ligand gene expression (bottom) in 5Y-par. and 5Y-res. cells (n = 2 independent experiments). Rows represent z-scores of log2 expression values. i, WB analysis of lineage marker and APP pathway genes in the indicated cells (n = 3 independent experiments). PRRX1 panels represent two different exposures. GAPDH or β-actin was used as loading control in immunoblots. NS, not significant.
Fig. 4 |
Fig. 4 |. Activation of immune gene expression associated with cell state transition is epigenetically regulated.
a, Upper: linear representation of TAP1 and PSMB9 gene loci showing the locations of the bidirectional promoter and IRF1 and NF-κB binding sites. Lower: ChIP–qPCR analysis of H3K4me3 and H3K27me3 enrichment at the indicated amplicons (1–8, shown in red in upper) in SH-SY5Y cells expressing dox-inducible PRRX1 in the presence or absence of dox (200 ng ml−1) for 10 days. Data points represent mean of two technical replicates of two independent experiments. b, Metagene representations of average ChIP–seq occupancies of the indicated histone marks at the promoters of tumor cell-intrinsic immune genes (TSS ± 2 kb) in 5Y-par. (n = 143 genes), 5Y-res. (n = 114 genes) and SH-EP cells (n = 114 genes). c, Heat map of histone enrichment at the same immune gene promoters as in b, ranked in decreasing order of occupancy in the indicated cells. Each row represents the normalized densities of histone marks within a ±2 kb window centered on the TSS. d,e, Representation of pair-wise comparisons between 5Y-par. and 5Y-res. cells (d), and 5Y-par. and SH-EP cells (e). The changes (+, gained; −, lost) in occupancies of the active (H3K4me3, H3K27ac) and repressive (H3K27me3) histone marks (log2FC ≥ 0.75, TSS ± 2 kb), together with the corresponding changes in RNA expression (+, overexpressed; log2FC ≥ 1) of each of the tumor cell-intrinsic immune genes analyzed in b, are shown. f, ChIP–seq tracks depicting the gain of active histone binding together with the loss of repressive histone binding at MICB and ULBP3 gene loci (left) or gain of active marks without changes in repressive mark occupancy at IFIT3 and STING loci (right). Signal intensity is given at the top left corner of each track. g, Loess regression analysis of the correlation between the ratios of active to repressive histone binding at the promoters of immune response genes and their RNA expression. Genes are ranked based on increasing expression. Shaded regions represent 95% confidence intervals. UTR, untranslated region.
Fig. 5 |
Fig. 5 |. Mesenchymal NB cells induce NKG2D-dependent NK activation.
a, Schematic interaction between NKG2D receptors and cognate ligands, leading to NK cell degranulation and receptor endocytosis. b, FACS analysis of NKG2D ligands in the indicated cells. Plots are representative of four independent experiments; numbers indicate isotype-normalized gMFI. c, FACS analysis of recombinant NKG2D-Fc or IgG1 binding in the indicated cells. Numbers denote fold-change in Alexa-647 median fluorescent intensity (MFI) (NKG2D-Fc/IgG1) (n = 3 independent experiments, P = 0.0040, one-way ANOVA followed by test for linear trend). d, Dot plot quantifying degranulation in naïve NK cells (NK alone) or following coculture with indicated targets. Data represent mean ± s.d., four independent experiments. Significance was calculated using repeated measures (RM) one-way ANOVA with the Geisser–Greenhouse correction followed by Sidak’s multiple comparisons test. e, Dot plot quantifying the effect of control IgG1 or NKG2D blocking antibody on NK cell degranulation following coculture with the indicated targets. Data represent mean ± s.d., three independent experiments. Significance was calculated using the two-tailed ratio paired t-test. f, Dot plot quantifying NKG2D MFI in NK cells following coculture with the indicated targets. Data represent means ± s.d., four independent experiments. Significance was calculated using Friedman test followed by Dunn’s multiple comparisons test. g, X–Y plots of NK cell cytotoxicity with control IgG1 or anti-NKG2D antibody against the indicated targets. Data represent three independent experiments. h, FACS analysis of NKG2D ligands in SH-SY5Y cells treated with DMSO or EED226 (5 µM for 8 d). Plots are representative of two independent experiments. Numbers indicate isotype-normalized gMFI. i, FACS analysis of NKG2D-Fc or IgG1 binding in SH-SY5Y cells treated with either DMSO or EED226 as in f. Numbers indicate fold-change in Alexa-647 MFI (NKG2D-Fc/IgG1) (n = 3 independent experiments, P = 0.0060, two-tailed paired t-test). j,k, Before–after plots of degranulation (j) and NKG2D MFI (k) following coculture of naïve NK cells with SH-SY5Y cells treated with DMSO or EED226. Data in j and k represent five independent experiments. Significance in j was derived using the two-tailed ratio paired t-test and in k using the two-tailed Wilcoxon matched-pairs signed rank test. DMSO, dimethylsulfoxide; ND, not determined; PE, phycoerythrin.
Fig. 6 |
Fig. 6 |. Mesenchymal NB cells are killed by antigen-specific CTLs.
a, WB analysis of PRAME and AXL in the indicated adrenergic (A) or mesenchymal (M) NB cells. GAPDH, loading control. b, FACS analysis of HLA subtypes in the indicated cells, untreated (ut) or following IFN-γ or poly(I:C). Data (a, b) are representative of two independent experiments. c, Bar graphs quantifying cytotoxicity of PRAME-specific CTLs against neuroblastoma cells following IFN-γ (100 U ml−1) or poly(I:C) (10 µg ml−1) × 24 h and coculture at an E:T ratio of 10:1. Data represent mean ± s.d. of n = 10 (NLF), n = 6 (SK-N-DZ, CHP-212,SMS-KAN) and n = 8 (GI-ME-N) independent experiments for all conditions, and n = 6 (untreated and IFN-γ) and n = 4 (poly(I:C)) independent experiments in IMR-32 cells. Significance was derived using the Friedman test followed by Dunn’s multiple comparisons test (NLF); mixed-effects analysis followed by Sidak’s multiple comparisons test (IMR-32); and repeated-measures one-way ANOVA and Geisser–Greenhouse correction followed by Sidak’s multiple comparisons test (SK-N-DZ, CHP-212, GI-ME-N, SMS-KAN). d, ELISA analysis of CXCL10 in conditioned media from the indicated neuroblastoma cells ± poly(I:C) (1 µg ml−1) for 24 h. Data represent mean of two independent experiments, P = 0.0485, Kruskal–Wallis test followed by Dunn’s multiple comparisons test. e, Heat map of log2FCs in the expression of the indicated proteins in conditioned media from adrenergic Kelly or mesenchymal CHP-212 cells, untreated (ut) or treated with 1 or 10 µg ml−1 poly(I:C) (pIC-1x or pIC-10x) × 24 h, and analyzed using multiplex cytokine profiling. Data were normalized to the Kelly-ut sample. f, Left: immunofluorescence images of CXCR3-Jurkat cell migration toward Kelly or CHP-212 spheroids grown in a 3D microfluidic device ± poly(I:C). Scale bar, 200 µm. Right: quantification of area occupied by migrated cells. Data represent mean ± s.d., 12 regions of interest (ROIs) per condition, significance derived using Kruskal–Wallis test followed by Dunn’s multiple comparisons test. g, Quantification of area occupied by CD8+ T cells migrating toward the tumor spheroids in f. Data represent means ± s.d., 12 ROIs per condition. Significance was calculated as in f. Data in f and g are representative of two independent experiments each.
Fig. 7 |
Fig. 7 |. Mesenchymal NB cells functionally engage with cytotoxic T cells and are responsive to ICB.
a, FACS analysis of H-2Kb expression in NB-9464 cells. The vertical dashed line denotes the logscale expression value used to gate H-2Kblo and H-2Kbhi populations. Data are representative of two independent experiments. b, WB analysis of lineage markers in H-2Kblo and H-2Kbhi cell populations. n = 2 independent experiments. Notch1-FL, full length; -TM, transmembrane; -IC, intracellular. GAPDH, loading control. c, Upper: schematic of OVA binding assay. Lower: FACS analysis of H-2Kb–SIINFEKL complex in H-2Kbhi and H-2Kblo cells at baseline or following IFN-γ (100 ng ml−1 × 24 h) ± OVA peptide. Data are representative of one independent experiment. d, Upper: schematic of NB-9464-OT-I coculture assay. Lower: contour plots showing the percentage of naïve OT-I cells that were activated (CD8+ CD69+) following coculture with H-2Kblo and H-2Kbhi cells for 24 h with or without the OVA peptide. Data are representative of one independent experiment. e, Immunofluorescence images of MYCN and Prrx1 expression in murine tumors derived from H-2Kblo and H-2Kbhi cells. Nuclei are counterstained with DAPI. Insets: nuclear costaining of MYCN and Prrx1 (arrowheads). Scale bar, 100 µm. Data are representative of n = 3 tumors for each group. f, Tumor volumes in C57BL/6 mice injected subcutaneously with 1 × 10⁶ H-2Kblo or H-2Kbhi cells and treated with anti-PD1 + anti-CTLA4 antibodies or isotype control on days 7, 10 and 13 after tumor inoculation (black arrowheads). Data represent mean ± s.d. n = 8 (H-2Kblo isotype); n = 7 (H-2Kblo anti-PD1 + anti-CTLA4); n = 8 (H-2Kbhi isotype); n = 8 (H-2Kbhi anti-PD1 + anti-CTLA4) mice per group across all time points. Significance was calculated using the two-tailed Mann–Whitney test. g, Kaplan–Meier analysis of mice bearing H-2Kblo or H-2Kbhi tumors treated with isotype or anti-PD1 + anti-CTLA4 antibodies as in f. Significance was determined by the log-rank test.

References

    1. Cheung NK & Dyer MA Neuroblastoma: developmental biology, cancer genomics and immunotherapy. Nat. Rev. Cancer 13, 397–411 (2013). - PMC - PubMed
    1. Barker E et al. Effect of a chimeric anti-ganglioside GD2 antibody on cell-mediated lysis of human neuroblastoma cells. Cancer Res 51, 144–149 (1991). - PubMed
    1. Yu AL et al. Anti-GD2 antibody with GM-CSF, interleukin-2, and isotretinoin for neuroblastoma. N. Engl. J. Med 363, 1324–1334 (2010). - PMC - PubMed
    1. Federico SM et al. A pilot trial of humanized anti-GD2 monoclonal antibody (hu14.18K322A) with chemotherapy and natural killer cells in children with recurrent/refractory neuroblastoma. Clin. Cancer Res 23, 6441–6449 (2017). - PMC - PubMed
    1. Merchant MS et al. Phase I clinical trial of ipilimumab in pediatric patients with advanced solid tumors. Clin. Cancer Res 22, 1364–1370 (2016). - PMC - PubMed

Publication types