. 2022 Dec;6(12):1691-1704.
doi: 10.1038/s41562-022-01445-0. Epub 2022 Sep 22.

Efficient stabilization of imprecise statistical inference through conditional belief updating

Affiliations

Efficient stabilization of imprecise statistical inference through conditional belief updating

Julie Drevet et al. Nat Hum Behav. 2022 Dec.

Abstract

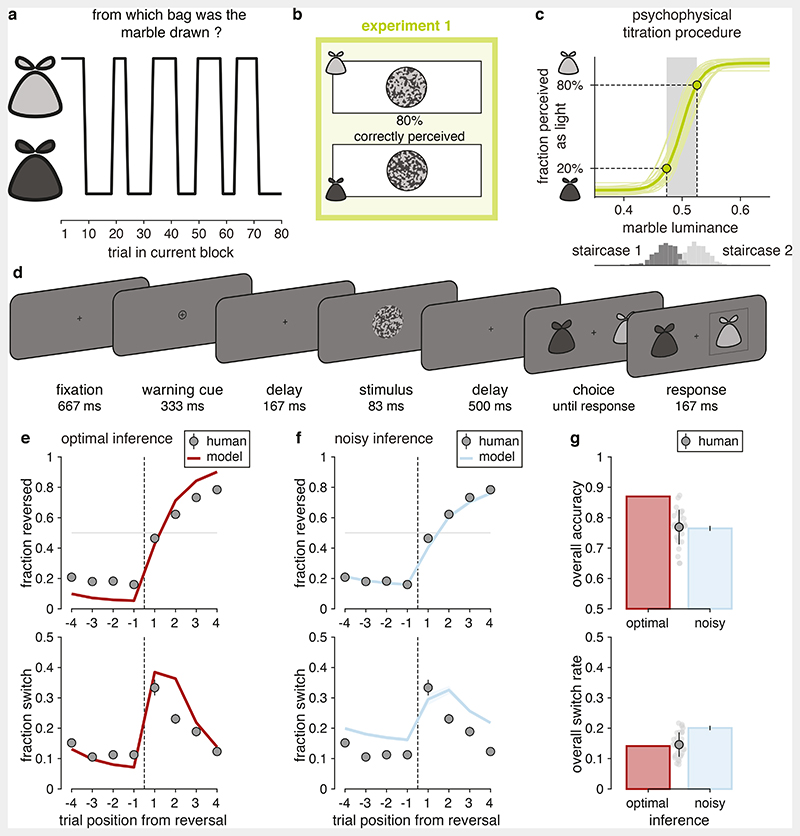
Statistical inference is the optimal process for forming and maintaining accurate beliefs about uncertain environments. However, human inference comes with costs due to its associated biases and limited precision. Indeed, biased or imprecise inference can trigger variable beliefs and unwarranted changes in behaviour. Here, by studying decisions in a sequential categorization task based on noisy visual stimuli, we obtained converging evidence that humans reduce the variability of their beliefs by updating them only when the reliability of incoming sensory information is judged as sufficiently strong. Instead of integrating the evidence provided by all stimuli, participants actively discarded as much as a third of stimuli. This conditional belief updating strategy shows good test-retest reliability, correlates with perceptual confidence and explains human behaviour better than previously described strategies. This seemingly suboptimal strategy not only reduces the costs of imprecise computations but also, counterintuitively, increases the accuracy of resulting decisions.


Conflict of interest statement

Competing interests

The authors declare no competing interests.

Figures

Figure 1
Figure 1. Description of experiment 1 (N = 30).
(a) Structure of the volatile decision-making task. Each block of trials features alternations between draws from the light and dark bags. (b) Visual stimuli. The overall marble luminance is titrated such that 20% of presented marbles are miscategorized. (c) Adaptive titration procedure. Top: psychometric curves estimated by the titration procedure (thin lines: participants; thick line: group-level average). Bottom: distributions of marble luminance presented by the staircases titrating the dark and light marbles. (d) Trial description. 500 ms after a warning cue, a marble stimulus is presented for 83 ms, after which the participant indicates the bag from which marbles are currently drawn. (e) Predictions of optimal inference. Top: response reversal curves indicating the fraction of correct responses toward the new drawn bag surrounding each reversal. Bottom: response switch curves indicating the fraction of trial-to-trial response switches surrounding the same reversals. The reversal is represented by the thin dotted line. Dots indicate human data (group-level average), whereas lines indicate predictions of optimal inference. Error bars correspond to s.e.m. (f) Predictions of the noisy inference model. Top: response reversal curve predicted by the best-fitting noisy inference model (blue line). Bottom: response switch curve predicted by the best-fitting noisy inference model (blue line). Noisy inference captures well the accuracy of behavior surrounding reversals (top), but overestimates the variability of the same behavior (bottom). Same conventions as in (e). Shaded areas correspond to s.e.m. (g) Discrepancies between models and human behavior. Top: overall accuracy of participants (gray dot with error bar indicate the mean and s.d. of all participants, light gray dots indicate single participants), optimal inference (red bar) and noisy inference (blue bar). Bottom: overall switch rate of participants, optimal inference and noisy inference. Despite their suboptimal accuracy participants make response switches as often as optimal inference. Error bars on simulated noisy inference model (blue bars) correspond to s.e.m.
Figure 2
Figure 2. Candidate response stabilization strategies.
A marble (stimulus s) is drawn from a given bag (category c = light or dark) at each trial. (a) At the perception stage, the continuous sensory response to the stimulus, corrupted by sensory noise σsen, is categorized into a binary sensory percept ŝ (light or dark). A perceptual bias, controlled by parameter λ, biases the perceptual categorization toward the current belief x at stimulus onset by shifting the categorization criterion. (b) At the inference stage, the current belief x (expressed as the log-posterior odds ratio between the two bags) is updated as a function of the hazard rate h (prior term) and the incoming sensory percept ŝ (likelihood term). The inference process is corrupted by inference noise σinf. Belief stabilization is achieved either through conditional inference, by discarding stimuli whose associated sensory responses do not exceed a reliability threshold δ, or through a random fraction ρ of random inference lapses during which the current belief is not updated. (c) At the selection stage, the current belief x is sampled with selection noise σsel to obtain a category response ĉ, corresponding to the bag perceived as being currently active (light or dark). Response stabilization is achieved either through a repetition bias toward the previous category response, controlled by parameter β, or through a random fraction ε of blind response repetitions (response lapses).
Figure 3
Figure 3. Predicted effects of response stabilization strategies.
(a) Simulated effects of the five candidate strategies on response switch curves (top row) and response reversal curves (bottom row). The parameters controlling each response stabilization strategy (λ, δ, ρ, β, ε) is set to match participants’ overall switch rate. The other parameters (h, σsen, σinf, σsel) are fixed to their best-fitting values for the noisy inference model without response stabilization. Solid colored lines correspond to the reversal behavior of each candidate model, whereas dotted gray lines correspond to the reversal behavior of the noisy inference model without response stabilization (same for all panels). The conditional inference strategy stands out from other strategies on the first trial after reversal (arrow). (b) Simulated effects of the five candidate strategies on response switches just before and after a reversal. Fraction of response switches on the last trial before each reversal (dotted lines) and the first trial after each reversal (solid lines) for each response stabilization strategy. Dots correspond to stabilization parameters set as in (a). All candidate strategies reduce simultaneously response switches before and after reversals, except for conditional inference which reduces response switches only before reversals (i.e., when they are not warranted). Shaded areas around curves in (a) and (b) correspond to s.e.m.
Figure 4
Figure 4. Belief stabilization through conditional inference (N = 30).
(a) Confusion matrix between response stabilization strategies depicting exceedance probabilities pexc obtained from exante model recovery. The ‘ground-truth’ response stabilization strategy used to simulate synthetic behavior was correctly recovered with pexc > 0.97 for all five strategies, including conditional inference (the model that best describes participants’ behavior) with pexc > 0.99. (b) Randomeffects Bayesian model selection of the best-fitting strategy in participants’ data. Bars indicate the estimated model probabilities for the five candidate strategies. The conditional inference model (M3) best describes the behavior of more participants than other candidate strategies with pexc > 0.999. Model probabilities are presented as mean and s.d. of the estimated Dirichlet distribution. The dashed line corresponds to the uniform distribution. (c) Simulations of response stabilization strategies fitted to participants’ data. Simulated response switch curves (top row) and response reversal curves (bottom row) based on the best-fitting parameters of each model. The mean best-fitting parameter (mean ± s.e.m.) is shown in the top-left corner for each subpanel. Solid colored lines correspond to the reversal behavior of each stabilized model, whereas dotted gray lines correspond to the reversal behavior of the noisy inference model without response stabilization (same for all panels). Dots indicate human data (group-level average). Only the conditional inference model reproduces participants’ reversal behavior. Shaded areas and error bars correspond to s.e.m.
Figure 5
Figure 5. Description of experiment 2 (N = 30).
(a) Visual stimuli. Each bag is filled with three types of marbles, corresponding respectively to 70%, 80% and 90% of correctly categorized stimuli, using the same adaptive titration procedure as in experiment 1. (b) Titration trials with confidence reports. Participants were asked to categorize the presented marble as light or dark, and report simultaneously their confidence level as rather high or low. Participants received auditory feedback after each titration trial. (c) Relation between decision confidence and accuracy in titration trials. For each binned luminance, participants’ fraction of correct decisions for confident (green) and unconfident (red) trials (top panel), and participants’ fraction of confident decisions for correct (solid line) and error (dashed line) trials (bottom panel). Confidence is expressed relative to each participant’s mean confidence (dashed line). Shaded areas correspond to s.e.m. (d) Predictions of optimal inference as a function of stimulus strength on the first trial following each reversal. Top: response reversal curves indicating the fraction of responses toward the new drawn bag surrounding each reversal. Bottom: response switch curves indicating the fraction of trial-to-trial response switches surrounding the same reversals. The reversal is represented by the thin dotted line. Dots indicate human data (group-level average), whereas lines indicate predictions of optimal inference. Error bars correspond to s.e.m. (e) Predictions of the noisy inference model as a function of stimulus strength on the first trial following each reversal. Noisy inference captures well the accuracy of behavior surrounding reversals (top), but overestimates the variability of behavior (bottom). Same conventions as in (d). Shaded areas correspond to s.e.m. (f) Discrepancies between models and human behavior. Top: overall accuracy of participants (gray dot with error bar indicate the mean and s.d. of all participants, light gray dots indicate single participants), optimal inference (red bar) and noisy inference (blue bar). Bottom: overall switch rate of participants, optimal inference and noisy inference. Despite their suboptimal accuracy, participants make response switches as often as optimal inference. Error bars on simulated noisy inference model (blue bars) correspond to s.e.m.
Figure 6
Figure 6. Validation of specific predictions of conditional inference (N = 30).
(a) Decrease in evidence discard rate with stimulus strength. The reliability threshold does not vary with stimulus strength, resulting in discard rates which decrease with stimulus strength (one blue dot per participant). Black dots represent group-level means and error bars represent their associated standard deviations. Horizontal blue lines represent group-level medians. (b) Selective relation between reliability and confidence criteria. Left panel: correlation between confidence threshold and reliability threshold across participants. As predicted by conditional inference, the reliability threshold estimated in the volatile decision-making task correlates positively with the confidence threshold estimated when categorizing isolated stimuli. Parameters are presented as mean ± s.d. of posterior distributions of each fit. Shaded area corresponds to the 95% confidence interval for the regression line. Right panel: variance of confidence threshold explained by each model parameter. The reliability threshold shares more variance with the confidence threshold than the other two model parameters. Bars correspond to r2 and error bars to the interquartile ranges of each r2 measure obtained through bootstrapping (N = 104).
Figure 7
Figure 7. Interindividual variability in conditional inference (N = 60).
(a) Distribution of conditional inference model parameter values across participants from both experiments. Best fitting parameters and their median value (dotted lines) with density approximation (solid blue lines). (b) Pairwise relations between the parameters of the conditional inference model. Parameters are only mildly correlated with one another. Parameters are presented as mean ± s.d. of posterior distributions of each fit. (c) Distinct gradients of behavioral variability associated with each parameter of the conditional inference model (left: hazard rate; middle: inference noise; right: reliability threshold). Response switch curves (top) and response reversal curves (bottom) obtained by sorting participants in two median-split groups as a function of the best-fitting value of each parameter. Lines correspond to simulations of the best-fitting conditional inference model, whereas dots correspond to participants’ behavior. Percentages indicate the variance in response switch curves (top row) and response reversal curves (bottom row) explained by each parameter. Shaded areas and error bars correspond to s.e.m.
Figure 8
Figure 8. Increased decision accuracy through conditional inference.
(a) Simulated effects of response stabilization strategies on decision accuracy. Fraction of overall correct responses when increasing each stabilization parameter drops for all models except for the conditional inference model, for which it increases the accuracy by +5.5% for δ * = 1.28. Dots correspond to the best simulated accuracy. (b) Observed effects of best-fitting model parameters on human decision accuracy. For each best-fitting conditional inference model parameter, corresponding human accuracy (dots) and robust regression (solid blue lines, r-squared = 0.859, p < 0.001). Inverted U-shaped relation between reliability threshold and accuracy (negative quadratic coefficient, b5, p = 0.002). Shaded area corresponds to the 95% confidence interval for predicted values. Parameters are presented as mean ± s.d. of posterior distributions and human accuracy as mean ± s.d. given the number of trials provided. Top right insets correspond to estimated regression coefficients presented as mean ± s.e.m. (c) Predicted effects of best-fitting model parameters on modeled decision accuracy. For each best-fitting conditional inference model parameter, corresponding conditional inference model predicted accuracy (diamonds) and robust regression (solid blue lines). Inverted U-shaped relation between reliability threshold and accuracy (negative quadratic coefficient b5, p < 0.001). Shaded areas correspond to the 95% confidence interval for predicted values. Parameters are presented as mean ± s.d. of posterior distributions and vertical error bars correspond to the accuracy s.d. of best-fitting model simulations. Top right insets correspond to estimated regression coefficients presented as mean ± s.e.m.

References

    1. Wald A, Wolfowitz J. Optimum character of the sequential probability ratio test. Ann Math Stat. 1948;19:326–339.
    1. Bogacz R, Brown E, Moehlis J, Holmes P, Cohen JD. The physics of optimal decision making: a formal analysis of models of performance in two-alternative forced-choice tasks. Psychol Rev. 2006;113:700–765. - PubMed
    1. Green DM, Swets JA. Signal detection theory and psychophysics. xi. John Wiley; 1966. p. 455.
    1. Drugowitsch J, Wyart V, Devauchelle A-D, Koechlin E. Computational precision of mental inference as critical source of human choice suboptimality. Neuron. 2016;92:1398–1411. - PubMed
    1. Wyart V, Koechlin E. Choice variability and suboptimality in uncertain environments. Curr Opin Behav Sci. 2016;11:109–115.

Publication types

LinkOut - more resources